You are not logged in.
This means you
CAN ONLY VIEW reports that were published prior to Sunday, February 18, 2024.
You
MUST UPGRADE YOUR MEMBERSHIP if you want to see any current reports.
AFTER MARKET UPDATE - WEDNESDAY, DECEMBER 26TH, 2018
Previous After Market Report Next After Market Report >>>
|
|
|
|
DOW |
+1,086.25 |
22,878.45 |
+4.98% |
|
Volume |
1,066,848,450 |
+62% |
|
Volume |
2,552,153,370 |
+57% |
|
NASDAQ |
+361.44 |
6,554.36 |
+5.84% |
|
Advancers |
2,646 |
87% |
|
Advancers |
2,477 |
79% |
|
S&P 500 |
+116.60 |
2,467.70 |
+4.96% |
|
Decliners |
384 |
13% |
|
Decliners |
651 |
21% |
|
Russell 2000 |
+62.89 |
1,329.81 |
+4.96% |
|
52 Wk Highs |
4 |
|
|
52 Wk Highs |
7 |
|
|
S&P 600 |
+38.02 |
831.88 |
+4.79% |
|
52 Wk Lows |
807 |
|
|
52 Wk Lows |
712 |
|
|
 |
Major Indices Bounced From Lows With One Big Day of Gains
Kenneth J. Gruneisen - Passed the CAN SLIM® Master's Exam
Stocks finished firmly higher Wednesday. The Dow soared 1,086 points to 22,878, posting its largest daily point gain on record. The S&P 500 rallied 116 points to 2,467, while the Nasdaq Composite surged 361 points to 6,554.The volume totals were higher than the prior holiday-shortened session's totals on the NYSE and on the Nasdaq exchange. Advancers led decliners by almost a 7-1 margin on the NYSE and near a 4-1 margin on the Nasdaq exchange. Leadership remained elusive, however, as only one high-ranked company from the Leaders List made a new 52-week high and was listed on the BreakOuts Page. New 52-week lows totals solidly outnumbered new 52-week highs totals which were still in the single digits on both the NYSE and on the Nasdaq exchange. The major indices (M criteria) are still in a correction despite the big day of gains. Disciplined investors will wait for a convincing follow-through day, ideally between Day 4 and Day 7 of the rally attempt, to signal a change in market direction (M criteria) back to a bullish stance. The Featured Stocks Pageprovides the most timely analysis on high-ranked leaders. Charts used courtesy of www.stockcharts.com
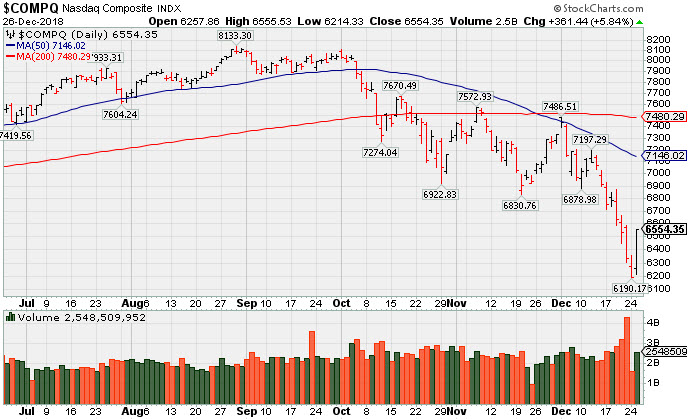
PICTURED: The Nasdaq Composite Index rebounded from a new 2018 low, marking Day 1 of a new rally attempt.
The major averages snapped a four-session losing streak which left the Dow and S&P 500 within 1% of bear market territory. Investor sentiment was seemingly lifted after comments from a White House economic advisor assured that Fed Chairman Jerome Powell’s job is “100% safe” and President Trump calling the recent market rout a “tremendous opportunity to buy”. On the data front, a report from S&P/Case-Shiller showed gains in U.S. home prices decelerate for a seventh consecutive month in October. Separately, the December manufacturing activity gauge for the Richmond Fed district fell to the lowest level since June 2016.
All 11 S&P 500 sectors ended in positive territory with eight groups surging more than 4.5%. Consumer Discretionary shares led the advance with Amazon (AMZN +9.45%) rebounded impressively after reporting a record-breaking number of items were sold during the holiday season. Target (TGT +5.78%) rose after a MasterCard (MA +6.47%) report showed 2018 was the strongest holiday shopping season in six years. Energy stocks also outperformed as WTI crude surged 8.7% to $46.22/barrel.
Treasuries weakened along the curve with the yield on the 10-year note up seven basis points to 2.81%. In commodities, COMEX gold added 0.1% to $1,269.20/ounce. |
 Kenneth J. Gruneisen started out as a licensed stockbroker in August 1987, a couple of months prior to the historic stock market crash that took the Dow Jones Industrial Average down -22.6% in a single day. He has published daily fact-based fundamental and technical analysis on high-ranked stocks online for two decades. Through FACTBASEDINVESTING.COM, Kenneth provides educational articles, news, market commentary, and other information regarding proven investment systems that work in good times and bad.
Comments contained in the body of this report are technical opinions only and are not necessarily those of Gruneisen Growth Corp. The material herein has been obtained from sources believed to be reliable and accurate, however, its accuracy and completeness cannot be guaranteed. Our firm, employees, and customers may effect transactions, including transactions contrary to any recommendation herein, or have positions in the securities mentioned herein or options with respect thereto. Any recommendation contained in this report may not be suitable for all investors and it is not to be deemed an offer or solicitation on our part with respect to the purchase or sale of any securities. |
|
 |
Retail, Financial, Tech, and Energy-Linked Groups Posted Big Gains
Kenneth J. Gruneisen - Passed the CAN SLIM® Master's Exam
The Retail Index ($RLX +7.14%), Broker/Dealer Index ($XBD +4.39%), and the Bank Index ($BKX +4.82%) each posted substantial gains. The tech sector had a positive bias as the Semiconductor Index ($SOX +5.77%), Biotech Index ($BTK +5.99%) and Networking Index ($NWX +4.73%) ended unanimously higher. Energy-linked groups had a positive bias as the Oil Services Index ($OSX +6.45%) and Integrated Oil Index ($XOI +6.42%) both notched solid gains, meanwhile the Gold & Silver Index ($XAU -0.81%) was a standout decliner.
Charts courtesy of www.stockcharts.com
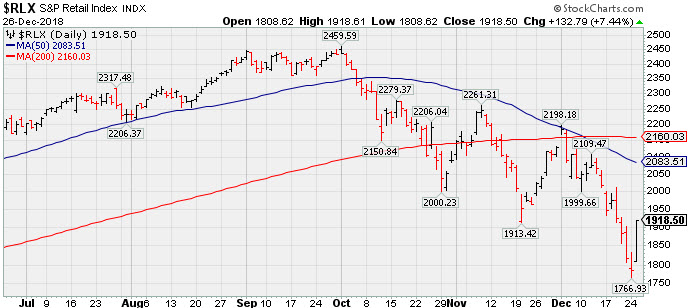 PICTURED: The Retail Index ($RLX +7.14%) posted a big gain, rebounding after a steep slump.
| Oil Services |
$OSX |
80.58 |
+4.88 |
+6.45% |
-46.12% |
| Integrated Oil |
$XOI |
1,154.28 |
+69.58 |
+6.42% |
-13.57% |
| Semiconductor |
$SOX |
1,131.10 |
+61.71 |
+5.77% |
-9.73% |
| Networking |
$NWX |
473.78 |
+21.40 |
+4.73% |
-3.42% |
| Broker/Dealer |
$XBD |
234.04 |
+9.85 |
+4.39% |
-11.76% |
| Retail |
$RLX |
1,918.50 |
+132.79 |
+7.44% |
+10.65% |
| Gold & Silver |
$XAU |
69.98 |
-0.57 |
-0.81% |
-17.93% |
| Bank |
$BKX |
84.67 |
+3.89 |
+4.82% |
-20.65% |
| Biotech |
$BTK |
4,123.27 |
+232.90 |
+5.99% |
-2.34% |
|
|
|
 |
|
|
|
Color Codes Explained :
Y - Better candidates highlighted by our
staff of experts.
G - Previously featured
in past reports as yellow but may no longer be buyable under the
guidelines.
***Last / Change / Volume data in this table is the closing quote data***
Symbol/Exchange
Company Name
Industry Group |
PRICE |
CHANGE
(%Change) |
Day High |
Volume
(% DAV)
(% 50 day avg vol) |
52 Wk Hi
% From Hi |
Featured
Date |
Price
Featured |
Pivot Featured |
|
Max Buy |
MLR
-
NYSE
Miller Industries Inc
AUTOMOTIVE - Auto Parts
|
$26.30
|
+0.29
1.11% |
$26.50
|
44,215
126.33% of 50 DAV
50 DAV is 35,000
|
$29.40
-10.54%
|
11/30/2018
|
$28.35
|
PP = $29.50
|
|
MB = $30.98
|
 Most Recent Note - 12/26/2018 4:51:51 PM
G - Rebounded above its closely coinciding 50-day and 200-day moving average (DMA) lines with today's gain on average volume. Resistance remains due to overhead supply up to the $29 level.
>>> FEATURED STOCK ARTICLE : Failed to Produce Buy Signal and Deterioration Raised Concern - 12/20/2018 |
View all notes |
Set NEW NOTE alert |
Company Profile |
SEC
News |
Chart |
Request a new note
C
A
S
I |
UBNT
-
NASDAQ
Ubiquiti Networks
TELECOMMUNICATIONS - Diversified Communication Serv
|
$97.17
|
+4.16
4.47% |
$97.22
|
268,410
56.99% of 50 DAV
50 DAV is 471,000
|
$115.44
-15.83%
|
11/9/2018
|
$108.20
|
PP = $101.43
|
|
MB = $106.50
|
Most Recent Note - 12/26/2018 4:55:10 PM
G - Posted a gain today on light volume. A rebound above the 50 DMA line ($100.50) is needed for its outlook to improve.
>>> FEATURED STOCK ARTICLE : Volume Totals Cooling While Still Hovering Above "Max Buy" Level - 12/11/2018 |
View all notes |
Set NEW NOTE alert |
Company Profile |
SEC
News |
Chart |
Request a new note
C
A
S
I |
PLNT
-
NYSE
Planet Fitness Inc Cl A
Leisure-Services
|
$51.70
|
+2.65
5.40% |
$51.91
|
1,448,114
117.54% of 50 DAV
50 DAV is 1,232,000
|
$58.50
-11.62%
|
11/7/2018
|
$57.10
|
PP = $55.45
|
|
MB = $58.22
|
Most Recent Note - 12/26/2018 4:54:14 PM
G - Rebounded above its 50 DMA line ($51.61) with today's gain on average volume. Faces resistance due to overhead supply up to the $58.50 level. Found support near the recent low ($48.02 on 11/20/18) and above its 200 DMA line ($46.61) which defines the next important support. More damaging losses would raise concerns and trigger technical sell signals.
>>> FEATURED STOCK ARTICLE : Fitness Firm Remains Near High Despite Unhealthy Environment - 12/14/2018 |
View all notes |
Set NEW NOTE alert |
Company Profile |
SEC
News |
Chart |
Request a new note
C
A
S
I |
INVA
-
NASDAQ
Innoviva Inc
Medical-Biomed/Biotech
|
$16.74
|
+0.85
5.35% |
$16.81
|
573,473
49.44% of 50 DAV
50 DAV is 1,160,000
|
$18.60
-10.00%
|
11/23/2018
|
$17.74
|
PP = $18.09
|
|
MB = $18.99
|
Most Recent Note - 12/26/2018 4:50:10 PM
Y - Color code is changed to yellow after rebounding above its 50 DMA line ($16.38) helped its outlook to improve. Faces near-term resistance due to overhead supply up to the $19.60 level.
>>> FEATURED STOCK ARTICLE : Perched Near High With Volume Totals Cooling - 12/13/2018 |
View all notes |
Set NEW NOTE alert |
Company Profile |
SEC
News |
Chart |
Request a new note
C
A
S
I |
|
|
|
THESE ARE NOT BUY RECOMMENDATIONS!
Comments contained in the body of this report are technical
opinions only. The material herein has been obtained
from sources believed to be reliable and accurate, however,
its accuracy and completeness cannot be guaranteed.
This site is not an investment advisor, hence it does
not endorse or recommend any securities or other investments.
Any recommendation contained in this report may not
be suitable for all investors and it is not to be deemed
an offer or solicitation on our part with respect to
the purchase or sale of any securities. All trademarks,
service marks and trade names appearing in this report
are the property of their respective owners, and are
likewise used for identification purposes only.
This report is a service available
only to active Paid Premium Members.
You may opt-out of receiving report notifications
at any time. Questions or comments may be submitted
by writing to Premium Membership Services 665 S.E. 10 Street, Suite 201 Deerfield Beach, FL 33441-5634 or by calling 1-800-965-8307
or 954-785-1121.
|
|
|

