You are not logged in.
This means you
CAN ONLY VIEW reports that were published prior to Sunday, February 25, 2024.
You
MUST UPGRADE YOUR MEMBERSHIP if you want to see any current reports.
AFTER MARKET UPDATE - TUESDAY, DECEMBER 24TH, 2019
Previous After Market Report Next After Market Report >>>
|
|
|
|
DOW |
-36.08 |
28,515.45 |
-0.13% |
|
Volume |
314,228,920 |
-60% |
|
Volume |
1,002,759,929 |
-49% |
|
NASDAQ |
+7.23 |
8,952.88 |
+0.08% |
|
Advancers |
1,598 |
57% |
|
Advancers |
1,840 |
60% |
|
S&P 500 |
-0.63 |
3,223.38 |
-0.02% |
|
Decliners |
1,208 |
43% |
|
Decliners |
1,215 |
40% |
|
Russell 2000 |
+3.87 |
1,678.01 |
+0.23% |
|
52 Wk Highs |
133 |
|
|
52 Wk Highs |
158 |
|
|
S&P 600 |
+2.02 |
1,024.69 |
+0.20% |
|
52 Wk Lows |
5 |
|
|
52 Wk Lows |
33 |
|
|
 |
Holiday-Shortened Session Left Major Indices Little Changed
Kenneth J. Gruneisen - Passed the CAN SLIM® Master's Exam
The Dow lost 36 points, while the S&P 500 dipped just below the flat line, with each benchmark index on pace to cap a more than 20% advance this year. The Nasdaq Composite added 0.1% to a fresh record high, notching its tenth straight session of gains. Advancers led decliners by a 4-3 margin on the NYSE and 3-2on the Nasdaq exchange. The shortened session's volume totals were much lighter than the prior session on the NYSE and on the Nasdaq exchange. There were 33 high-ranked companies from the Leaders List that hit a new 52-week high and were listed on the BreakOuts Page, versus the total of 71 on the prior session. New 52-week highs totals contracted yet still easily outnumbered new 52-week lows totals on the NYSE and on the Nasdaq exchange. The major indices (M criteria) are in a "confirmed uptrend" after enduring distributional pressure in recent weeks. The Featured Stocks Page provides the most timely analysis on high-ranked leaders. Charts used courtesy of www.stockcharts.com
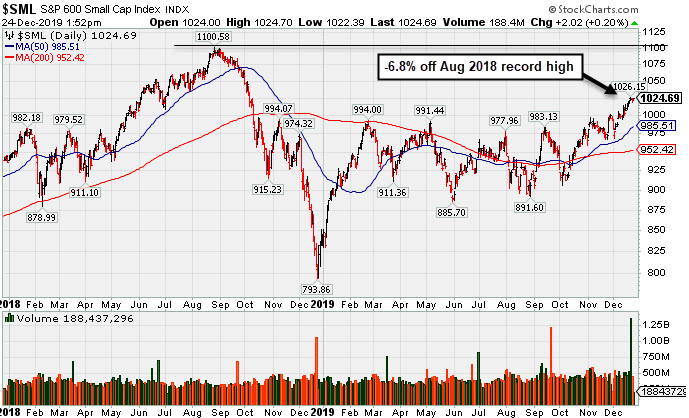
PICTURED: The 2-year graph of the S&P 600 Small Cap Index shows it perched -6.8% off its August 2018 high.
U.S. stocks were slightly higher Tuesday as geopolitical tensions eased and equity markets continued their record run for the shortened Christmas Eve session. The gains followed reports indicating that China will move to roll back tariffs on more than 800 different imports starting January 1st, which will include consumer goods, pharmaceuticals, as well as tech-related items like components for semiconductors.
Six of 11 S&P 500 sectors ended in positive territory, with the Real Estate and Consumer Discretionary groups pacing the gains. Industrial shares were a notable decliner, with Boeing (BA -1.35%) falling after telling suppliers it will suspend 737 MAX jet parts shipments for one-month and it also fired the CEO.
Overseas, the Shanghai Composite rose 0.7% after Beijing signaled to lower corporate finance cost and banks’ reserve requirement ratio. South Korea’s KOSPI retreated 0.6%. In London, the FTSE 100 added 0.1%. The U.S. Dollar Index was little changed at 97.65.
On the data front, the lone update from the Richmond Fed showed manufacturing activity in the central Atlantic region contracted in December, disappointing economists’ forecast for a modest expansion. Prior to the U.S. Treasury market's early closure at 2:00 p.m. ET, the 2-yr yield was down one basis point to 1.64%, and the 10-yr yield was down three basis points to 1.91%.
In commodities, WTI Crude added 0.8% to $60.99/barrel and remains on pace for its largest monthly gain since January. COMEX gold rose 1.1% to $1,499.10/ounce and is on course for its largest yearly gain since 2010 with a year-to-date gain of 16%.
|
 Kenneth J. Gruneisen started out as a licensed stockbroker in August 1987, a couple of months prior to the historic stock market crash that took the Dow Jones Industrial Average down -22.6% in a single day. He has published daily fact-based fundamental and technical analysis on high-ranked stocks online for two decades. Through FACTBASEDINVESTING.COM, Kenneth provides educational articles, news, market commentary, and other information regarding proven investment systems that work in good times and bad.
Comments contained in the body of this report are technical opinions only and are not necessarily those of Gruneisen Growth Corp. The material herein has been obtained from sources believed to be reliable and accurate, however, its accuracy and completeness cannot be guaranteed. Our firm, employees, and customers may effect transactions, including transactions contrary to any recommendation herein, or have positions in the securities mentioned herein or options with respect thereto. Any recommendation contained in this report may not be suitable for all investors and it is not to be deemed an offer or solicitation on our part with respect to the purchase or sale of any securities. |
|
 |
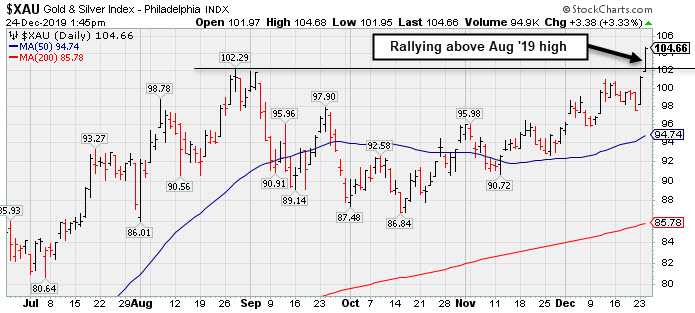
Gold & Silver Index Breaks Out With 2nd Consecutive Standout Gain
Kenneth J. Gruneisen - Passed the CAN SLIM® Master's Exam
The Retail Index ($RLX +0.15%) and Bank Index ($BKX +0.14%) both finished slightly higher while the Broker/Dealer Index ($XBD -0.07%) sputtered and was little changed. The tech sector was led higher by the Biotech Index ($BTK +0.62%) and the Semiconductor Index ($SOX +0.27%), but the Networking Index ($NWX -0.13%) finished slightly in the red. The Oil Services Index ($OSX +0.09%) and Integrated Oil Index ($XOI +0.18%) both inched higher.
PICTURED: The Gold & Silver Index ($XAU +3.34%) was a standout gainer for a 2nd consecutive session as it powered above its August 2019 high.
| Oil Services |
$OSX |
79.60 |
+0.07 |
+0.09% |
-1.24% |
| Integrated Oil |
$XOI |
1,268.12 |
+2.33 |
+0.18% |
+9.41% |
| Semiconductor |
$SOX |
1,862.20 |
+5.08 |
+0.27% |
+61.21% |
| Networking |
$NWX |
585.26 |
-0.74 |
-0.13% |
+19.77% |
| Broker/Dealer |
$XBD |
291.28 |
-0.20 |
-0.07% |
+22.73% |
| Retail |
$RLX |
2,415.87 |
+3.52 |
+0.15% |
+23.80% |
| Gold & Silver |
$XAU |
104.67 |
+3.38 |
+3.34% |
+48.13% |
| Bank |
$BKX |
113.25 |
+0.16 |
+0.14% |
+32.01% |
| Biotech |
$BTK |
5,242.87 |
+32.39 |
+0.62% |
+24.21% |
|
|
|
 |
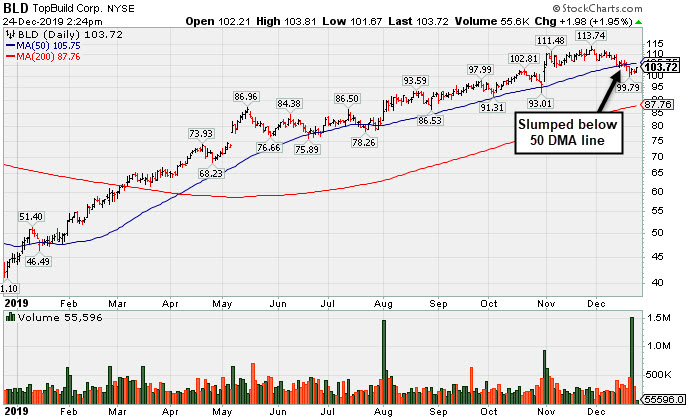
Recent Slump Below 50-Day Moving Average Did Technical Damage
Kenneth J. Gruneisen - Passed the CAN SLIM® Master's Exam
Topbuild Corp (BLD +$2.21 or +2.17% to $103.95) has been sputtering below its 50-day moving average (DMA) line ($105.74) after damaging volume-driven losses triggered a technical sell signal. Only a prompt rebound above its 50 DMA line would help its outlook improve. Recently it reported earnings +24% on +5% sales revenues for the Sep '19 quarter versus the year ago period, just below the +25% minimum guideline (C criteria).
It still has a 98 Earnings Per Share Rating. Its annual earnings (A criteria) history has also been strong and steady since turning profitable in FY '14. BLD was last shown in this FSU section on 12/03/19 with an annotated graph under the headline, "Consolidating After Getting Extended From Any Sound Base". It traded up as much as 38.4% since first highlighted in yellow with new pivot point cited based on its 8/12/18 high plus 10 cents in the 5/17/19 mid-day report (read here).
The number of top-rated funds owning its shares rose from 380 in Dec '18 to 454 in Sep '19. Its current Up/Down Volume Ratio of 1.1 is an unbiased indication its shares have been under slight accumulation over the past 50 days. It has a Timeliness Rating of A and a Sponsorship Rating of D.
|
|
|
Color Codes Explained :
Y - Better candidates highlighted by our
staff of experts.
G - Previously featured
in past reports as yellow but may no longer be buyable under the
guidelines.
***Last / Change / Volume data in this table is the closing quote data***
Symbol/Exchange
Company Name
Industry Group |
PRICE |
CHANGE
(%Change) |
Day High |
Volume
(% DAV)
(% 50 day avg vol) |
52 Wk Hi
% From Hi |
Featured
Date |
Price
Featured |
Pivot Featured |
|
Max Buy |
 MLR
-
NYSE
MLR
-
NYSE
Miller Industries Inc
AUTOMOTIVE - Auto Parts
|
$37.24
|
-0.48
-1.27% |
$37.94
|
8,594
18.29% of 50 DAV
50 DAV is 47,000
|
$38.18
-2.46%
|
9/24/2019
|
$34.00
|
PP = $35.36
|
|
MB = $37.13
|
Most Recent Note - 12/23/2019 12:20:10 PM
G - Hovering near its 52-week high and just above its "max buy" level. Prior highs in the $35 area define initial support along with its 50 DMA line ($35.54). Resilient after reporting Sep '19 earnings which were below the fundamental guidelines of the fact-based investment system.
>>> FEATURED STOCK ARTICLE : Miller Still Quietly Hovering Above Prior Highs - 12/4/2019 |
View all notes |
Set NEW NOTE alert |
Company Profile |
SEC
News |
Chart |
Request a new note
C
A
S
I |
CCBG
-
NASDAQ
Capital City Bk Gp
BANKING - Regional - Mid-Atlantic Banks
|
$30.32
|
+0.13
0.43% |
$30.38
|
10,403
24.19% of 50 DAV
50 DAV is 43,000
|
$30.88
-1.81%
|
12/16/2019
|
$30.07
|
PP = $30.95
|
|
MB = $32.50
|
Most Recent Note - 12/23/2019 12:48:46 PM
Y - Perched within close striking distance of its 52-week high, recently meeting resistance. Subsequent gains and a strong close above the new pivot point cited based on its 11/06/19 high plus 10 cents may trigger a new (or add-on) technical buy signal. Found support at its 50 DMA line ($29) during its orderly consolidation.
>>> FEATURED STOCK ARTICLE : Found Support at 50-Day Moving Average - 12/10/2019 |
View all notes |
Set NEW NOTE alert |
Company Profile |
SEC
News |
Chart |
Request a new note
C
A
S
I |
FTNT
-
NASDAQ
Fortinet Inc
Computer Sftwr-Security
|
$107.78
|
-0.04
-0.04% |
$108.31
|
309,238
21.93% of 50 DAV
50 DAV is 1,410,000
|
$110.28
-2.27%
|
12/9/2019
|
$103.85
|
PP = $106.10
|
|
MB = $111.41
|
Most Recent Note - 12/23/2019 5:34:24 PM
Y - Posted a quiet gain today following a "negative reversal" with heavier volume on the prior session after hitting another new 52-week high. Confirming gains above the pivot point backed by at least +40% above average volume are needed to trigger a convincing technical buy signal. Prior high in the $97 area defines initial support to watch on pullbacks. See the latest FSU analysis for more details and a new annotated graph.
>>> FEATURED STOCK ARTICLE : Endured Distributional Pressure While Perched at High - 12/23/2019 |
View all notes |
Set NEW NOTE alert |
Company Profile |
SEC
News |
Chart |
Request a new note
C
A
S
I |
SPSC
-
NASDAQ
S P S Commerce Inc
COMPUTER SOFTWARE and SERVICES - Application Software
|
$56.96
|
-0.19
-0.33% |
$57.28
|
33,493
16.50% of 50 DAV
50 DAV is 203,000
|
$59.14
-3.69%
|
11/29/2019
|
$56.59
|
PP = $59.24
|
|
MB = $62.20
|
Most Recent Note - 12/20/2019 5:20:26 PM
Y - Paused today after 6 consecutive small gains, perched near its all-time high. Subsequent gains above its pivot point backed by at least +40% above average volume are needed to trigger a new technical buy signal. Fundamentals remain strong. See the latest FSU analysis for more details and a new annotated graph.
>>> FEATURED STOCK ARTICLE : Perched Within Close Striking Distance of 52-Week High - 12/20/2019 |
View all notes |
Set NEW NOTE alert |
Company Profile |
SEC
News |
Chart |
Request a new note
C
A
S
I |
AUDC
-
NASDAQ
Audiocodes Ltd
ELECTRONICS - Scientific and Technical Instrum
|
$25.48
|
+0.10
0.39% |
$25.62
|
85,992
32.09% of 50 DAV
50 DAV is 268,000
|
$26.00
-2.00%
|
9/13/2019
|
$19.68
|
PP = $19.84
|
|
MB = $20.83
|
Most Recent Note - 12/23/2019 12:42:48 PM
G - Perched at its all-time high, stubbornly holding its ground very extended from the previously noted base. Prior highs in the $22 area define support along with its 50 DMA line ($22.21). Fundamentals remain strong.
>>> FEATURED STOCK ARTICLE : Reversed Into Red After Hitting Yet Another New High - 12/13/2019 |
View all notes |
Set NEW NOTE alert |
Company Profile |
SEC
News |
Chart |
Request a new note
C
A
S
I |
Symbol/Exchange
Company Name
Industry Group |
PRICE |
CHANGE
(%Change) |
Day High |
Volume
(% DAV)
(% 50 day avg vol) |
52 Wk Hi
% From Hi |
Featured
Date |
Price
Featured |
Pivot Featured |
|
Max Buy |
CHDN
-
NASDAQ
Churchill Downs Inc
LEISURE - Gaming Activities
|
$133.45
|
-0.62
-0.46% |
$134.33
|
70,212
24.64% of 50 DAV
50 DAV is 285,000
|
$137.42
-2.89%
|
10/8/2019
|
$129.77
|
PP = $132.83
|
|
MB = $139.47
|
Most Recent Note - 12/20/2019 5:22:19 PM
G - Churned above average volume and ended lower today while challenging its 52-week high. Its 50 DMA line ($130) defines near-term support above the prior low ($121.81 on 11/07/19) The Jun and Sep '19 quarterly earnings versus the year ago periods were both below the +25% minimum guideline (C criteria) and raised fundamental concerns.
>>> FEATURED STOCK ARTICLE : Met Resistance After Rebounding Near Prior High - 12/9/2019 |
View all notes |
Set NEW NOTE alert |
Company Profile |
SEC
News |
Chart |
Request a new note
C
A
S
I |
LULU
-
NASDAQ
Lululemon Athletica
MANUFACTURING - Textile Manufacturing
|
$229.03
|
+0.90
0.39% |
$229.41
|
609,085
29.38% of 50 DAV
50 DAV is 2,073,000
|
$235.50
-2.75%
|
9/6/2019
|
$201.25
|
PP = $194.35
|
|
MB = $204.07
|
Most Recent Note - 12/23/2019 1:08:54 PM
G - Extended from any sound base, and its 50 DMA line ($215) defines near-term support above the prior high ($209). Recently reported earnings +28% on +23% sales revenues for the Oct '19 quarter.
>>> FEATURED STOCK ARTICLE : Retreated From High After Another Strong Earnings Report - 12/17/2019 |
View all notes |
Set NEW NOTE alert |
Company Profile |
SEC
News |
Chart |
Request a new note
C
A
S
I |
CPRT
-
NASDAQ
Copart Inc
SPECIALTY RETAIL - Auto Dealerships
|
$90.91
|
+1.04
1.16% |
$91.10
|
544,345
29.11% of 50 DAV
50 DAV is 1,870,000
|
$92.41
-1.62%
|
9/5/2019
|
$79.13
|
PP = $79.84
|
|
MB = $83.83
|
Most Recent Note - 12/19/2019 5:18:33 PM
G - Consolidating in a tight range well above its 50 DMA line ($85.45) which defines near-term support. Fundamentals remain strong.
>>> FEATURED STOCK ARTICLE : Extended From Prior Base and Hovering Near Record High - 12/12/2019 |
View all notes |
Set NEW NOTE alert |
Company Profile |
SEC
News |
Chart |
Request a new note
C
A
S
I |
NMIH
-
NASDAQ
N M I Holdings Inc Cl A
Finance-MrtgandRel Svc
|
$34.07
|
-0.09
-0.26% |
$34.51
|
199,979
39.76% of 50 DAV
50 DAV is 503,000
|
$35.79
-4.81%
|
11/8/2019
|
$32.89
|
PP = $31.44
|
|
MB = $33.01
|
Most Recent Note - 12/19/2019 5:16:57 PM
G - Finished at the session low after hitting a new all-time high with heavier volume behind today's 5th consecutive gain. Prior highs in the $30-31 area and its 50 DMA line ($31.55) define important near-term support. See the latest FSU analysis for more details and a new annotated graph.
>>> FEATURED STOCK ARTICLE : Hit New High But Encountered Distributional Pressure - 12/19/2019 |
View all notes |
Set NEW NOTE alert |
Company Profile |
SEC
News |
Chart |
Request a new note
C
A
S
I |
SPLK
-
NASDAQ
Splunk Inc
Computer Sftwr-Database
|
$150.35
|
+0.30
0.20% |
$150.77
|
443,763
21.22% of 50 DAV
50 DAV is 2,091,000
|
$152.68
-1.53%
|
11/25/2019
|
$147.79
|
PP = $142.16
|
|
MB = $149.27
|
Most Recent Note - 12/23/2019 12:46:29 PM
G - Color code is changed to green while consolidating above its "max buy" level following a volume-driven gain. Prior highs in the $142-143 area define initial support to watch on pullbacks.
>>> FEATURED STOCK ARTICLE : Consolidating Above Prior Highs Following Impressive Rally - 12/16/2019 |
View all notes |
Set NEW NOTE alert |
Company Profile |
SEC
News |
Chart |
Request a new note
C
A
S
I |
Symbol/Exchange
Company Name
Industry Group |
PRICE |
CHANGE
(%Change) |
Day High |
Volume
(% DAV)
(% 50 day avg vol) |
52 Wk Hi
% From Hi |
Featured
Date |
Price
Featured |
Pivot Featured |
|
Max Buy |
PAYC
-
NYSE
Paycom Software Inc
COMPUTER SOFTWARE and SERVICES - Application Software
|
$264.64
|
-0.38
-0.14% |
$266.67
|
111,847
19.97% of 50 DAV
50 DAV is 560,000
|
$279.95
-5.47%
|
11/20/2019
|
$252.97
|
PP = $259.81
|
|
MB = $272.80
|
Most Recent Note - 12/23/2019 12:50:20 PM
Y - Volume totals have been cooling while quietly consolidating above its pivot point and below its "max buy" level. Fundamentals remain strong.
>>> FEATURED STOCK ARTICLE : Consolidating Near Prior Highs Which Define Initial Support - 12/11/2019 |
View all notes |
Set NEW NOTE alert |
Company Profile |
SEC
News |
Chart |
Request a new note
C
A
S
I |
BLD
-
NYSE
Topbuild Corp
Bldg-Constr Prds/Misc
|
$103.95
|
+2.21
2.17% |
$104.01
|
76,200
25.15% of 50 DAV
50 DAV is 303,000
|
$113.74
-8.61%
|
12/9/2019
|
$109.71
|
PP = $113.84
|
|
MB = $119.53
|
 Most Recent Note - 12/24/2019 2:36:25 PM
G - After damaging losses a rebound above its 50 DMA line ($105.74) is needed for its outlook to improve. See the latest FSU analysis for more details and a new annotated graph.
>>> FEATURED STOCK ARTICLE : Recent Slump Below 50-Day Moving Average Did Technical Damage - 12/24/2019 |
View all notes |
Set NEW NOTE alert |
Company Profile |
SEC
News |
Chart |
Request a new note
C
A
S
I |
GLOB
-
NYSE
Globant SA
Computer-Tech Services
|
$108.15
|
-0.38
-0.35% |
$108.47
|
50,946
18.00% of 50 DAV
50 DAV is 283,000
|
$112.33
-3.72%
|
11/14/2019
|
$106.87
|
PP = $112.43
|
|
MB = $118.05
|
Most Recent Note - 12/23/2019 1:06:47 PM
G - Perched within striking distance of its prior high and its 52-week high Subsequent volume-driven gains for new highs are still needed to trigger a technical buy signal. Found support near its 50 DMA line ($99.63) during the recent consolidation. Fundamentals remain strong.
>>> FEATURED STOCK ARTICLE : Found Support at 50-Day Average During Choppy Consolidation - 12/5/2019 |
View all notes |
Set NEW NOTE alert |
Company Profile |
SEC
News |
Chart |
Request a new note
C
A
S
I |
|
|
|
THESE ARE NOT BUY RECOMMENDATIONS!
Comments contained in the body of this report are technical
opinions only. The material herein has been obtained
from sources believed to be reliable and accurate, however,
its accuracy and completeness cannot be guaranteed.
This site is not an investment advisor, hence it does
not endorse or recommend any securities or other investments.
Any recommendation contained in this report may not
be suitable for all investors and it is not to be deemed
an offer or solicitation on our part with respect to
the purchase or sale of any securities. All trademarks,
service marks and trade names appearing in this report
are the property of their respective owners, and are
likewise used for identification purposes only.
This report is a service available
only to active Paid Premium Members.
You may opt-out of receiving report notifications
at any time. Questions or comments may be submitted
by writing to Premium Membership Services 665 S.E. 10 Street, Suite 201 Deerfield Beach, FL 33441-5634 or by calling 1-800-965-8307
or 954-785-1121.
|
|
|