You are not logged in.
This means you
CAN ONLY VIEW reports that were published prior to Saturday, February 24, 2024.
You
MUST UPGRADE YOUR MEMBERSHIP if you want to see any current reports.
AFTER MARKET UPDATE - MONDAY, DECEMBER 23RD, 2019
Previous After Market Report Next After Market Report >>>
|
|
|
|
DOW |
+96.44 |
28,551.53 |
+0.34% |
|
Volume |
784,305,490 |
-72% |
|
Volume |
1,976,533,268 |
-48% |
|
NASDAQ |
+20.69 |
8,945.65 |
+0.23% |
|
Advancers |
1,583 |
55% |
|
Advancers |
1,628 |
52% |
|
S&P 500 |
+2.79 |
3,224.01 |
+0.09% |
|
Decliners |
1,295 |
45% |
|
Decliners |
1,499 |
48% |
|
Russell 2000 |
+2.24 |
1,674.14 |
+0.13% |
|
52 Wk Highs |
199 |
|
|
52 Wk Highs |
239 |
|
|
S&P 600 |
-0.21 |
1,022.67 |
-0.02% |
|
52 Wk Lows |
12 |
|
|
52 Wk Lows |
45 |
|
|
 |
Major Indices Extend Rally For More Record Highs
Kenneth J. Gruneisen - Passed the CAN SLIM® Master's Exam
The Dow gained 96 points, while the S&P 500 climbed 0.1% with the benchmark’s trading volume 20% below its 100-day average. The Nasdaq Composite added 0.2%, extending its daily winning streak to eight sessions. Advancers led decliners by a narrow margin on the NYSE and on the Nasdaq exchange. The volume totals were much lighter than the prior session on the NYSE and on the Nasdaq exchange, after Friday's totals were inflated by options expirations. There were 71 high-ranked companies from the Leaders List that hit a new 52-week high and were listed on the BreakOuts Page, versus the total of 112 on the prior session. New 52-week highs totals contracted yet still easily outnumbered new 52-week lows totals on the NYSE and on the Nasdaq exchange. The major indices (M criteria) are in a "confirmed uptrend" after enduring distributional pressure in recent weeks. The Featured Stocks Page provides the most timely analysis on high-ranked leaders. Charts used courtesy of www.stockcharts.com
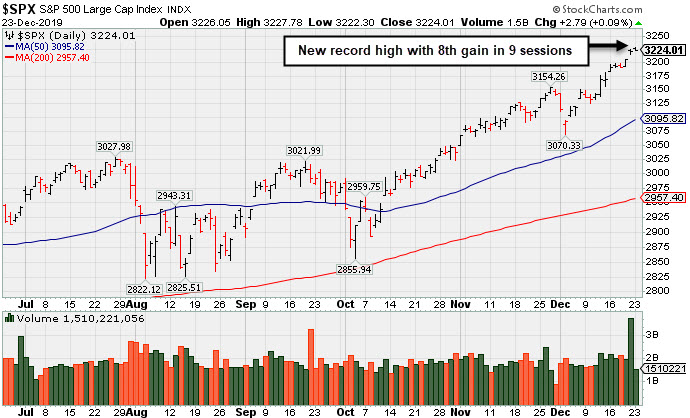
PICTURED: The S&P 500 Index hit a new record high with an 8th gain in the span of 9 sessions. It recently found support above prior highs and above its 50-day moving average (DMA) line.
The major averages climbed to new record highs in light trading as easing trade tensions continued to provide a tailwind to equity markets. China announced that it would cut tariffs on more than 850 products, bolstering confidence Washington and Beijing are progressing towards finalizing a “phase one” trade deal in the near term. Chinese officials also revealed that it would take steps to further liberalize market access for firms in industries such as telecommunications and energy.
On the data front, a report showed that new home sales rose 1.3% in November, topping expectations of a slight decrease. Another release showed that durable goods orders fell 2% in November, missing expectations of a 1.5% increase. Treasuries modestly declined, with the yield on the 10-year note adding one basis point to 1.93%.
The Energy group paced the gains as WTI crude hovered near a three-month high. The Industrials sector also outperformed, with shares of Boeing (BA +2.91%) rising following news that CEO Dennis Muilenberg will resign amid the continued fallout from the 737 MAX crashes. In other corporate news, Disney (DIS -1.50%) fell after its latest Star Wars film missed lofty box office expectations with domestic sales of $175 million in its opening weekend. In commodities, COMEX gold added 0.5% to $1,482.50/ounce, and remains on pace for its largest one-year rally (16%) since 2010.
|
 Kenneth J. Gruneisen started out as a licensed stockbroker in August 1987, a couple of months prior to the historic stock market crash that took the Dow Jones Industrial Average down -22.6% in a single day. He has published daily fact-based fundamental and technical analysis on high-ranked stocks online for two decades. Through FACTBASEDINVESTING.COM, Kenneth provides educational articles, news, market commentary, and other information regarding proven investment systems that work in good times and bad.
Comments contained in the body of this report are technical opinions only and are not necessarily those of Gruneisen Growth Corp. The material herein has been obtained from sources believed to be reliable and accurate, however, its accuracy and completeness cannot be guaranteed. Our firm, employees, and customers may effect transactions, including transactions contrary to any recommendation herein, or have positions in the securities mentioned herein or options with respect thereto. Any recommendation contained in this report may not be suitable for all investors and it is not to be deemed an offer or solicitation on our part with respect to the purchase or sale of any securities. |
|
 |
Commodity Linked Groups and Tech Sector Rose
Kenneth J. Gruneisen - Passed the CAN SLIM® Master's Exam
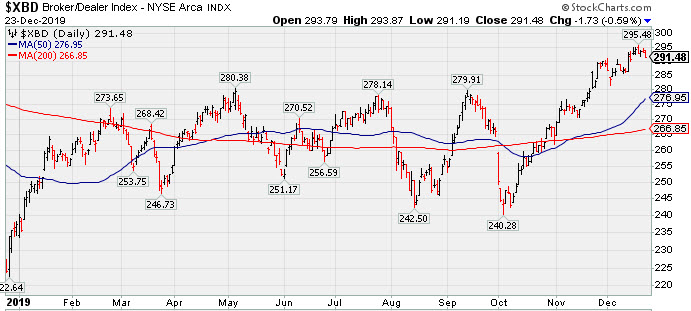
The Retail Index ($RLX -0.11%) and Bank Index ($BKX -0.06%) both finished slightly in the red while the Broker/Dealer Index ($XBD -0.59%) suffered a larger loss. The tech sector was led higher by the Biotech Index ($BTK +0.77%) and the Networking Index ($NWX +0.78%), meanwhile the Semiconductor Index ($SOX +0.18%) posted a smaller gain. The Gold & Silver Index ($XAU +3.85%) and Oil Services Index ($OSX +3.77%) both were standout gainers while the Integrated Oil Index ($XOI +0.80%) also posted a modest gain.
PICTURED: The 1-year graph of the Broker/Dealer Index ($XBD -0.59%) shows it perched near its 2019 high after a choppy year.
| Oil Services |
$OSX |
79.53 |
+2.89 |
+3.77% |
-1.33% |
| Integrated Oil |
$XOI |
1,265.79 |
+10.04 |
+0.80% |
+9.20% |
| Semiconductor |
$SOX |
1,857.12 |
+3.25 |
+0.18% |
+60.77% |
| Networking |
$NWX |
586.00 |
+4.56 |
+0.78% |
+19.92% |
| Broker/Dealer |
$XBD |
291.48 |
-1.73 |
-0.59% |
+22.81% |
| Retail |
$RLX |
2,412.35 |
-2.70 |
-0.11% |
+23.62% |
| Gold & Silver |
$XAU |
101.29 |
+3.73 |
+3.82% |
+43.35% |
| Bank |
$BKX |
113.09 |
-0.07 |
-0.06% |
+31.82% |
| Biotech |
$BTK |
5,210.48 |
+40.04 |
+0.77% |
+23.45% |
|
|
|
 |
Endured Distributional Pressure While Perched at High
Kenneth J. Gruneisen - Passed the CAN SLIM® Master's Exam
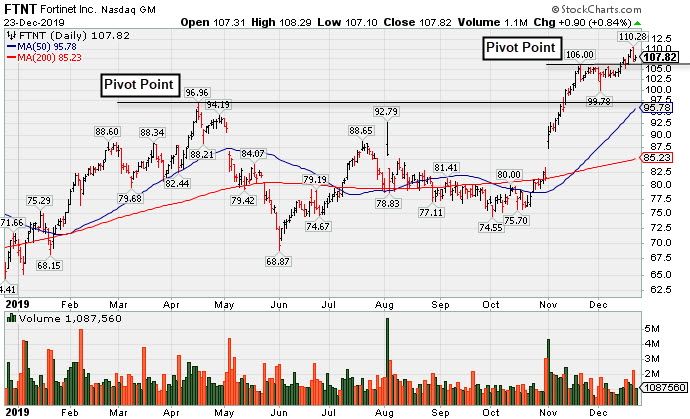
Fortinet Inc (FTNT +$0.90 or +0.84% to $107.82) posted a small gain on light volume. There was a "negative reversal" for a loss with heavier volume after hitting another new 52-week high on the prior session. It had wedged higher with gains lacking great volume conviction after highlighted in yellow with pivot point cited based on its 11/20/19 high plus 10 cents. The prior high in the $97 area defines initial support to watch on pullbacks.
Bullish action came after it reported earnings +37% on +21% sales revenues for the Sep '19 quarter versus the year ago period, its 7th consecutive quarterly comparison with earnings above the +25% minimum guideline (C criteria). Annual earnings (A criteria) have been improving since FY '14, also helping it match with the fact-based investment system's guidelines.
FTNT was highlighted in yellow with new pivot point cited based on its 4/16/19 high plus 10 cents in the 11/11/19 mid-day report (read here), It was last shown in this FSU section on 12/02/19 with an annotated graph under the headline, "Extended From Prior Base Perched Near Record High".
The number of top-rated funds owning its shares rose from 960 in Jun '18 to 1,533 in Sep '19, a reassuring sign concerning the I criteria. Its current Up/Down Volume ratio of 1.5 is an unbiased indication its shares have been under accumulation over the past 50 days. It has a Timeliness rating of A and Sponsorship rating of B.
Charts courtesy of www.stockcharts.com
 |
|
|
Color Codes Explained :
Y - Better candidates highlighted by our
staff of experts.
G - Previously featured
in past reports as yellow but may no longer be buyable under the
guidelines.
***Last / Change / Volume data in this table is the closing quote data***
Symbol/Exchange
Company Name
Industry Group |
PRICE |
CHANGE
(%Change) |
Day High |
Volume
(% DAV)
(% 50 day avg vol) |
52 Wk Hi
% From Hi |
Featured
Date |
Price
Featured |
Pivot Featured |
|
Max Buy |
 MLR
-
NYSE
MLR
-
NYSE
Miller Industries Inc
AUTOMOTIVE - Auto Parts
|
$37.72
|
+0.71
1.92% |
$37.98
|
60,298
128.29% of 50 DAV
50 DAV is 47,000
|
$38.18
-1.20%
|
9/24/2019
|
$34.00
|
PP = $35.36
|
|
MB = $37.13
|
 Most Recent Note - 12/23/2019 12:20:10 PM
G - Hovering near its 52-week high and just above its "max buy" level. Prior highs in the $35 area define initial support along with its 50 DMA line ($35.54). Resilient after reporting Sep '19 earnings which were below the fundamental guidelines of the fact-based investment system.
>>> FEATURED STOCK ARTICLE : Miller Still Quietly Hovering Above Prior Highs - 12/4/2019 |
View all notes |
Set NEW NOTE alert |
Company Profile |
SEC
News |
Chart |
Request a new note
C
A
S
I |
CCBG
-
NASDAQ
Capital City Bk Gp
BANKING - Regional - Mid-Atlantic Banks
|
$30.19
|
-0.16
-0.53% |
$30.57
|
36,692
85.33% of 50 DAV
50 DAV is 43,000
|
$30.88
-2.23%
|
12/16/2019
|
$30.07
|
PP = $30.95
|
|
MB = $32.50
|
Most Recent Note - 12/23/2019 12:48:46 PM
Y - Perched within close striking distance of its 52-week high, recently meeting resistance. Subsequent gains and a strong close above the new pivot point cited based on its 11/06/19 high plus 10 cents may trigger a new (or add-on) technical buy signal. Found support at its 50 DMA line ($29) during its orderly consolidation.
>>> FEATURED STOCK ARTICLE : Found Support at 50-Day Moving Average - 12/10/2019 |
View all notes |
Set NEW NOTE alert |
Company Profile |
SEC
News |
Chart |
Request a new note
C
A
S
I |
FTNT
-
NASDAQ
Fortinet Inc
Computer Sftwr-Security
|
$107.82
|
+0.90
0.84% |
$108.29
|
1,087,518
77.07% of 50 DAV
50 DAV is 1,411,000
|
$110.28
-2.23%
|
12/9/2019
|
$103.85
|
PP = $106.10
|
|
MB = $111.41
|
Most Recent Note - 12/23/2019 5:34:24 PM
Y - Posted a quiet gain today following a "negative reversal" with heavier volume on the prior session after hitting another new 52-week high. Confirming gains above the pivot point backed by at least +40% above average volume are needed to trigger a convincing technical buy signal. Prior high in the $97 area defines initial support to watch on pullbacks. See the latest FSU analysis for more details and a new annotated graph.
>>> FEATURED STOCK ARTICLE : Endured Distributional Pressure While Perched at High - 12/23/2019 |
View all notes |
Set NEW NOTE alert |
Company Profile |
SEC
News |
Chart |
Request a new note
C
A
S
I |
SPSC
-
NASDAQ
S P S Commerce Inc
COMPUTER SOFTWARE and SERVICES - Application Software
|
$57.15
|
-0.02
-0.03% |
$57.41
|
79,144
38.42% of 50 DAV
50 DAV is 206,000
|
$59.14
-3.36%
|
11/29/2019
|
$56.59
|
PP = $59.24
|
|
MB = $62.20
|
Most Recent Note - 12/20/2019 5:20:26 PM
Y - Paused today after 6 consecutive small gains, perched near its all-time high. Subsequent gains above its pivot point backed by at least +40% above average volume are needed to trigger a new technical buy signal. Fundamentals remain strong. See the latest FSU analysis for more details and a new annotated graph.
>>> FEATURED STOCK ARTICLE : Perched Within Close Striking Distance of 52-Week High - 12/20/2019 |
View all notes |
Set NEW NOTE alert |
Company Profile |
SEC
News |
Chart |
Request a new note
C
A
S
I |
AUDC
-
NASDAQ
Audiocodes Ltd
ELECTRONICS - Scientific and Technical Instrum
|
$25.38
|
+0.10
0.40% |
$25.59
|
230,218
86.55% of 50 DAV
50 DAV is 266,000
|
$26.00
-2.38%
|
9/13/2019
|
$19.68
|
PP = $19.84
|
|
MB = $20.83
|
Most Recent Note - 12/23/2019 12:42:48 PM
G - Perched at its all-time high, stubbornly holding its ground very extended from the previously noted base. Prior highs in the $22 area define support along with its 50 DMA line ($22.21). Fundamentals remain strong.
>>> FEATURED STOCK ARTICLE : Reversed Into Red After Hitting Yet Another New High - 12/13/2019 |
View all notes |
Set NEW NOTE alert |
Company Profile |
SEC
News |
Chart |
Request a new note
C
A
S
I |
Symbol/Exchange
Company Name
Industry Group |
PRICE |
CHANGE
(%Change) |
Day High |
Volume
(% DAV)
(% 50 day avg vol) |
52 Wk Hi
% From Hi |
Featured
Date |
Price
Featured |
Pivot Featured |
|
Max Buy |
CHDN
-
NASDAQ
Churchill Downs Inc
LEISURE - Gaming Activities
|
$134.07
|
-0.11
-0.08% |
$135.56
|
185,105
64.50% of 50 DAV
50 DAV is 287,000
|
$137.42
-2.44%
|
10/8/2019
|
$129.77
|
PP = $132.83
|
|
MB = $139.47
|
Most Recent Note - 12/20/2019 5:22:19 PM
G - Churned above average volume and ended lower today while challenging its 52-week high. Its 50 DMA line ($130) defines near-term support above the prior low ($121.81 on 11/07/19) The Jun and Sep '19 quarterly earnings versus the year ago periods were both below the +25% minimum guideline (C criteria) and raised fundamental concerns.
>>> FEATURED STOCK ARTICLE : Met Resistance After Rebounding Near Prior High - 12/9/2019 |
View all notes |
Set NEW NOTE alert |
Company Profile |
SEC
News |
Chart |
Request a new note
C
A
S
I |
LULU
-
NASDAQ
Lululemon Athletica
MANUFACTURING - Textile Manufacturing
|
$228.13
|
-2.16
-0.94% |
$231.14
|
1,432,946
68.56% of 50 DAV
50 DAV is 2,090,000
|
$235.50
-3.13%
|
9/6/2019
|
$201.25
|
PP = $194.35
|
|
MB = $204.07
|
Most Recent Note - 12/23/2019 1:08:54 PM
G - Extended from any sound base, and its 50 DMA line ($215) defines near-term support above the prior high ($209). Recently reported earnings +28% on +23% sales revenues for the Oct '19 quarter.
>>> FEATURED STOCK ARTICLE : Retreated From High After Another Strong Earnings Report - 12/17/2019 |
View all notes |
Set NEW NOTE alert |
Company Profile |
SEC
News |
Chart |
Request a new note
C
A
S
I |
CPRT
-
NASDAQ
Copart Inc
SPECIALTY RETAIL - Auto Dealerships
|
$89.87
|
-0.85
-0.94% |
$91.19
|
1,199,436
64.56% of 50 DAV
50 DAV is 1,858,000
|
$92.41
-2.75%
|
9/5/2019
|
$79.13
|
PP = $79.84
|
|
MB = $83.83
|
Most Recent Note - 12/19/2019 5:18:33 PM
G - Consolidating in a tight range well above its 50 DMA line ($85.45) which defines near-term support. Fundamentals remain strong.
>>> FEATURED STOCK ARTICLE : Extended From Prior Base and Hovering Near Record High - 12/12/2019 |
View all notes |
Set NEW NOTE alert |
Company Profile |
SEC
News |
Chart |
Request a new note
C
A
S
I |
NMIH
-
NASDAQ
N M I Holdings Inc Cl A
Finance-MrtgandRel Svc
|
$34.16
|
-0.27
-0.78% |
$34.56
|
494,105
98.62% of 50 DAV
50 DAV is 501,000
|
$35.79
-4.55%
|
11/8/2019
|
$32.89
|
PP = $31.44
|
|
MB = $33.01
|
Most Recent Note - 12/19/2019 5:16:57 PM
G - Finished at the session low after hitting a new all-time high with heavier volume behind today's 5th consecutive gain. Prior highs in the $30-31 area and its 50 DMA line ($31.55) define important near-term support. See the latest FSU analysis for more details and a new annotated graph.
>>> FEATURED STOCK ARTICLE : Hit New High But Encountered Distributional Pressure - 12/19/2019 |
View all notes |
Set NEW NOTE alert |
Company Profile |
SEC
News |
Chart |
Request a new note
C
A
S
I |
SPLK
-
NASDAQ
Splunk Inc
Computer Sftwr-Database
|
$150.05
|
-0.91
-0.60% |
$151.50
|
1,093,829
52.06% of 50 DAV
50 DAV is 2,101,000
|
$152.68
-1.72%
|
11/25/2019
|
$147.79
|
PP = $142.16
|
|
MB = $149.27
|
Most Recent Note - 12/23/2019 12:46:29 PM
G - Color code is changed to green while consolidating above its "max buy" level following a volume-driven gain. Prior highs in the $142-143 area define initial support to watch on pullbacks.
>>> FEATURED STOCK ARTICLE : Consolidating Above Prior Highs Following Impressive Rally - 12/16/2019 |
View all notes |
Set NEW NOTE alert |
Company Profile |
SEC
News |
Chart |
Request a new note
C
A
S
I |
Symbol/Exchange
Company Name
Industry Group |
PRICE |
CHANGE
(%Change) |
Day High |
Volume
(% DAV)
(% 50 day avg vol) |
52 Wk Hi
% From Hi |
Featured
Date |
Price
Featured |
Pivot Featured |
|
Max Buy |
PAYC
-
NYSE
Paycom Software Inc
COMPUTER SOFTWARE and SERVICES - Application Software
|
$265.02
|
+1.48
0.56% |
$268.55
|
403,608
71.94% of 50 DAV
50 DAV is 561,000
|
$279.95
-5.33%
|
11/20/2019
|
$252.97
|
PP = $259.81
|
|
MB = $272.80
|
Most Recent Note - 12/23/2019 12:50:20 PM
Y - Volume totals have been cooling while quietly consolidating above its pivot point and below its "max buy" level. Fundamentals remain strong.
>>> FEATURED STOCK ARTICLE : Consolidating Near Prior Highs Which Define Initial Support - 12/11/2019 |
View all notes |
Set NEW NOTE alert |
Company Profile |
SEC
News |
Chart |
Request a new note
C
A
S
I |
BLD
-
NYSE
Topbuild Corp
Bldg-Constr Prds/Misc
|
$101.74
|
-1.32
-1.28% |
$102.82
|
256,168
84.82% of 50 DAV
50 DAV is 302,000
|
$113.74
-10.55%
|
12/9/2019
|
$109.71
|
PP = $113.84
|
|
MB = $119.53
|
Most Recent Note - 12/19/2019 5:21:27 PM
G - Color code is changed to green after slumping further below its 50 DMA line ($105.44) with today's damaging volume-driven loss triggering a technical sell signal. Reported earnings +24% on +5% sales revenues for the Sep '19 quarter versus the year ago period, just below the +25% minimum guideline (C criteria).
>>> FEATURED STOCK ARTICLE : Consolidating After Getting Extended From Any Sound Base - 12/3/2019 |
View all notes |
Set NEW NOTE alert |
Company Profile |
SEC
News |
Chart |
Request a new note
C
A
S
I |
GLOB
-
NYSE
Globant SA
Computer-Tech Services
|
$108.53
|
+2.53
2.39% |
$108.70
|
161,741
57.15% of 50 DAV
50 DAV is 283,000
|
$112.33
-3.38%
|
11/14/2019
|
$106.87
|
PP = $112.43
|
|
MB = $118.05
|
Most Recent Note - 12/23/2019 1:06:47 PM
G - Perched within striking distance of its prior high and its 52-week high Subsequent volume-driven gains for new highs are still needed to trigger a technical buy signal. Found support near its 50 DMA line ($99.63) during the recent consolidation. Fundamentals remain strong.
>>> FEATURED STOCK ARTICLE : Found Support at 50-Day Average During Choppy Consolidation - 12/5/2019 |
View all notes |
Set NEW NOTE alert |
Company Profile |
SEC
News |
Chart |
Request a new note
C
A
S
I |
|
|
|
THESE ARE NOT BUY RECOMMENDATIONS!
Comments contained in the body of this report are technical
opinions only. The material herein has been obtained
from sources believed to be reliable and accurate, however,
its accuracy and completeness cannot be guaranteed.
This site is not an investment advisor, hence it does
not endorse or recommend any securities or other investments.
Any recommendation contained in this report may not
be suitable for all investors and it is not to be deemed
an offer or solicitation on our part with respect to
the purchase or sale of any securities. All trademarks,
service marks and trade names appearing in this report
are the property of their respective owners, and are
likewise used for identification purposes only.
This report is a service available
only to active Paid Premium Members.
You may opt-out of receiving report notifications
at any time. Questions or comments may be submitted
by writing to Premium Membership Services 665 S.E. 10 Street, Suite 201 Deerfield Beach, FL 33441-5634 or by calling 1-800-965-8307
or 954-785-1121.
|
|
|