You are not logged in.
This means you
CAN ONLY VIEW reports that were published prior to Monday, February 19, 2024.
You
MUST UPGRADE YOUR MEMBERSHIP if you want to see any current reports.
AFTER MARKET UPDATE - FRIDAY, DECEMBER 21ST, 2018
Previous After Market Report Next After Market Report >>>
|
|
|
|
DOW |
-414.23 |
22,445.37 |
-1.81% |
|
Volume |
3,259,532,000 |
+134% |
|
Volume |
4,557,014,500 |
+40% |
|
NASDAQ |
-195.42 |
6,332.99 |
-2.99% |
|
Advancers |
676 |
22% |
|
Advancers |
659 |
21% |
|
S&P 500 |
-50.84 |
2,416.58 |
-2.06% |
|
Decliners |
2,349 |
78% |
|
Decliners |
2,486 |
79% |
|
Russell 2000 |
-33.92 |
1,292.09 |
-2.56% |
|
52 Wk Highs |
2 |
|
|
52 Wk Highs |
8 |
|
|
S&P 600 |
-18.49 |
809.61 |
-2.23% |
|
52 Wk Lows |
1,059 |
|
|
52 Wk Lows |
1,103 |
|
|
 |
Major Indices Dive Again as Bear Market Grows Uglier
Kenneth J. Gruneisen - Passed the CAN SLIM® Master's Exam
Stocks finished firmly lower Friday. The Dow lost 414 points to 22,445 while the S&P 500 fell 50 points to 2,416. The Nasdaq Composite declined 195 points to 6,333. The volume totals on the session were higher than the prior session totals on the NYSE and on the Nasdaq exchange, inflated by options expirations, yet also indicative of intense distributional pressure. Decliners led advancers by more than a 3-1 margin on the NYSE and nearly 4-1 margin on the Nasdaq exchange. Leadership has evaporated completely as, two days in a row, zero high-ranked companies from the Leaders List made a new 52-week high and were listed on the BreakOuts Page. New 52-week lows totals solidly outnumbered new 52-week highs totals which were in the single digits on both the NYSE and on the Nasdaq exchange. As noted in prior commentaries, the major indices (M criteria) are in a correction. Disciplined investors reduce exposure to protect capital in bad markets and wait for a new rally and solid follow-through day to eventually shift the market direction (M criteria) back to a bullish stance. The Featured Stocks Page provides the most timely analysis on high-ranked leaders. Charts used courtesy of www.stockcharts.com
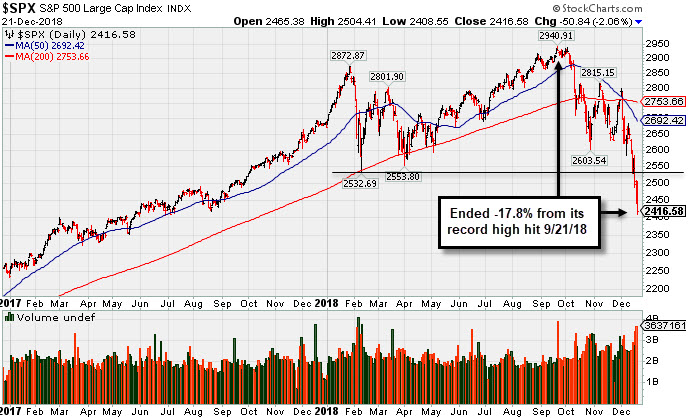
PICTURED: The S&P 500 Index has slumped -17.8% off its record high hit 9/21/18, quickly approaching the "Bear Market" threshold, sinking to levels not seen since July 2017.
The major averages extended their recent rout as the Nasdaq dipped into bear market territory. This marked the first time since 2009 that a major U.S. average closed below 20% from its recent high. The declines left the tech-heavy index down 8.4% for the week. The S&P 500 lost 7.1%, while the Dow notched its worst week in a decade, sinking 6.9%. On the data front, U.S. third quarter GDP grew at a 3.4% annualized rate, below forecasts of 3.5%. Core PCE deflator, which is the Fed’s preferred gauge of inflation, increased 1.8% year-over-year in November, below the central bank's 2.0% target.
All 11 S&P 500 sectors ended in negative territory. The Communications Services and Technology sectors lagged with the oft-cited FAANG group losing nearly 5%. Perrigo (PRGO -29.28%) was a notable decliner following news the drugmaker faces a $1.6 billion tax bill from the Irish government. Nike (NKE +7.17%) proved to be a bright spot, surging after reporting earnings that topped analyst estimates on both the top and bottom line.
Treasuries strengthened with the yield on the 10-year off two basis point at 2.78%. In commodities, WTI crude finished the week down 11% to $45.59/barrel, its worst weekly performance since2016. COMEX gold was off 0.8% to $1,253.80/ounce amid a stronger dollar. |
 Kenneth J. Gruneisen started out as a licensed stockbroker in August 1987, a couple of months prior to the historic stock market crash that took the Dow Jones Industrial Average down -22.6% in a single day. He has published daily fact-based fundamental and technical analysis on high-ranked stocks online for two decades. Through FACTBASEDINVESTING.COM, Kenneth provides educational articles, news, market commentary, and other information regarding proven investment systems that work in good times and bad.
Comments contained in the body of this report are technical opinions only and are not necessarily those of Gruneisen Growth Corp. The material herein has been obtained from sources believed to be reliable and accurate, however, its accuracy and completeness cannot be guaranteed. Our firm, employees, and customers may effect transactions, including transactions contrary to any recommendation herein, or have positions in the securities mentioned herein or options with respect thereto. Any recommendation contained in this report may not be suitable for all investors and it is not to be deemed an offer or solicitation on our part with respect to the purchase or sale of any securities. |
|
 |
Retail, Financial, Tech, and Commodity-Linked Groups Fell
Kenneth J. Gruneisen - Passed the CAN SLIM® Master's Exam
The Retail Index ($RLX -3.64%), Broker/Dealer Index ($XBD -1.90%), and the Bank Index ($BKX -1.86%) created a drag on the major indices. The tech sector had a negative bias as the Semiconductor Index ($SOX -1.476%), Biotech Index ($BTK -3.81%) and Networking Index ($NWX -2.71%) ended unanimously lower. Commodity-linked groups also had a negative bias as the Oil Services Index ($OSX -1.54%), Integrated Oil Index ($XOI -1.09%), and the Gold & Silver Index ($XAU -1.60%) each lost ground.
Charts courtesy of www.stockcharts.com
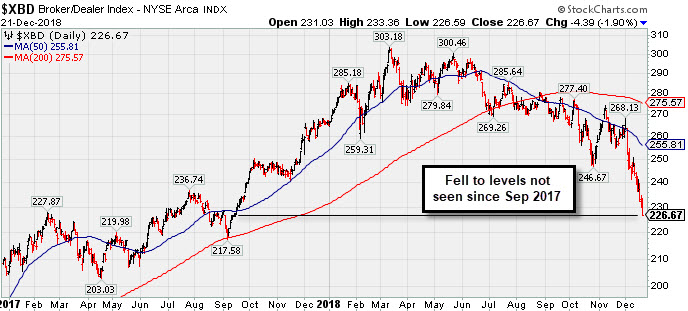 PICTURED: The 2-year graph of the Broker/Dealer Index ($XBD -1.90%) illustrates the severity of the recent slump to levels not seen since September 2017.
| Oil Services |
$OSX |
77.52 |
-1.22 |
-1.55% |
-48.16% |
| Integrated Oil |
$XOI |
1,132.02 |
-12.43 |
-1.09% |
-15.24% |
| Semiconductor |
$SOX |
1,101.29 |
-16.45 |
-1.47% |
-12.11% |
| Networking |
$NWX |
462.80 |
-12.88 |
-2.71% |
-5.65% |
| Broker/Dealer |
$XBD |
226.67 |
-4.39 |
-1.90% |
-14.54% |
| Retail |
$RLX |
1,815.80 |
-68.66 |
-3.64% |
+4.73% |
| Gold & Silver |
$XAU |
68.67 |
-1.12 |
-1.60% |
-19.47% |
| Bank |
$BKX |
82.52 |
-1.57 |
-1.87% |
-22.67% |
| Biotech |
$BTK |
3,940.96 |
-156.25 |
-3.81% |
-6.66% |
|
|
|
 |
|
|
|
Color Codes Explained :
Y - Better candidates highlighted by our
staff of experts.
G - Previously featured
in past reports as yellow but may no longer be buyable under the
guidelines.
***Last / Change / Volume data in this table is the closing quote data***
Symbol/Exchange
Company Name
Industry Group |
PRICE |
CHANGE
(%Change) |
Day High |
Volume
(% DAV)
(% 50 day avg vol) |
52 Wk Hi
% From Hi |
Featured
Date |
Price
Featured |
Pivot Featured |
|
Max Buy |
MLR
-
NYSE
Miller Industries Inc
AUTOMOTIVE - Auto Parts
|
$26.50
|
+0.28
1.07% |
$26.87
|
126,895
384.53% of 50 DAV
50 DAV is 33,000
|
$29.40
-9.86%
|
11/30/2018
|
$28.35
|
PP = $29.50
|
|
MB = $30.98
|
 Most Recent Note - 12/21/2018 12:50:33 PM
G - Sputtering near its closely coinciding 50-day and 200-day moving average (DMA) lines. Resistance remains due to overhead supply up to the $29 level. See the latest FSU analysis for more details and an annotated graph.
>>> FEATURED STOCK ARTICLE : Failed to Produce Buy Signal and Deterioration Raised Concern - 12/20/2018 |
View all notes |
Set NEW NOTE alert |
Company Profile |
SEC
News |
Chart |
Request a new note
C
A
S
I |
CME
-
NASDAQ
C M E Group Inc
DIVERSIFIED SERVICES - Business/Management Services
|
$182.65
|
-2.25
-1.22% |
$189.33
|
4,903,590
212.55% of 50 DAV
50 DAV is 2,307,000
|
$197.08
-7.32%
|
10/4/2018
|
$179.29
|
PP = $177.45
|
|
MB = $186.32
|
Most Recent Note - 12/21/2018 5:04:03 PM
G - Volume-driven loss today violated its 50 DMA line and recent low ($183.43 on 12/06/18) triggering technical sell signals. Recently reported earnings +22% on +2% sales revenues for the Sep '18 quarter, below the +25% minimum earnings guideline (C criteria), raising fundamental concerns.
>>> FEATURED STOCK ARTICLE : Consolidating Above 50-Day Moving Average - 12/12/2018 |
View all notes |
Set NEW NOTE alert |
Company Profile |
SEC
News |
Chart |
Request a new note
C
A
S
I |
UBNT
-
NASDAQ
Ubiquiti Networks
TELECOMMUNICATIONS - Diversified Communication Serv
|
$94.74
|
-2.65
-2.72% |
$99.52
|
794,527
165.18% of 50 DAV
50 DAV is 481,000
|
$115.44
-17.93%
|
11/9/2018
|
$108.20
|
PP = $101.43
|
|
MB = $106.50
|
Most Recent Note - 12/21/2018 5:27:03 PM
G - Slumped further below its 50 DMA line ($100.08) with today's 7th consecutive loss. A rebound above the 50 DMA line is needed for its outlook to improve.
>>> FEATURED STOCK ARTICLE : Volume Totals Cooling While Still Hovering Above "Max Buy" Level - 12/11/2018 |
View all notes |
Set NEW NOTE alert |
Company Profile |
SEC
News |
Chart |
Request a new note
C
A
S
I |
PLNT
-
NYSE
Planet Fitness Inc Cl A
Leisure-Services
|
$50.64
|
-1.41
-2.71% |
$52.55
|
1,746,499
143.98% of 50 DAV
50 DAV is 1,213,000
|
$58.50
-13.44%
|
11/7/2018
|
$57.10
|
PP = $55.45
|
|
MB = $58.22
|
Most Recent Note - 12/21/2018 5:08:13 PM
G - Color code is changed to green after slumping to a close below its 50 DMA line ($51.43) with today's volume-driven loss. The recent low ($48.02 on 11/20/18) and 200 DMA line define the next important support where more damaging losses would raise concerns and trigger technical sell signals.
>>> FEATURED STOCK ARTICLE : Fitness Firm Remains Near High Despite Unhealthy Environment - 12/14/2018 |
View all notes |
Set NEW NOTE alert |
Company Profile |
SEC
News |
Chart |
Request a new note
C
A
S
I |
INVA
-
NASDAQ
Innoviva Inc
Medical-Biomed/Biotech
|
$16.00
|
-0.15
-0.93% |
$16.54
|
1,319,033
113.03% of 50 DAV
50 DAV is 1,167,000
|
$18.60
-13.98%
|
11/23/2018
|
$17.74
|
PP = $18.09
|
|
MB = $18.99
|
Most Recent Note - 12/21/2018 5:05:46 PM
G - Color code is changed to green after slumping below its 50 DMA line ($16.31) during a streak of 7 consecutive losses. A rebound above the 50 DMA line is needed for its outlook to improve.
>>> FEATURED STOCK ARTICLE : Perched Near High With Volume Totals Cooling - 12/13/2018 |
View all notes |
Set NEW NOTE alert |
Company Profile |
SEC
News |
Chart |
Request a new note
C
A
S
I |
Symbol/Exchange
Company Name
Industry Group |
PRICE |
CHANGE
(%Change) |
Day High |
Volume
(% DAV)
(% 50 day avg vol) |
52 Wk Hi
% From Hi |
Featured
Date |
Price
Featured |
Pivot Featured |
|
Max Buy |
|
|
|
THESE ARE NOT BUY RECOMMENDATIONS!
Comments contained in the body of this report are technical
opinions only. The material herein has been obtained
from sources believed to be reliable and accurate, however,
its accuracy and completeness cannot be guaranteed.
This site is not an investment advisor, hence it does
not endorse or recommend any securities or other investments.
Any recommendation contained in this report may not
be suitable for all investors and it is not to be deemed
an offer or solicitation on our part with respect to
the purchase or sale of any securities. All trademarks,
service marks and trade names appearing in this report
are the property of their respective owners, and are
likewise used for identification purposes only.
This report is a service available
only to active Paid Premium Members.
You may opt-out of receiving report notifications
at any time. Questions or comments may be submitted
by writing to Premium Membership Services 665 S.E. 10 Street, Suite 201 Deerfield Beach, FL 33441-5634 or by calling 1-800-965-8307
or 954-785-1121.
|
|
|

