You are not logged in.
This means you
CAN ONLY VIEW reports that were published prior to Friday, February 23, 2024.
You
MUST UPGRADE YOUR MEMBERSHIP if you want to see any current reports.
AFTER MARKET UPDATE - WEDNESDAY, DECEMBER 19TH, 2018
Previous After Market Report Next After Market Report >>>
|
|
|
|
DOW |
-351.98 |
23,323.66 |
-1.49% |
|
Volume |
1,275,124,040 |
+18% |
|
Volume |
2,890,917,300 |
+13% |
|
NASDAQ |
-147.08 |
6,636.83 |
-2.17% |
|
Advancers |
827 |
28% |
|
Advancers |
791 |
25% |
|
S&P 500 |
-39.20 |
2,506.96 |
-1.54% |
|
Decliners |
2,169 |
72% |
|
Decliners |
2,320 |
75% |
|
Russell 2000 |
-27.95 |
1,349.23 |
-2.03% |
|
52 Wk Highs |
4 |
|
|
52 Wk Highs |
13 |
|
|
S&P 600 |
-18.40 |
840.46 |
-2.14% |
|
52 Wk Lows |
819 |
|
|
52 Wk Lows |
823 |
|
|
 |
Correction Worsens as Major Indices Plunge to New 2018 Lows
Kenneth J. Gruneisen - Passed the CAN SLIM® Master's Exam
Stocks finished lower Wednesday. The Dow erased a 380 point gain to ultimately close 351 points lower at 23,323. The S&P 500 notched its seventh-consecutive decline, falling 39 points to 2,506. The Nasdaq Composite slipped 147 points to 6,636. The volume totals on the session were higher than the prior session totals on the NYSE and on the Nasdaq exchange, indicative of more intense distributional pressure. Decliners led advancers by an 11-4 margin on the NYSE and near a 3-1 margin on the Nasdaq exchange. Leadership remained thin as for the third consecutive session there was only 1 high-ranked company from the Leaders List that made a new 52-week high and was listed on the BreakOuts Page. New 52-week lows totals solidly outnumbered new 52-week highs totals on the NYSE and on the Nasdaq exchange. As noted in prior commentaries, the major indices (M criteria) are in a correction. Disciplined investors reduce exposure to protect capital in bad markets and wait for a new rally and solid follow-through day to eventually shift the market direction (M criteria) back to a bullish stance. The Featured Stocks Page provides the most timely analysis on high-ranked leaders. Charts used courtesy of www.stockcharts.com
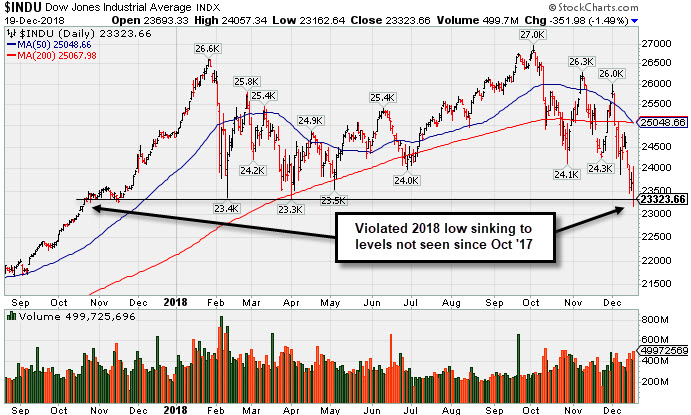
PICTURED: The Dow Jones Industrial Average violated its 2018 low and fell to levels not seen since October 2, 2017.
The major averages fell to their lowest level of the year following the Federal Reserve’s monetary policy decision. As expected, the central bank raised its benchmark interest rate for the fourth time this year. The Fed also projected two rate hikes in 2019, down from November’s median estimate of three increases. However, the statement noted expectations for “some further gradual increases”, which sparked investor concern that the path of tightening may be too aggressive. On the data front, existing home sales rose for the second consecutive month, rising 1.9% in November.
All 11 S&P 500 sectors ended in negative territory. Consumer Discretionary shares led the losses with Amazon (AMZN -3.64%) falling. The Communications sector also lagged, with Facebook (FB -7.25%) down following a report the company mishandled user data. In other corporate news, FedEx (FDX -12.16%) sank after providing disappointing forward guidance.
Treasuries rallied, with the curve flattening following the Fed decision. The benchmark 10-year note yield fell six basis points to 2.76%, the lowest level since May. The 30-year Treasury bond yield dropped below 3% while the two-year yield moved slightly higher to 2.65%. In commodities, WTI crude added 2.1% to $47.20/barrel. COMEX gold gained 0.2% to $1,252.10/ounce despite a stronger dollar. |
 Kenneth J. Gruneisen started out as a licensed stockbroker in August 1987, a couple of months prior to the historic stock market crash that took the Dow Jones Industrial Average down -22.6% in a single day. He has published daily fact-based fundamental and technical analysis on high-ranked stocks online for two decades. Through FACTBASEDINVESTING.COM, Kenneth provides educational articles, news, market commentary, and other information regarding proven investment systems that work in good times and bad.
Comments contained in the body of this report are technical opinions only and are not necessarily those of Gruneisen Growth Corp. The material herein has been obtained from sources believed to be reliable and accurate, however, its accuracy and completeness cannot be guaranteed. Our firm, employees, and customers may effect transactions, including transactions contrary to any recommendation herein, or have positions in the securities mentioned herein or options with respect thereto. Any recommendation contained in this report may not be suitable for all investors and it is not to be deemed an offer or solicitation on our part with respect to the purchase or sale of any securities. |
|
 |
Retail, Financial, Tech, and Commodity-Linked Groups Fell
Kenneth J. Gruneisen - Passed the CAN SLIM® Master's Exam
The Retail Index ($RLX -2.51%), Broker/Dealer Index ($XBD -1.64%), and the Bank Index ($BKX -2.08%) created a drag on the major indices. The tech sector had a negative bias as the Semiconductor Index ($SOX -4.24%) outpaced the Biotech Index ($BTK -2.24%) and Networking Index ($NWX -1.44%) to the downside. The Oil Services Index ($OSX -3.31%) and Integrated Oil Index ($XOI -1.08%) both slumped, and the Gold & Silver Index ($XAU -5.67%) was a standout decliner.
Charts courtesy of www.stockcharts.com
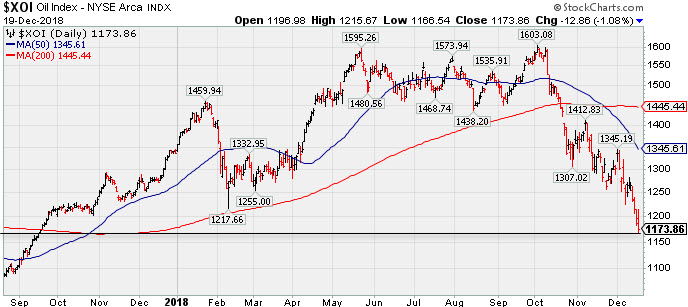 PICTURED: The Integrated Oil Index ($XOI -1.08%) slumped to new 2018 lows and levels not seen since September 2017.
| Oil Services |
$OSX |
82.83 |
-2.83 |
-3.30% |
-44.61% |
| Integrated Oil |
$XOI |
1,173.86 |
-12.86 |
-1.08% |
-12.11% |
| Semiconductor |
$SOX |
1,127.44 |
-49.92 |
-4.24% |
-10.02% |
| Networking |
$NWX |
482.24 |
-7.02 |
-1.44% |
-1.69% |
| Broker/Dealer |
$XBD |
233.09 |
-3.89 |
-1.64% |
-12.12% |
| Retail |
$RLX |
1,924.70 |
-49.61 |
-2.51% |
+11.01% |
| Gold & Silver |
$XAU |
66.61 |
-4.00 |
-5.66% |
-21.88% |
| Bank |
$BKX |
84.47 |
-1.79 |
-2.08% |
-20.84% |
| Biotech |
$BTK |
4,185.60 |
-95.99 |
-2.24% |
-0.87% |
|
|
|
 |
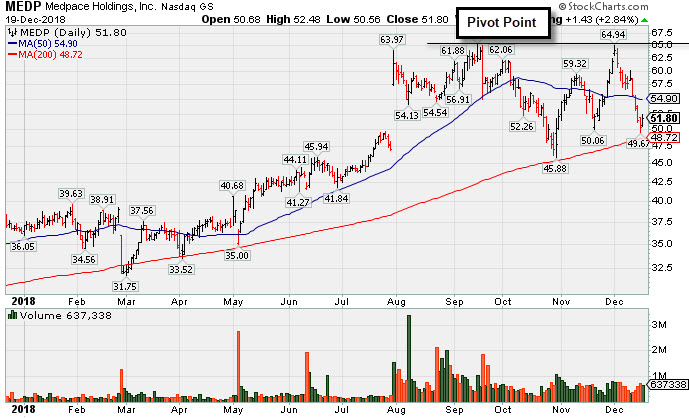
Slumped Badly After Challenging Prior High
Kenneth J. Gruneisen - Passed the CAN SLIM® Master's Exam
Medpace Holdings Inc (MEDP +$1.43 or +2.84% to $51.80) recently slumped below its 50-day moving average (DMA) line ($54.90) with damaging losses triggering a technical sell signal and raising concerns. The 200 DMA line and prior low define the next support to watch. It will be dropped from the Featured Stocks list tonight. A rebound above the 50 DMA line is needed for its outlook to improve.
MEDP was highlighted in yellow with pivot point cited based on its 9/17/18 high plus 10 cents in the 12/03/18 mid-day report (read here). However, disciplined investors will note that it failed to produce the subsequent gains above the pivot point backed by a least +40% above average volume which were needed to trigger a technical buy signal. It was last shown in this FSU section on 12/04/18 with an annotated graph under the headline, "Pullback After 9 Straight Gains Challenged High".
The high-ranked Medical-Research Eqp/Svc firm reported earnings +68% on +62% sales revenues for the Sep '18 quarter marking the 3rd consecutive comparison above the +25% minimum earnings guideline (C criteria). Its annual earnings (A criteria) history has been strong and it has a 96 Earnings Per Share Rating, putting it in the top 5% of all publicly traded companies.
The number of top-rated funds owning its shares rose from 188 in Dec '17 to 382 in Sep '18, a reassuring sign concerning the I criteria. Its current Up/Down Volume Ratio of 1.1 is an unbiased indication its shares have been under slight accumulation over the past 50 days. It has earned a Timeliness Rating of A and Sponsorship rating of B. It support at its 200 DMA line during the consolidation since last noted in the 9/19/18 -"Proposed yet another Secondary Offering on 8/07/18. Completed Secondary Offerings on 6/12/18, 5/04/18, and 12/01/17. "
Charts courtesy of www.stockcharts.com |
|
|
Color Codes Explained :
Y - Better candidates highlighted by our
staff of experts.
G - Previously featured
in past reports as yellow but may no longer be buyable under the
guidelines.
***Last / Change / Volume data in this table is the closing quote data***
Symbol/Exchange
Company Name
Industry Group |
PRICE |
CHANGE
(%Change) |
Day High |
Volume
(% DAV)
(% 50 day avg vol) |
52 Wk Hi
% From Hi |
Featured
Date |
Price
Featured |
Pivot Featured |
|
Max Buy |
MLR
-
NYSE
Miller Industries Inc
AUTOMOTIVE - Auto Parts
|
$26.87
|
-0.16
-0.59% |
$27.34
|
56,711
182.94% of 50 DAV
50 DAV is 31,000
|
$29.40
-8.61%
|
11/30/2018
|
$28.35
|
PP = $29.50
|
|
MB = $30.98
|
Most Recent Note - 12/18/2018 5:26:36 PM
Y - Still sputtering since highlighted in yellow with pivot point cited based on its 8/10/18 high plus 10 cents in the 11/30/18 mid-day report. Resistance remains due to overhead supply up to the $29 level. Subsequent gains above the pivot point backed by at least +40% above average volume are needed to trigger a technical buy signal.
>>> FEATURED STOCK ARTICLE : Perched Within Striking Distance of All Time High - 12/3/2018 |
View all notes |
Set NEW NOTE alert |
Company Profile |
SEC
News |
Chart |
Request a new note
C
A
S
I |
ZBRA
-
NASDAQ
Zebra Tech Corp Cl A
COMPUTER HARDWARE - Computer Peripherals
|
$159.04
|
-3.89
-2.39% |
$166.76
|
764,220
155.01% of 50 DAV
50 DAV is 493,000
|
$184.75
-13.92%
|
11/6/2018
|
$170.41
|
PP = $179.57
|
|
MB = $188.55
|
 Most Recent Note - 12/19/2018 12:32:57 PM
G - Rebounding more today following a volume-driven gain on the prior session. A rebound above the 50 DMA line is needed for its outlook to improve. Damaging volume-driven loss on Monday violated its 50 DMA line ($168) and undercut the recent lows triggering a technical sell signal. The 200 DMA line ($156) defines important near-term support to watch. See the latest FSU analysis for more details and an annotated graph.
>>> FEATURED STOCK ARTICLE : Consolidating Above 200-Day Moving Average - 12/18/2018 |
View all notes |
Set NEW NOTE alert |
Company Profile |
SEC
News |
Chart |
Request a new note
C
A
S
I |
CME
-
NASDAQ
C M E Group Inc
DIVERSIFIED SERVICES - Business/Management Services
|
$185.53
|
+2.74
1.50% |
$188.55
|
2,844,144
126.29% of 50 DAV
50 DAV is 2,252,000
|
$197.08
-5.86%
|
10/4/2018
|
$179.29
|
PP = $177.45
|
|
MB = $186.32
|
Most Recent Note - 12/17/2018 5:50:58 PM
G - Light volume was behind today's 5th consecutive loss while testing near its 50 DMA line ($185.52) and recent low ($183.43 on 12/06/18) noted as important near-term support. Recently reported earnings +22% on +2% sales revenues for the Sep '18 quarter, below the +25% minimum earnings guideline (C criteria), raising fundamental concerns.
>>> FEATURED STOCK ARTICLE : Consolidating Above 50-Day Moving Average - 12/12/2018 |
View all notes |
Set NEW NOTE alert |
Company Profile |
SEC
News |
Chart |
Request a new note
C
A
S
I |
GDOT
-
NYSE
Green Dot Corp Cl A
FINANCIAL SERVICES - Credit Services
|
$76.27
|
-2.33
-2.96% |
$79.70
|
455,138
87.70% of 50 DAV
50 DAV is 519,000
|
$93.00
-17.99%
|
11/8/2018
|
$90.35
|
PP = $91.61
|
|
MB = $96.19
|
Most Recent Note - 12/19/2018 6:00:56 PM
Sputtering below its 50 DMA line ($78.83) testing its 200 DMA line ($76.18). The prior low ($71.50 on 10/29/18) defines the next important near-term support. Faces resistance due to overhead supply up to the $93 level. It will be dropped from the Featured Stocks list tonight.
>>> FEATURED STOCK ARTICLE : Recently Found Support Near 200-Day Average - 12/7/2018 |
View all notes |
Set NEW NOTE alert |
Company Profile |
SEC
News |
Chart |
Request a new note
C
A
S
I |
UBNT
-
NASDAQ
Ubiquiti Networks
TELECOMMUNICATIONS - Diversified Communication Serv
|
$99.60
|
-2.32
-2.28% |
$104.55
|
577,196
119.01% of 50 DAV
50 DAV is 485,000
|
$115.44
-13.72%
|
11/9/2018
|
$108.20
|
PP = $101.43
|
|
MB = $106.50
|
Most Recent Note - 12/19/2018 6:05:29 PM
G - Color code is changed to green after undercutting the prior high ($101.33 on 9/25/18) as today's 5th consecutive loss also led to a close below its 50 DMA line ($99.66).
>>> FEATURED STOCK ARTICLE : Volume Totals Cooling While Still Hovering Above "Max Buy" Level - 12/11/2018 |
View all notes |
Set NEW NOTE alert |
Company Profile |
SEC
News |
Chart |
Request a new note
C
A
S
I |
Symbol/Exchange
Company Name
Industry Group |
PRICE |
CHANGE
(%Change) |
Day High |
Volume
(% DAV)
(% 50 day avg vol) |
52 Wk Hi
% From Hi |
Featured
Date |
Price
Featured |
Pivot Featured |
|
Max Buy |
PRAH
-
NASDAQ
P R A Health Sciences
HEALTH SERVICES - Medical Laboratories and Researc
|
$96.05
|
+0.05
0.05% |
$98.43
|
455,450
85.77% of 50 DAV
50 DAV is 531,000
|
$121.98
-21.26%
|
11/30/2018
|
$117.06
|
PP = $112.98
|
|
MB = $118.63
|
Most Recent Note - 12/19/2018 5:58:07 PM
It will be dropped from the Featured Stocks list tonight. Recent losses violated its 50 and 200 DMA lines amid weak action in the broader market (M criteria). A rebound above the 50 DMA line ($101.56) is needed for its outlook to improve.
>>> FEATURED STOCK ARTICLE : Abrupt Retreat Amid Broadly Weak Market Conditions - 12/17/2018 |
View all notes |
Set NEW NOTE alert |
Company Profile |
SEC
News |
Chart |
Request a new note
C
A
S
I |
PLNT
-
NYSE
Planet Fitness Inc Cl A
Leisure-Services
|
$53.53
|
-0.36
-0.67% |
$55.25
|
1,207,185
98.30% of 50 DAV
50 DAV is 1,228,000
|
$58.50
-8.50%
|
11/7/2018
|
$57.10
|
PP = $55.45
|
|
MB = $58.22
|
Most Recent Note - 12/18/2018 5:27:18 PM
Y - Still perched near its all-time high. Its 50 DMA line and recent low ($48.02 on 11/20/18) define important near-term support to watch on pullbacks.
>>> FEATURED STOCK ARTICLE : Fitness Firm Remains Near High Despite Unhealthy Environment - 12/14/2018 |
View all notes |
Set NEW NOTE alert |
Company Profile |
SEC
News |
Chart |
Request a new note
C
A
S
I |
MEDP
-
NASDAQ
Medpace Holdings Inc
Medical-Research Eqp/Svc
|
$51.80
|
+1.43
2.84% |
$52.48
|
637,338
115.88% of 50 DAV
50 DAV is 550,000
|
$65.09
-20.42%
|
12/3/2018
|
$63.43
|
PP = $65.19
|
|
MB = $68.45
|
Most Recent Note - 12/19/2018 5:55:51 PM
Lingering below its 50 DMA line after damaging losses triggered a technical sell signal. The 200 DMA line and prior low define the next support to watch. It will be dropped from the Featured Stocks list tonight. See the latest FSU analysis for more details and a new annotated graph.
>>> FEATURED STOCK ARTICLE : Slumped Badly After Challenging Prior High - 12/19/2018 |
View all notes |
Set NEW NOTE alert |
Company Profile |
SEC
News |
Chart |
Request a new note
C
A
S
I |
INVA
-
NASDAQ
Innoviva Inc
Medical-Biomed/Biotech
|
$16.48
|
-0.11
-0.66% |
$16.93
|
916,503
79.56% of 50 DAV
50 DAV is 1,152,000
|
$18.60
-11.40%
|
11/23/2018
|
$17.74
|
PP = $18.09
|
|
MB = $18.99
|
Most Recent Note - 12/18/2018 5:25:28 PM
Y - Volume totals have been cooling while consolidating above its 50 DMA line ($16.25). Subsequent gains and a strong close above the pivot point backed by at least +40% above average volume may clinch a technical buy signal.
>>> FEATURED STOCK ARTICLE : Perched Near High With Volume Totals Cooling - 12/13/2018 |
View all notes |
Set NEW NOTE alert |
Company Profile |
SEC
News |
Chart |
Request a new note
C
A
S
I |
|
|
|
THESE ARE NOT BUY RECOMMENDATIONS!
Comments contained in the body of this report are technical
opinions only. The material herein has been obtained
from sources believed to be reliable and accurate, however,
its accuracy and completeness cannot be guaranteed.
This site is not an investment advisor, hence it does
not endorse or recommend any securities or other investments.
Any recommendation contained in this report may not
be suitable for all investors and it is not to be deemed
an offer or solicitation on our part with respect to
the purchase or sale of any securities. All trademarks,
service marks and trade names appearing in this report
are the property of their respective owners, and are
likewise used for identification purposes only.
This report is a service available
only to active Paid Premium Members.
You may opt-out of receiving report notifications
at any time. Questions or comments may be submitted
by writing to Premium Membership Services 665 S.E. 10 Street, Suite 201 Deerfield Beach, FL 33441-5634 or by calling 1-800-965-8307
or 954-785-1121.
|
|
|