Help Lines 954-785-1121


You are not logged in. Upgrade Here
 <<<Previous Mid Day Report     Next Mid Day Report >>> 
 <<<Previous After Market Report Next After Market Report >>> 
You are not logged in.
This means you CAN ONLY VIEW reports that were published prior to Sunday, February 25, 2024.
You MUST UPGRADE YOUR MEMBERSHIP if you want to see any current reports.

AFTER MARKET UPDATE - WEDNESDAY, DECEMBER 18TH, 2019
Previous After Market Report Next After Market Report >>>
Indices NYSE Nasdaq
DOW  -27.88 28,239.28 -0.10% Volume 984,390,340 +5% Volume 2,701,275,200 +17%
NASDAQ +4.37 8,827.73 +0.05% Advancers 1,783 62% Advancers 1,590 51%
S&P 500 -1.38 3,191.14 -0.04% Decliners 1,113 38% Decliners 1,552 49%
Russell 2000 +4.17 1,661.73 +0.25% 52 Wk Highs 170   52 Wk Highs 243  
S&P 600 +3.81 1,019.53 +0.38% 52 Wk Lows 8   52 Wk Lows 61  

Major Indices Hover at Record Highs

The S&P 500 finished just below the flat line, snapping a five-session streak of gains, while the Nasdaq Composite added less than 0.1%.  The Dow drifted 27 points lower on the day.  Advancers led decliners by a 3-2 margin on the NYSE but only by a narrow margin on the Nasdaq exchange. The volume totals were higher than the prior session on the NYSE and on the Nasdaq exchange. There were 83 high-ranked companies from the Leaders List that hit a new 52-week high and were listed on the BreakOuts Page, versus the total of 60 on the prior session. New 52-week highs totals easily outnumbered new 52-week lows totals on the NYSE and on the Nasdaq exchange. The major indices (M criteria) are in a "confirmed uptrend" after enduring distributional pressure in recent weeks. The Featured Stocks Page provides the most timely analysis on high-ranked leaders.

Charts used courtesy of www.stockcharts.com

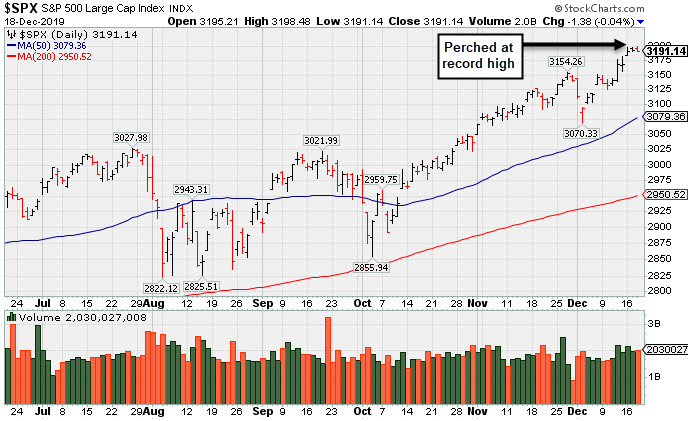
PICTURED: The S&P 500 Index is perched at a record high. It recently found support well above prior highs and above its 50-day moving average (DMA) line.

Stocks finished mixed on Wednesday as investors digested a handful of corporate earnings updates and kept an eye on impeachment news out of Washington. The S&P 500 remains on course for its best annual performance since 2013, up more than 27% year-to-date.

Five of 11 S&P 500 sectors closed in positive territory with Real Estate shares pacing gains, up 1.3%. The closely watched “FAANG” group also outperformed, climbing 0.8%. Industrials lagged, and Financials also underperformed despite an uptick in yields. 

In earnings, FedEx (FDX -10.03%) fell after its profit and revenue figures both fell short of Wall Street estimates. The parcel delivery service also lowered its earnings guidance for the fourth time this year. Meanwhile, General Mills (GIS +1.94%) rose after topping analyst profit expectations. In other corporate news, Eli Lilly (LLY +3.31%) following an analyst upgrade.

Treasuries weakened with the yield on the benchmark 10-year note up four basis points to 1.92%. On the data front, the lone economic release revealed mortgage applications fell 5% in the most recent week. In commodities, WTI crude pared an earlier decline, slipping less than 0.1% to $60.93/barrel after U.S. government data revealed a surprise drop in crude stockpiles. COMEX gold dipped 0.1% to $1,472.60/ounce.


Kenneth J. Gruneisen started out as a licensed stockbroker in August 1987, a couple of months prior to the historic stock market crash that took the Dow Jones Industrial Average down -22.6% in a single day. He has published daily fact-based fundamental and technical analysis on high-ranked stocks online for two decades. Through FACTBASEDINVESTING.COM, Kenneth provides educational articles, news, market commentary, and other information regarding proven investment systems that work in good times and bad.

Comments contained in the body of this report are technical opinions only and are not necessarily those of Gruneisen Growth Corp. The material herein has been obtained from sources believed to be reliable and accurate, however, its accuracy and completeness cannot be guaranteed. Our firm, employees, and customers may effect transactions, including transactions contrary to any recommendation herein, or have positions in the securities mentioned herein or options with respect thereto. Any recommendation contained in this report may not be suitable for all investors and it is not to be deemed an offer or solicitation on our part with respect to the purchase or sale of any securities.


Commodity-Linked Groups Rose

The Broker/Dealer Index ($XBD -0.50%) and Bank Index ($BKX -0.43%) each lost a little bit of ground along with thRetail Index ($RLX -0.21%). The tech sector had a negative bias as the Networking Index ($NWX -0.36%) and the Biotech Index ($BTK -0.70%) both sputtered lower and the Semiconductor Index ($SOX -0.09%) finished flat. Commodity-linked groups had a positive bias as the Gold & Silver Index ($XAU +1.03%) and Oil Services Index ($OSX +1.11%) both outpaced the Integrated Oil Index ($XOI +0.20%).
Charts courtesy of www.stockcharts.com

PICTURED: The Oil Services Index ($OSX +1.11%) is rebounding near its 200-day moving average (DMA) line and approaching its September high.

Industry Index Symbol Close Change % Change YTD % Change
Oil Services $OSX  76.14 +0.84 +1.12% -5.53%
Integrated Oil $XOI  1,247.91 +2.52 +0.20% +7.66%
Semiconductor $SOX  1,820.29 -1.63 -0.09% +57.58%
Networking $NWX  576.96 -2.09 -0.36% +18.07%
Broker/Dealer $XBD  292.82 -1.49 -0.50% +23.38%
Retail $RLX  2,405.06 -5.17 -0.21% +23.25%
Gold & Silver $XAU  99.55 +1.01 +1.02% +40.89%
Bank $BKX  113.47 -0.50 -0.44% +32.26%
Biotech $BTK  5,110.64 -36.13 -0.70% +21.08%


Featured Stocks

See the Featured Stocks with most recent note below. Feel free to contact us if you have a need for any additional information.

Color Codes Explained :
Y - Better candidates highlighted by our staff of experts.
G - Previously featured in past reports as yellow but may no longer be buyable under the guidelines.

***Last / Change / Volume data in this table is the closing quote data***
Symbol/Exchange
Company Name
Industry Group
PRICE CHANGE
(%Change)
Day High Volume
(% DAV)
(% 50 day avg vol)
52 Wk Hi
% From Hi
Featured
Date
Price
Featured
Pivot Featured
Max Buy
StockCharts.com Latest Chart for MLR MLR - NYSE
Miller Industries Inc
AUTOMOTIVE - Auto Parts  
$37.83 +0.43
1.15%

$38.18

24,158
53.68% of 50 DAV
50 DAV is 45,000
$37.94
-0.29%
9/24/2019 $34.00 PP = $35.36
MB = $37.13
Most Recent Note - 12/17/2019 5:16:44 PM
G - Hit a new 52-week high as it rallied above its "max buy" level today with a gain backed by light volume and its color code was changed to green. Prior highs in the $35 area define initial support along with its 50 DMA line. Resilient after reporting Sep '19 earnings which were below the fundamental guidelines of the fact-based investment system.
>>> FEATURED STOCK ARTICLE : Miller Still Quietly Hovering Above Prior Highs - 12/4/2019
 |  View all notes | Set NEW NOTE alert | Company Profile | SEC News | Chart | Request a new note C A  S  I 
StockCharts.com Latest Chart for CCBG CCBG - NASDAQ
Capital City Bk Gp
BANKING - Regional - Mid-Atlantic Banks  
$30.43 -0.23
-0.75%

$30.88

37,935
92.52% of 50 DAV
50 DAV is 41,000
$30.85
-1.36%
12/16/2019 $30.07 PP = $30.95
MB = $32.50
Most Recent Note - 12/17/2019 5:15:49 PM
Y - Posted a 4th consecutive gain backed by above average volume and finished strong today while challenging its 52-week high. Subsequent gains above the new pivot point cited based on its 11/06/19 high plus 10 cents may trigger a new (or add-on) technical buy signal. Found support at its 50 DMA line ($28.76) during its orderly consolidation.
>>> FEATURED STOCK ARTICLE : Found Support at 50-Day Moving Average - 12/10/2019
 |  View all notes | Set NEW NOTE alert | Company Profile | SEC News | Chart | Request a new note C A  S  I 
StockCharts.com Latest Chart for FTNT FTNT - NASDAQ
Fortinet Inc
Computer Sftwr-Security  
$108.00 +1.65
1.55%

$108.54

1,466,955
107.31% of 50 DAV
50 DAV is 1,367,000
$107.77
0.21%
12/9/2019 $103.85 PP = $106.10
MB = $111.41
Most Recent Note - 12/13/2019 5:27:55 PM
Y - Touched a new high as it posted a gain today with below average volume. Color code was changed to yellow with new pivot point cited based on its 11/20/19 high plus 10 cents after forming an advanced 3-weeks tight base pattern. Volume totals have been cooling while still stubbornly holding its ground. Prior high in the $97 area defines initial support to watch on pullbacks.

>>> FEATURED STOCK ARTICLE : Extended From Prior Base Perched Near Record HIgh - 12/2/2019
 |  View all notes | Set NEW NOTE alert | Company Profile | SEC News | Chart | Request a new note C A  S  I 
StockCharts.com Latest Chart for SPSC SPSC - NASDAQ
S P S Commerce Inc
COMPUTER SOFTWARE and SERVICES - Application Software  
$56.96 +0.32
0.56%

$57.34

198,413
98.22% of 50 DAV
50 DAV is 202,000
$59.14
-3.69%
11/29/2019 $56.59 PP = $59.24
MB = $62.20
Most Recent Note - 12/16/2019 5:10:32 PM
Y - Posted a 3rd consecutive gain while perched near its all-time high. Subsequent gains above its pivot point backed by at least +40% above average volume are needed to trigger a new technical buy signal. Fundamentals remain strong.
>>> FEATURED STOCK ARTICLE : Rebound Leaves Supply Chain Management Software Firm Near High - 11/29/2019
 |  View all notes | Set NEW NOTE alert | Company Profile | SEC News | Chart | Request a new note C A  S  I 
StockCharts.com Latest Chart for AUDC AUDC - NASDAQ
Audiocodes Ltd
ELECTRONICS - Scientific and Technical Instrum  
$25.35 -0.35
-1.36%

$26.00

239,092
91.61% of 50 DAV
50 DAV is 261,000
$25.99
-2.46%
9/13/2019 $19.68 PP = $19.84
MB = $20.83
Most Recent Note - 12/16/2019 5:15:38 PM
G - Posted a gain today with average volume for a new all-time high. Getting very extended from the previously noted base. Prior highs in the $22 area define initial support above its 50 DMA line ($21.47). Fundamentals remain strong. See the latest FSU analysis for more details and an annotated graph.

>>> FEATURED STOCK ARTICLE : Reversed Into Red After Hitting Yet Another New High - 12/13/2019
 |  View all notes | Set NEW NOTE alert | Company Profile | SEC News | Chart | Request a new note C A  S  I 
Symbol/Exchange
Company Name
Industry Group
PRICE CHANGE
(%Change)
Day High Volume
(% DAV)
(% 50 day avg vol)
52 Wk Hi
% From Hi
Featured
Date
Price
Featured
Pivot Featured
Max Buy
StockCharts.com Latest Chart for CHDN CHDN - NASDAQ
Churchill Downs Inc
LEISURE - Gaming Activities  
$133.45 -1.14
-0.85%

$135.05

196,894
67.20% of 50 DAV
50 DAV is 293,000
$137.42
-2.89%
10/8/2019 $129.77 PP = $132.83
MB = $139.47
Most Recent Note - 12/13/2019 5:26:33 PM
G - Posted a gain today with near average volume for a best-ever close while challenging its 52-week high. Its 50 DMA line ($129.61) defines near-term support above the prior low ($121.81 on 11/07/19) The Jun and Sep '19 quarterly earnings versus the year ago periods were both below the +25% minimum guideline (C criteria) and raised fundamental concerns.
>>> FEATURED STOCK ARTICLE : Met Resistance After Rebounding Near Prior High - 12/9/2019
 |  View all notes | Set NEW NOTE alert | Company Profile | SEC News | Chart | Request a new note C A  S  I 
StockCharts.com Latest Chart for LULU LULU - NASDAQ
Lululemon Athletica
MANUFACTURING - Textile Manufacturing  
$224.31 +1.33
0.60%

$225.60

2,069,505
101.60% of 50 DAV
50 DAV is 2,037,000
$235.50
-4.75%
9/6/2019 $201.25 PP = $194.35
MB = $204.07
Most Recent Note - 12/17/2019 5:07:25 PM
G - Recently reported earnings +28% on +23% sales revenues for the Oct '19 quarter. Its 50 DMA line ($212.49) and prior high in the $209 area define important near-term support levels to watch. See the latest FSU analysis for more details and a new annotated graph.
>>> FEATURED STOCK ARTICLE : Retreated From High After Another Strong Earnings Report - 12/17/2019
 |  View all notes | Set NEW NOTE alert | Company Profile | SEC News | Chart | Request a new note C A  S  I 
StockCharts.com Latest Chart for CPRT CPRT - NASDAQ
Copart Inc
SPECIALTY RETAIL - Auto Dealerships  
$89.90 -0.48
-0.53%

$90.29

1,794,089
107.17% of 50 DAV
50 DAV is 1,674,000
$92.41
-2.72%
9/5/2019 $79.13 PP = $79.84
MB = $83.83
Most Recent Note - 12/12/2019 6:01:29 PM
G - Consolidating after getting extended from any sound base. The 50 DMA line ($84.47) defines near-term support above the prior low ($80.71 on 11/06/19). Fundamentals remain strong. See the latest FSU analysis for more details and a new annotated graph.
>>> FEATURED STOCK ARTICLE : Extended From Prior Base and Hovering Near Record High - 12/12/2019
 |  View all notes | Set NEW NOTE alert | Company Profile | SEC News | Chart | Request a new note C A  S  I 
StockCharts.com Latest Chart for NMIH NMIH - NASDAQ
N M I Holdings Inc Cl A
Finance-MrtgandRel Svc  
$34.45 +0.45
1.31%

$34.74

753,680
171.29% of 50 DAV
50 DAV is 440,000
$34.50
-0.16%
11/8/2019 $32.89 PP = $31.44
MB = $33.01
Most Recent Note - 12/16/2019 5:13:25 PM
G - Stubbornly holding is ground perched within close striking distance of its all-time high. Prior highs in the $30-31 area coincide with its 50 DMA line defining important near-term support..
>>> FEATURED STOCK ARTICLE : Holding Ground Stubbornly Near All-Time High - 11/27/2019
 |  View all notes | Set NEW NOTE alert | Company Profile | SEC News | Chart | Request a new note C A  S  I 
StockCharts.com Latest Chart for SPLK SPLK - NASDAQ
Splunk Inc
Computer Sftwr-Database  
$148.10 +3.00
2.07%

$149.24

1,643,544
84.41% of 50 DAV
50 DAV is 1,947,000
$152.68
-3.00%
11/25/2019 $147.79 PP = $142.16
MB = $149.27
Most Recent Note - 12/16/2019 5:09:36 PM
Y - Still consolidating above its pivot point and below its "max buy" level. Prior highs in the $142-143 area define initial support to watch on pullbacks. See the latest FSU analysis for more details and a new annotated graph.
>>> FEATURED STOCK ARTICLE : Consolidating Above Prior Highs Following Impressive Rally - 12/16/2019
 |  View all notes | Set NEW NOTE alert | Company Profile | SEC News | Chart | Request a new note C A  S  I 
Symbol/Exchange
Company Name
Industry Group
PRICE CHANGE
(%Change)
Day High Volume
(% DAV)
(% 50 day avg vol)
52 Wk Hi
% From Hi
Featured
Date
Price
Featured
Pivot Featured
Max Buy
StockCharts.com Latest Chart for PAYC PAYC - NYSE
Paycom Software Inc
COMPUTER SOFTWARE and SERVICES - Application Software  
$259.34 +2.83
1.10%

$261.99

315,626
56.16% of 50 DAV
50 DAV is 562,000
$279.95
-7.36%
11/20/2019 $252.97 PP = $259.81
MB = $272.80
Most Recent Note - 12/17/2019 5:11:08 PM
Y - Quietly slumped back below its pivot point raising some concerns while falling back into the prior base. Fundamentals remain strong.
>>> FEATURED STOCK ARTICLE : Consolidating Near Prior Highs Which Define Initial Support - 12/11/2019
 |  View all notes | Set NEW NOTE alert | Company Profile | SEC News | Chart | Request a new note C A  S  I 
StockCharts.com Latest Chart for BLD BLD - NYSE
Topbuild Corp
Bldg-Constr Prds/Misc  
$104.36 -0.59
-0.56%

$106.33

263,723
98.40% of 50 DAV
50 DAV is 268,000
$113.74
-8.25%
12/9/2019 $109.71 PP = $113.84
MB = $119.53
Most Recent Note - 12/13/2019 5:24:58 PM
Y - Found support at its 50 DMA line ($104.82) today following a volume-driven loss. Color code was changed to yellow after a tight consolidation, with new pivot point cited based on its 11/27/19 high plus 10 cents. Subsequent gains for new highs back by at least +40% above average volume are needed to trigger a new (or add-on) technical buy signal. Reported earnings +24% on +5% sales revenues for the Sep '19 quarter versus the year ago period, just below the +25% minimum guideline (C criteria). Its 50 DMA line has acted as support during its ongoing ascent.
>>> FEATURED STOCK ARTICLE : Consolidating After Getting Extended From Any Sound Base - 12/3/2019
 |  View all notes | Set NEW NOTE alert | Company Profile | SEC News | Chart | Request a new note C A  S  I 
StockCharts.com Latest Chart for GLOB GLOB - NYSE
Globant SA
Computer-Tech Services  
$99.70 -1.47
-1.45%

$102.44

305,727
113.65% of 50 DAV
50 DAV is 269,000
$112.33
-11.24%
11/14/2019 $106.87 PP = $112.43
MB = $118.05
Most Recent Note - 12/17/2019 5:13:17 PM
G - Subsequent volume-driven gains for new highs are still needed to trigger a technical buy signal. Found support near its 50 DMA line ($99) after volume-driven losses. Prior lows and its 200 DMA line define the next important support to watch. Fundamentals remain strong.
>>> FEATURED STOCK ARTICLE : Found Support at 50-Day Average During Choppy Consolidation - 12/5/2019
 |  View all notes | Set NEW NOTE alert | Company Profile | SEC News | Chart | Request a new note C A  S  I 

THESE ARE NOT BUY RECOMMENDATIONS!  Comments contained in the body of this report are technical opinions only. The material herein has been obtained from sources believed to be reliable and accurate, however, its accuracy and completeness cannot be guaranteed. This site is not an investment advisor, hence it does not endorse or recommend any securities or other investments. Any recommendation contained in this report may not be suitable for all investors and it is not to be deemed an offer or solicitation on our part with respect to the purchase or sale of any securities. All trademarks, service marks and trade names appearing in this report are the property of their respective owners, and are likewise used for identification purposes only.

This report is a service available only to active Paid Premium Members. You may opt-out of receiving report notifications at any time.  Questions or comments may be submitted by writing to Premium Membership Services 665 S.E. 10 Street, Suite 201 Deerfield Beach, FL 33441-5634 or by calling 1-800-965-8307 or 954-785-1121.

Kenneth J. Gruneisen founded Gruneisen Growth Corp. (2003), which prior to May 11, 2015, operated CANSLIM.net and CANSLIM.com both under license from Data Analysis Inc. / Investor's Business Daily. Kenneth has passed the CAN SLIM® Master's Exam. Gruneisen Growth Corp. now continues over two decades of fact based market analysis via FactBasedInvesting.com.

Copyright © 1996-2024 Gruneisen Growth Corp. All rights reserved. Protected by the copyright laws of the United States and Canada and by international treaties

Privacy Policy | Terms of Use | Contact Us