Help Lines 954-785-1121


You are not logged in. Upgrade Here
 <<<Previous Mid Day Report     Next Mid Day Report >>> 
 <<<Previous After Market Report Next After Market Report >>> 
You are not logged in.
This means you CAN ONLY VIEW reports that were published prior to Saturday, February 24, 2024.
You MUST UPGRADE YOUR MEMBERSHIP if you want to see any current reports.

AFTER MARKET UPDATE - MONDAY, DECEMBER 16TH, 2019
Previous After Market Report Next After Market Report >>>
Indices NYSE Nasdaq
DOW  +100.51 28,235.89 +0.36% Volume 1,071,325,670 +27% Volume 2,308,176,560 +6%
NASDAQ +79.35 8,814.23 +0.91% Advancers 1,993 69% Advancers 2,004 63%
S&P 500 +22.65 3,191.45 +0.71% Decliners 886 31% Decliners 1,184 37%
Russell 2000 +11.96 1,649.94 +0.73% 52 Wk Highs 223   52 Wk Highs 343  
S&P 600 +5.14 1,007.93 +0.51% 52 Wk Lows 20   52 Wk Lows 63  

Leadership Improved and Volume Rose as Indices Hit New Records

The major indices rallied again for new record highs. Advancers led decliners by more than a 2-1 margin on the NYSE, meanwhile and 5-3 on the Nasdaq exchange. The volume totals were higher than the prior session on the NYSE and on the Nasdaq exchange, indicative of greater institutional buying demand. Leadership improved as there were 101 high-ranked companies from the Leaders List that hit a new 52-week high and were listed on the BreakOuts Page, versus the total of 83 on the prior session. New 52-week highs totals easily outnumbered new 52-week lows totals on the NYSE and on the Nasdaq exchange. The major indices (M criteria) are in a "confirmed uptrend" after enduring distributional pressure in recent weeks. The Featured Stocks Page provides the most timely analysis on high-ranked leaders.

Charts used courtesy of www.stockcharts.com

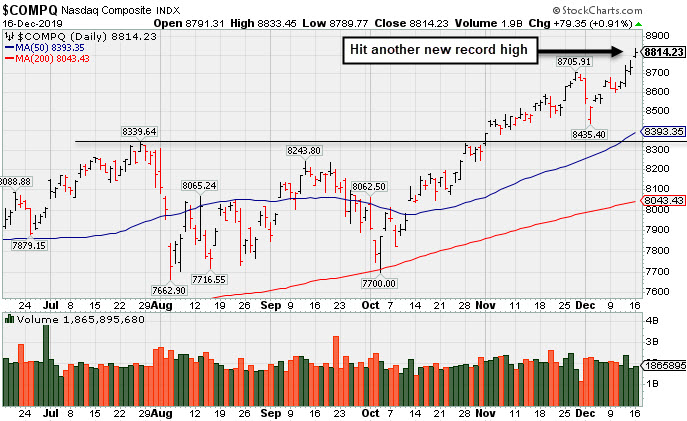
PICTURED: The Nasdaq Composite Index hit a new record high with its 7th gain in the span of 9 sessions. It recently found support above prior highs and above its 50-day moving average (DMA) line.

Last Friday, the U.S. and China agreed to a “phase one” trade deal, which will reportedly be signed next month. As part of the agreement, Washington’s December 15th round of tariffs did not go into effect, and levies on some existing Chinese imports will be cut in half. For their part, Beijing promised to increase U.S. agricultural purchases.

Treasuries were weaker amid the perceived “risk on” sentiment. On the data front, a report from research firm IHS Markit showed U.S. manufacturing and services sector activity both remain in expansionary territory in December. Separately, homebuilder confidence climbed to the highest level since 1999, according to the NAHB. Overseas, Chinese industrial production gained the most since June. In commodities, WTI crude neared a three-month high.

In corporate news, Boeing (BA -4.29%) fell on reports the aerospace giant is considering halting production on its grounded 737-MAX aircrafts. Micron Technologies (MU +3.40%) jumped after a Wall Street analyst boosted its price target. Elsewhere, International Flavors & Fragrances (IFF -10.43%) and DuPont (DD +0.14%) announced they will merge their nutrition businesses.

Kenneth J. Gruneisen started out as a licensed stockbroker in August 1987, a couple of months prior to the historic stock market crash that took the Dow Jones Industrial Average down -22.6% in a single day. He has published daily fact-based fundamental and technical analysis on high-ranked stocks online for two decades. Through FACTBASEDINVESTING.COM, Kenneth provides educational articles, news, market commentary, and other information regarding proven investment systems that work in good times and bad.

Comments contained in the body of this report are technical opinions only and are not necessarily those of Gruneisen Growth Corp. The material herein has been obtained from sources believed to be reliable and accurate, however, its accuracy and completeness cannot be guaranteed. Our firm, employees, and customers may effect transactions, including transactions contrary to any recommendation herein, or have positions in the securities mentioned herein or options with respect thereto. Any recommendation contained in this report may not be suitable for all investors and it is not to be deemed an offer or solicitation on our part with respect to the purchase or sale of any securities.


Tech, Energy, Financial, and Retail Indexes Rose

The Broker/Dealer Index ($XBD +0.77%) and Bank Index ($BKX +0.39%) gained ground along with thRetail Index ($RLX +0.38%). The tech sector had a positive bias as the Biotech Index ($BTK +1.43%) outpaced the Semiconductor Index ($SOX +0.96%) and Networking Index ($NWX +0.90%). The Oil Services Index ($OSX +0.98%) and the Integrated Oil Index ($XOI +1.72%) both gained ground, meanwhile, the Gold & Silver Index ($XAU -1.03%) was a standout decliner.
Charts courtesy of www.stockcharts.com

PICTURED: The Integrated Oil Index ($XOI +1.72%) rebounded near its 200-day moving average (DMA) line.

Industry Index Symbol Close Change % Change YTD % Change
Oil Services $OSX  74.88 +0.73 +0.98% -7.10%
Integrated Oil $XOI  1,243.44 +21.05 +1.72% +7.28%
Semiconductor $SOX  1,813.31 +17.27 +0.96% +56.97%
Networking $NWX  576.42 +5.15 +0.90% +17.96%
Broker/Dealer $XBD  292.84 +2.25 +0.77% +23.38%
Retail $RLX  2,389.87 +8.96 +0.38% +22.47%
Gold & Silver $XAU  99.24 -1.04 -1.04% +40.45%
Bank $BKX  113.09 +0.45 +0.40% +31.82%
Biotech $BTK  5,164.31 +72.59 +1.43% +22.35%


Consolidating Above Prior Highs Following Impressive Rally

Splunk Inc (SPLK +$2.80 or +1.95% to $146.31) is still consolidating above its pivot point and below its "max buy" level. Prior highs in the $142-143 area define initial support to watch on pullbacks.

SPLK finished strong after highlighted in to yellow with pivot point cited based on its 7/26/19 high plus 10 cents in the 11/25/19 mid-day report (read here). Volume was +349% above average behind the big gain today and the strong close above the pivot point clinched a convincing new technical buy signal.

Fundamentals remain strong. Bullish action came as it gapped up on 11/22/19 after reporting earnings +53% on +30% sales revenues versus the year ago period ended October 31st.
Quarterly comparisons have been above the +25% minimum guideline (C criteria). Annual earnings history has been strong. The high-ranked Computer Software - Database firm has earned an 99 earnings Per Share Rating, well above the 80+ minimum guideline for buy candidates. Its annual earnings (A criteria) history has been strong since reaching profitability in FY '15.

It was last shown in this FSU section on 11/25/19 with an annotated graph under the headline, "Spurt of Volume-Driven Gains Reaches New All-Time High". The number of top-rated funds owning its shares rose from 748 in Jun '17 to 1,186 in Sep '19, a reassuring sign concerning the I criteria. The current Up/Down Volume Ratio of 1.4 is an unbiased indication its shares have been under accumulation over the past 50 days. Its Timeliness Rating is A and Sponsorship Rating is B.
Charts used courtesy of www.stockcharts.com

Color Codes Explained :
Y - Better candidates highlighted by our staff of experts.
G - Previously featured in past reports as yellow but may no longer be buyable under the guidelines.

***Last / Change / Volume data in this table is the closing quote data***
Symbol/Exchange
Company Name
Industry Group
PRICE CHANGE
(%Change)
Day High Volume
(% DAV)
(% 50 day avg vol)
52 Wk Hi
% From Hi
Featured
Date
Price
Featured
Pivot Featured
Max Buy
StockCharts.com Latest Chart for MLR MLR - NYSE
Miller Industries Inc
AUTOMOTIVE - Auto Parts  
$36.74 +0.24
0.66%

$37.27

25,473
56.61% of 50 DAV
50 DAV is 45,000
$37.70
-2.55%
9/24/2019 $34.00 PP = $35.36
MB = $37.13
Most Recent Note - 12/16/2019 5:12:26 PM
Y - Resilient after reporting Sep '19 earnings which were below the fundamental guidelines of the fact-based investment system. Remains perched near its 52-week high. Prior highs in the $35 area define initial support along with its 50 DMA line.
>>> FEATURED STOCK ARTICLE : Miller Still Quietly Hovering Above Prior Highs - 12/4/2019
 |  View all notes | Set NEW NOTE alert | Company Profile | SEC News | Chart | Request a new note C A  S  I 
StockCharts.com Latest Chart for CCBG CCBG - NASDAQ
Capital City Bk Gp
BANKING - Regional - Mid-Atlantic Banks  
$29.85 +0.05
0.17%

$30.19

63,916
163.89% of 50 DAV
50 DAV is 39,000
$30.85
-3.24%
12/16/2019 $30.07 PP = $30.95
MB = $32.50
Most Recent Note - 12/16/2019 12:22:34 PM
Y - Color code is changed to yellow with new pivot point cited based on its 11/06/19 high plus 10 cents after forming a 6 week flat base. Found support at its 50 DMA line ($28.69) during its orderly consolidation.
>>> FEATURED STOCK ARTICLE : Found Support at 50-Day Moving Average - 12/10/2019
 |  View all notes | Set NEW NOTE alert | Company Profile | SEC News | Chart | Request a new note C A  S  I 
StockCharts.com Latest Chart for FTNT FTNT - NASDAQ
Fortinet Inc
Computer Sftwr-Security  
$107.24 +1.60
1.51%

$107.77

1,117,016
82.50% of 50 DAV
50 DAV is 1,354,000
$106.65
0.55%
12/9/2019 $103.85 PP = $106.10
MB = $111.41
Most Recent Note - 12/13/2019 5:27:55 PM
Y - Touched a new high as it posted a gain today with below average volume. Color code was changed to yellow with new pivot point cited based on its 11/20/19 high plus 10 cents after forming an advanced 3-weeks tight base pattern. Volume totals have been cooling while still stubbornly holding its ground. Prior high in the $97 area defines initial support to watch on pullbacks.

>>> FEATURED STOCK ARTICLE : Extended From Prior Base Perched Near Record HIgh - 12/2/2019
 |  View all notes | Set NEW NOTE alert | Company Profile | SEC News | Chart | Request a new note C A  S  I 
StockCharts.com Latest Chart for SPSC SPSC - NASDAQ
S P S Commerce Inc
COMPUTER SOFTWARE and SERVICES - Application Software  
$56.55 +0.37
0.66%

$57.70

197,510
98.26% of 50 DAV
50 DAV is 201,000
$59.14
-4.38%
11/29/2019 $56.59 PP = $59.24
MB = $62.20
Most Recent Note - 12/16/2019 5:10:32 PM
Y - Posted a 3rd consecutive gain while perched near its all-time high. Subsequent gains above its pivot point backed by at least +40% above average volume are needed to trigger a new technical buy signal. Fundamentals remain strong.
>>> FEATURED STOCK ARTICLE : Rebound Leaves Supply Chain Management Software Firm Near High - 11/29/2019
 |  View all notes | Set NEW NOTE alert | Company Profile | SEC News | Chart | Request a new note C A  S  I 
StockCharts.com Latest Chart for AUDC AUDC - NASDAQ
Audiocodes Ltd
ELECTRONICS - Scientific and Technical Instrum  
$25.54 +0.85
3.44%

$25.82

275,206
104.64% of 50 DAV
50 DAV is 263,000
$25.63
-0.35%
9/13/2019 $19.68 PP = $19.84
MB = $20.83
Most Recent Note - 12/16/2019 5:15:38 PM
G - Posted a gain today with average volume for a new all-time high. Getting very extended from the previously noted base. Prior highs in the $22 area define initial support above its 50 DMA line ($21.47). Fundamentals remain strong. See the latest FSU analysis for more details and an annotated graph.

>>> FEATURED STOCK ARTICLE : Reversed Into Red After Hitting Yet Another New High - 12/13/2019
 |  View all notes | Set NEW NOTE alert | Company Profile | SEC News | Chart | Request a new note C A  S  I 
Symbol/Exchange
Company Name
Industry Group
PRICE CHANGE
(%Change)
Day High Volume
(% DAV)
(% 50 day avg vol)
52 Wk Hi
% From Hi
Featured
Date
Price
Featured
Pivot Featured
Max Buy
StockCharts.com Latest Chart for CHDN CHDN - NASDAQ
Churchill Downs Inc
LEISURE - Gaming Activities  
$135.32 -0.13
-0.10%

$137.42

225,329
76.64% of 50 DAV
50 DAV is 294,000
$135.86
-0.40%
10/8/2019 $129.77 PP = $132.83
MB = $139.47
Most Recent Note - 12/13/2019 5:26:33 PM
G - Posted a gain today with near average volume for a best-ever close while challenging its 52-week high. Its 50 DMA line ($129.61) defines near-term support above the prior low ($121.81 on 11/07/19) The Jun and Sep '19 quarterly earnings versus the year ago periods were both below the +25% minimum guideline (C criteria) and raised fundamental concerns.
>>> FEATURED STOCK ARTICLE : Met Resistance After Rebounding Near Prior High - 12/9/2019
 |  View all notes | Set NEW NOTE alert | Company Profile | SEC News | Chart | Request a new note C A  S  I 
StockCharts.com Latest Chart for LULU LULU - NASDAQ
Lululemon Athletica
MANUFACTURING - Textile Manufacturing  
$225.35 +1.80
0.81%

$227.32

2,741,886
138.27% of 50 DAV
50 DAV is 1,983,000
$235.50
-4.31%
9/6/2019 $201.25 PP = $194.35
MB = $204.07
Most Recent Note - 12/13/2019 12:29:57 PM
G - Down again today following a big loss on heavy volume on the prior session after it reported earnings +28% on +23% sales revenues for the Oct '19 quarter. Prior notes reminded members - "Volume and volatility often increase near earnings news. It is very extended from any sound base and quietly inching into new all-time high territory with recent gains lacking great volume conviction. Its 50 DMA line and prior high coincide in the $209 area defining important near-term support to watch."

>>> FEATURED STOCK ARTICLE : New High Close Stretches Already Extended Leader - 11/26/2019
 |  View all notes | Set NEW NOTE alert | Company Profile | SEC News | Chart | Request a new note C A  S  I 
StockCharts.com Latest Chart for CPRT CPRT - NASDAQ
Copart Inc
SPECIALTY RETAIL - Auto Dealerships  
$90.19 +1.57
1.77%

$90.49

2,906,589
179.75% of 50 DAV
50 DAV is 1,617,000
$92.41
-2.40%
9/5/2019 $79.13 PP = $79.84
MB = $83.83
Most Recent Note - 12/12/2019 6:01:29 PM
G - Consolidating after getting extended from any sound base. The 50 DMA line ($84.47) defines near-term support above the prior low ($80.71 on 11/06/19). Fundamentals remain strong. See the latest FSU analysis for more details and a new annotated graph.
>>> FEATURED STOCK ARTICLE : Extended From Prior Base and Hovering Near Record High - 12/12/2019
 |  View all notes | Set NEW NOTE alert | Company Profile | SEC News | Chart | Request a new note C A  S  I 
StockCharts.com Latest Chart for NMIH NMIH - NASDAQ
N M I Holdings Inc Cl A
Finance-MrtgandRel Svc  
$33.58 +0.34
1.02%

$33.98

335,659
76.63% of 50 DAV
50 DAV is 438,000
$34.50
-2.67%
11/8/2019 $32.89 PP = $31.44
MB = $33.01
Most Recent Note - 12/16/2019 5:13:25 PM
G - Stubbornly holding is ground perched within close striking distance of its all-time high. Prior highs in the $30-31 area coincide with its 50 DMA line defining important near-term support..
>>> FEATURED STOCK ARTICLE : Holding Ground Stubbornly Near All-Time High - 11/27/2019
 |  View all notes | Set NEW NOTE alert | Company Profile | SEC News | Chart | Request a new note C A  S  I 
StockCharts.com Latest Chart for SPLK SPLK - NASDAQ
Splunk Inc
Computer Sftwr-Database  
$146.31 +2.80
1.95%

$147.76

2,174,571
112.85% of 50 DAV
50 DAV is 1,927,000
$152.68
-4.17%
11/25/2019 $147.79 PP = $142.16
MB = $149.27
Most Recent Note - 12/16/2019 5:09:36 PM
Y - Still consolidating above its pivot point and below its "max buy" level. Prior highs in the $142-143 area define initial support to watch on pullbacks. See the latest FSU analysis for more details and a new annotated graph.
>>> FEATURED STOCK ARTICLE : Consolidating Above Prior Highs Following Impressive Rally - 12/16/2019
 |  View all notes | Set NEW NOTE alert | Company Profile | SEC News | Chart | Request a new note C A  S  I 
Symbol/Exchange
Company Name
Industry Group
PRICE CHANGE
(%Change)
Day High Volume
(% DAV)
(% 50 day avg vol)
52 Wk Hi
% From Hi
Featured
Date
Price
Featured
Pivot Featured
Max Buy
StockCharts.com Latest Chart for PAYC PAYC - NYSE
Paycom Software Inc
COMPUTER SOFTWARE and SERVICES - Application Software  
$259.48 +2.49
0.97%

$262.13

445,612
79.29% of 50 DAV
50 DAV is 562,000
$279.95
-7.31%
11/20/2019 $252.97 PP = $259.81
MB = $272.80
Most Recent Note - 12/11/2019 6:00:00 PM
Y - Consolidating above its pivot point and below its "max buy" level. Prior high ($259) defines initial support to watch on pullbacks. Fundamentals remain strong. See the latest FSU analysis for more details and a new annotated graph.
>>> FEATURED STOCK ARTICLE : Consolidating Near Prior Highs Which Define Initial Support - 12/11/2019
 |  View all notes | Set NEW NOTE alert | Company Profile | SEC News | Chart | Request a new note C A  S  I 
StockCharts.com Latest Chart for BLD BLD - NYSE
Topbuild Corp
Bldg-Constr Prds/Misc  
$105.23 -0.72
-0.68%

$107.36

347,146
130.02% of 50 DAV
50 DAV is 267,000
$113.74
-7.48%
12/9/2019 $109.71 PP = $113.84
MB = $119.53
Most Recent Note - 12/13/2019 5:24:58 PM
Y - Found support at its 50 DMA line ($104.82) today following a volume-driven loss. Color code was changed to yellow after a tight consolidation, with new pivot point cited based on its 11/27/19 high plus 10 cents. Subsequent gains for new highs back by at least +40% above average volume are needed to trigger a new (or add-on) technical buy signal. Reported earnings +24% on +5% sales revenues for the Sep '19 quarter versus the year ago period, just below the +25% minimum guideline (C criteria). Its 50 DMA line has acted as support during its ongoing ascent.
>>> FEATURED STOCK ARTICLE : Consolidating After Getting Extended From Any Sound Base - 12/3/2019
 |  View all notes | Set NEW NOTE alert | Company Profile | SEC News | Chart | Request a new note C A  S  I 
StockCharts.com Latest Chart for GLOB GLOB - NYSE
Globant SA
Computer-Tech Services  
$103.59 -1.38
-1.31%

$105.98

167,479
62.96% of 50 DAV
50 DAV is 266,000
$112.33
-7.78%
11/14/2019 $106.87 PP = $112.43
MB = $118.05
Most Recent Note - 12/12/2019 6:08:40 PM
G - Posted a solid gain today with volume slightly above average. Disciplined investors will watch for noted improvement and subsequent volume-driven gains for new highs which are still needed to trigger a technical buy signal. Found support near its 50 DMA line ($98.49) after volume-driven losses. Prior lows and its 200 DMA line define the next important support to watch. Fundamentals remain strong.
>>> FEATURED STOCK ARTICLE : Found Support at 50-Day Average During Choppy Consolidation - 12/5/2019
 |  View all notes | Set NEW NOTE alert | Company Profile | SEC News | Chart | Request a new note C A  S  I 

THESE ARE NOT BUY RECOMMENDATIONS!  Comments contained in the body of this report are technical opinions only. The material herein has been obtained from sources believed to be reliable and accurate, however, its accuracy and completeness cannot be guaranteed. This site is not an investment advisor, hence it does not endorse or recommend any securities or other investments. Any recommendation contained in this report may not be suitable for all investors and it is not to be deemed an offer or solicitation on our part with respect to the purchase or sale of any securities. All trademarks, service marks and trade names appearing in this report are the property of their respective owners, and are likewise used for identification purposes only.

This report is a service available only to active Paid Premium Members. You may opt-out of receiving report notifications at any time.  Questions or comments may be submitted by writing to Premium Membership Services 665 S.E. 10 Street, Suite 201 Deerfield Beach, FL 33441-5634 or by calling 1-800-965-8307 or 954-785-1121.

Kenneth J. Gruneisen founded Gruneisen Growth Corp. (2003), which prior to May 11, 2015, operated CANSLIM.net and CANSLIM.com both under license from Data Analysis Inc. / Investor's Business Daily. Kenneth has passed the CAN SLIM® Master's Exam. Gruneisen Growth Corp. now continues over two decades of fact based market analysis via FactBasedInvesting.com.

Copyright © 1996-2024 Gruneisen Growth Corp. All rights reserved. Protected by the copyright laws of the United States and Canada and by international treaties

Privacy Policy | Terms of Use | Contact Us