You are not logged in.
This means you
CAN ONLY VIEW reports that were published prior to Friday, February 23, 2024.
You
MUST UPGRADE YOUR MEMBERSHIP if you want to see any current reports.
AFTER MARKET UPDATE - FRIDAY, DECEMBER 14TH, 2018
Previous After Market Report Next After Market Report >>>
|
|
|
|
DOW |
-496.87 |
24,100.51 |
-2.02% |
|
Volume |
983,895,380 |
+8% |
|
Volume |
2,197,629,010 |
+3% |
|
NASDAQ |
-159.67 |
6,910.66 |
-2.26% |
|
Advancers |
670 |
22% |
|
Advancers |
734 |
24% |
|
S&P 500 |
-50.59 |
2,599.95 |
-1.91% |
|
Decliners |
2,325 |
78% |
|
Decliners |
2,337 |
76% |
|
Russell 2000 |
-21.89 |
1,410.81 |
-1.53% |
|
52 Wk Highs |
16 |
|
|
52 Wk Highs |
12 |
|
|
S&P 600 |
-14.00 |
878.11 |
-1.57% |
|
52 Wk Lows |
617 |
|
|
52 Wk Lows |
519 |
|
|
 |
Major Indices Show Decisively Weak Action
Kenneth J. Gruneisen - Passed the CAN SLIM® Master's Exam
For the week, the Dow slipped 1.2% while the S&P 500 and Nasdaq declined 1.3% and 0.8% respectively. Stocks finished firmly lower Friday. The Dow fell 496 points to 24,100, its lowest level since May, while the S&P 500 slipped 50 points to 2,599. The Nasdaq retreated 105 points 6,964. The volume totals on the session were slightly higher than the prior session totals on the NYSE and on the Nasdaq exchange. Breadth was negative as decliners led advancers by more than a 3-1 margin on the NYSE and on the Nasdaq exchange. Leadership further evaporated as there were only 2 high-ranked companies from the Leaders List that made new 52-week highs and were listed on the BreakOuts Page, versus 3 on the prior session. New 52-week lows totals expanded and solidly outnumbered shrinking new 52-week highs totals on the NYSE and on the Nasdaq exchange. As noted in prior commentaries, the weight of the evidence suggests that the major indices (M criteria) are in a correction. Disciplined investors protect capital in bad markets and wait for a new rally and solid follow-through day to eventually shift the market direction (M criteria) to a bullish stance. The Featured Stocks Page provides the most timely analysis on high-ranked leaders. Charts used courtesy of www.stockcharts.com
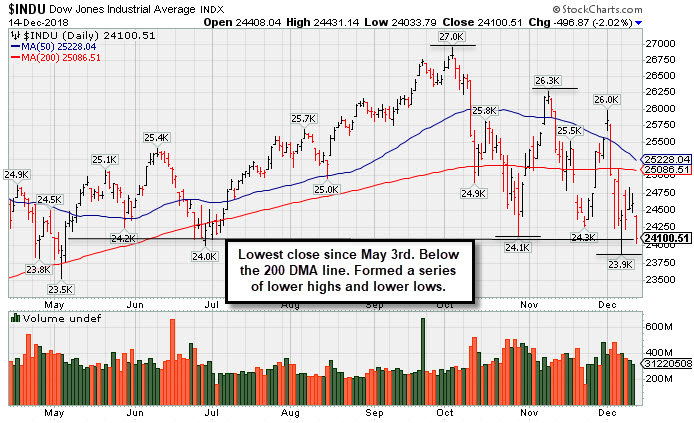
PICTURED: The Dow Jones Industrial Average fell to its lowest close since May 3rd. It is lingering below its 200-day moving average (DMA) line and has formed a bearish series of lower highs and lower lows.
The major averages suffered a sharp decline as fears of a slowdown in global economic growth overcame generally positive domestic economic updates. Investors took a perceived “risk-off” tone after a series of disappointing economic updates out of China and the European Union. On the U.S. data front, retail sales climbed 0.2% in November, besting expectations of a 0.1% increase. Industrial production increased 0.6% in November, topping projections of a 0.3% gain.
All 11 S&P 500 sectors finished lower with Health Care shares the notable decliner. Shares of Johnson & Johnson (JNJ -10.0%) tumbled and erased roughly $45 billion in market-cap following news the company was aware its baby powder contained trace amounts of asbestos. Tech stocks were also broadly lower as Apple (AAPL -3.2%) and Microsoft (MSFT -3.1%) fell. In earnings news, Costco (COST -8.6%) fell after the company missed same store sales figures and profit estimates.
Treasuries strengthened along the curve as the yield on the 10-year fell two basis points to 2.89%. In commodities, WTI crude declined 2.9% to $51.08/barrel. COMEX gold was off 0.5% to $1,237.00/ounce amid a stronger dollar.
|
 Kenneth J. Gruneisen started out as a licensed stockbroker in August 1987, a couple of months prior to the historic stock market crash that took the Dow Jones Industrial Average down -22.6% in a single day. He has published daily fact-based fundamental and technical analysis on high-ranked stocks online for two decades. Through FACTBASEDINVESTING.COM, Kenneth provides educational articles, news, market commentary, and other information regarding proven investment systems that work in good times and bad.
Comments contained in the body of this report are technical opinions only and are not necessarily those of Gruneisen Growth Corp. The material herein has been obtained from sources believed to be reliable and accurate, however, its accuracy and completeness cannot be guaranteed. Our firm, employees, and customers may effect transactions, including transactions contrary to any recommendation herein, or have positions in the securities mentioned herein or options with respect thereto. Any recommendation contained in this report may not be suitable for all investors and it is not to be deemed an offer or solicitation on our part with respect to the purchase or sale of any securities. |
|
 |
Retail, Financial, Tech, and Commodity-Linked Groups Fell
Kenneth J. Gruneisen - Passed the CAN SLIM® Master's Exam
The Retail Index ($RLX -2.44%) suffered a big loss while the Broker/Dealer Index ($XBD -1.40%) and the Bank Index ($BKX -1.03%) also weighed on the major indices. The tech sector had a negative bias as the Biotech Index ($BTK -1.61%), Semiconductor Index ($SOX -1.43%), and the Networking Index ($NWX -1.58%) were unanimously lower. The Oil Services Index ($OSX -4.28%) was a standout decliner while the Integrated Oil Index ($XOI -2.28%) and the Gold & Silver Index ($XAU -1.69%) also fell.
Charts courtesy of www.stockcharts.com
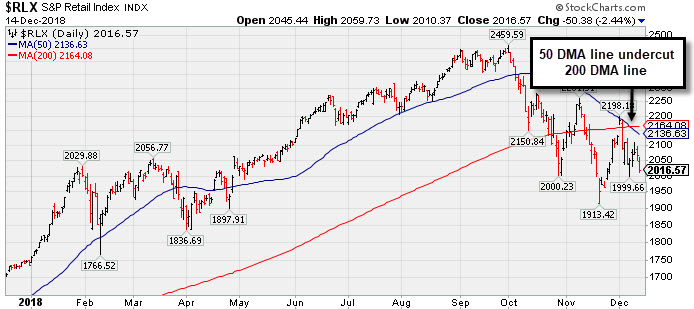 PICTURED: The Retail Index ($RLX -2.44%) has formed a series of lower highs and lower lows. Its 50-day moving average (DMA) line recently undercut its 200 DMA line, a bearish technical signal termed a "death cross". November lows define important near term support.
| Oil Services |
$OSX |
89.24 |
-3.99 |
-4.28% |
-40.33% |
| Integrated Oil |
$XOI |
1,236.05 |
-28.78 |
-2.28% |
-7.45% |
| Semiconductor |
$SOX |
1,177.57 |
-17.02 |
-1.42% |
-6.02% |
| Networking |
$NWX |
505.75 |
-8.12 |
-1.58% |
+3.10% |
| Broker/Dealer |
$XBD |
240.36 |
-3.40 |
-1.40% |
-9.38% |
| Retail |
$RLX |
2,016.57 |
-50.38 |
-2.44% |
+16.31% |
| Gold & Silver |
$XAU |
67.59 |
-1.16 |
-1.69% |
-20.73% |
| Bank |
$BKX |
88.10 |
-0.92 |
-1.03% |
-17.44% |
| Biotech |
$BTK |
4,425.05 |
-72.37 |
-1.61% |
+4.80% |
|
|
|
 |
Fitness Firm Remains Near High Despite Unhealthy Environment
Kenneth J. Gruneisen - Passed the CAN SLIM® Master's Exam
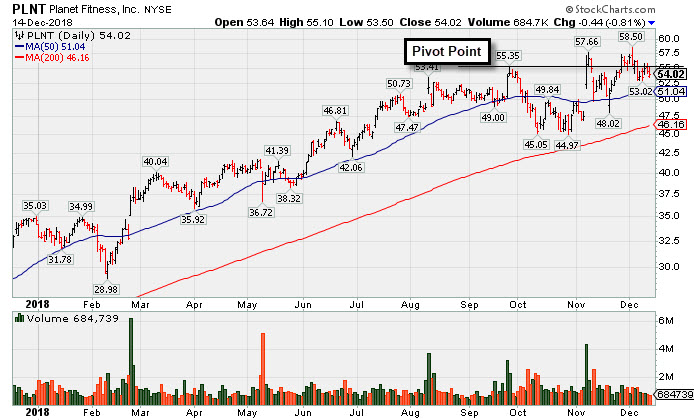
Planet Fitness Inc Cl A (PLNT -$0.44 or -0.81% to $54.02) is still perched near its all-time high, showing strength and resilience in an unhealthy market environment. Its 50-day moving average (DMA) line and recent low ($48.02 on 11/20/18) define important near-term support to watch on pullbacks.
PLNT was highlighted in yellow with pivot point cited based on its 9/26/18 high plus 10 cents in the 11/07/18 mid-day report (read here). It was last shown in this FSU section on 11/29/18 with an annotated graph under the headline, "Fitness Firm Perched Near All-Time High".
Bullish action came after it reported earnings +47% on +40% sales revenues for the Sep '18 quarter, marking a 3rd consecutive quarterly earnings comparison above the +25% minimum guideline (C criteria). Recent comparisons showed impressive sales revenues acceleration. Annual earnings (A criteria) history included a small downturn in FY '15 but has been strong since. Completed its Aug 2015 IPO at $14.06 and completed Secondary Offerings on 6/22/16, 9/26/16, 3/10/17 and 5/08/17.
The number of top-rated funds owning its shares rose from 373 in Dec '17 to 497 in Sep '18, a reassuring sign concerning the I criteria. The current Up/Down Volume Ratio of 1.2 is an unbiased indication its shares have been under accumulation over the past 50 days. It has earned a Timeliness Rating of A and Sponsorship Rating of B. Its small supply of 80.2 million shares in the public float can contribute to greater price volatility in the event of institutional buying or selling.
Charts courtesy of www.stockcharts.com
 |
|
|
Color Codes Explained :
Y - Better candidates highlighted by our
staff of experts.
G - Previously featured
in past reports as yellow but may no longer be buyable under the
guidelines.
***Last / Change / Volume data in this table is the closing quote data***
Symbol/Exchange
Company Name
Industry Group |
PRICE |
CHANGE
(%Change) |
Day High |
Volume
(% DAV)
(% 50 day avg vol) |
52 Wk Hi
% From Hi |
Featured
Date |
Price
Featured |
Pivot Featured |
|
Max Buy |
MLR
-
NYSE
Miller Industries Inc
AUTOMOTIVE - Auto Parts
|
$27.11
|
-0.24
-0.88% |
$27.69
|
23,348
77.83% of 50 DAV
50 DAV is 30,000
|
$29.40
-7.79%
|
11/30/2018
|
$28.35
|
PP = $29.50
|
|
MB = $30.98
|
 Most Recent Note - 12/14/2018 5:19:43 PM
Y - Sputtering since highlighted in yellow with pivot point cited based on its 8/10/18 high plus 10 cents in the 11/30/18 mid-day report. Resistance remains due to overhead supply up to the $29 level. Subsequent gains above the pivot point backed by at least +40% above average volume are needed to trigger a technical buy signal. Reported earnings +95% on +28% sales revenues for the Sep '18 quarter. Recent quarterly comparisons have been above the +25% minimum earnings guideline (C criteria) and, sequentially, showed encouraging sales revenues acceleration. Annual earnings history (A criteria) has also been good. Very small supply of only 11.4 million shares outstanding (A criteria) can contribute to greater price volatility in the event of institutional buying or selling.
>>> FEATURED STOCK ARTICLE : Perched Within Striking Distance of All Time High - 12/3/2018 |
View all notes |
Set NEW NOTE alert |
Company Profile |
SEC
News |
Chart |
Request a new note
C
A
S
I |
ZBRA
-
NASDAQ
Zebra Tech Corp Cl A
COMPUTER HARDWARE - Computer Peripherals
|
$171.89
|
-0.90
-0.52% |
$173.11
|
396,878
83.91% of 50 DAV
50 DAV is 473,000
|
$184.75
-6.96%
|
11/6/2018
|
$170.41
|
PP = $179.57
|
|
MB = $188.55
|
Most Recent Note - 12/12/2018 5:34:13 PM
Y - Consolidating above its 50 DMA line ($168.53) after 3 consecutive gains on light volume and its color code is changed to yellow. The prior lows and 200 DMA line ($155) define important near-term support to watch.
>>> FEATURED STOCK ARTICLE : Challenging High After Rebound Above 50-day Average - 11/28/2018 |
View all notes |
Set NEW NOTE alert |
Company Profile |
SEC
News |
Chart |
Request a new note
C
A
S
I |
CME
-
NASDAQ
C M E Group Inc
DIVERSIFIED SERVICES - Business/Management Services
|
$187.64
|
-0.30
-0.16% |
$188.37
|
1,605,892
71.63% of 50 DAV
50 DAV is 2,242,000
|
$197.08
-4.79%
|
10/4/2018
|
$179.29
|
PP = $177.45
|
|
MB = $186.32
|
Most Recent Note - 12/12/2018 5:29:58 PM
G - Still perched near its all-time high, consolidating above its 50 DMA line ($184.90) and recent low ($183.43 on 12/06/18) defining important near-term support. Recently reported earnings +22% on +2% sales revenues for the Sep '18 quarter, below the +25% minimum earnings guideline (C criteria), raising fundamental concerns. See the latest FSU analysis for more details and a new annotated graph.
>>> FEATURED STOCK ARTICLE : Consolidating Above 50-Day Moving Average - 12/12/2018 |
View all notes |
Set NEW NOTE alert |
Company Profile |
SEC
News |
Chart |
Request a new note
C
A
S
I |
GDOT
-
NYSE
Green Dot Corp Cl A
FINANCIAL SERVICES - Credit Services
|
$81.00
|
-0.25
-0.31% |
$81.74
|
486,880
97.18% of 50 DAV
50 DAV is 501,000
|
$93.00
-12.90%
|
11/8/2018
|
$90.35
|
PP = $91.61
|
|
MB = $96.19
|
Most Recent Note - 12/12/2018 12:34:27 PM
G - Rebounded above its 50 DMA line, however it faces resistance due to overhead supply up to the $93 level. Its 200 DMA line and prior low ($71.50 on 10/29/18) define important near-term support.
>>> FEATURED STOCK ARTICLE : Recently Found Support Near 200-Day Average - 12/7/2018 |
View all notes |
Set NEW NOTE alert |
Company Profile |
SEC
News |
Chart |
Request a new note
C
A
S
I |
UBNT
-
NASDAQ
Ubiquiti Networks
TELECOMMUNICATIONS - Diversified Communication Serv
|
$108.64
|
-1.82
-1.65% |
$111.63
|
288,256
59.93% of 50 DAV
50 DAV is 481,000
|
$115.44
-5.89%
|
11/9/2018
|
$108.20
|
PP = $101.43
|
|
MB = $106.50
|
Most Recent Note - 12/12/2018 5:32:32 PM
G - Posted a gain today with higher (near average) volume for a best-ever close. Prior high ($101.33 on 9/25/18) defines initial support to watch on pullbacks.
>>> FEATURED STOCK ARTICLE : Volume Totals Cooling While Still Hovering Above "Max Buy" Level - 12/11/2018 |
View all notes |
Set NEW NOTE alert |
Company Profile |
SEC
News |
Chart |
Request a new note
C
A
S
I |
Symbol/Exchange
Company Name
Industry Group |
PRICE |
CHANGE
(%Change) |
Day High |
Volume
(% DAV)
(% 50 day avg vol) |
52 Wk Hi
% From Hi |
Featured
Date |
Price
Featured |
Pivot Featured |
|
Max Buy |
PRAH
-
NASDAQ
P R A Health Sciences
HEALTH SERVICES - Medical Laboratories and Researc
|
$99.72
|
-3.79
-3.66% |
$103.80
|
642,118
123.01% of 50 DAV
50 DAV is 522,000
|
$121.98
-18.25%
|
11/30/2018
|
$117.06
|
PP = $112.98
|
|
MB = $118.63
|
Most Recent Note - 12/12/2018 5:36:26 PM
G - Found support recently at its 50 DMA line ($102.93). Undercut its pivot point after a noted "negative reversal".
>>> FEATURED STOCK ARTICLE : Streak of Gains For New Highs Marked by Increasing Volume - 11/30/2018 |
View all notes |
Set NEW NOTE alert |
Company Profile |
SEC
News |
Chart |
Request a new note
C
A
S
I |
PLNT
-
NYSE
Planet Fitness Inc Cl A
Leisure-Services
|
$54.02
|
-0.44
-0.81% |
$55.10
|
684,739
54.13% of 50 DAV
50 DAV is 1,265,000
|
$58.50
-7.66%
|
11/7/2018
|
$57.10
|
PP = $55.45
|
|
MB = $58.22
|
Most Recent Note - 12/14/2018 5:18:37 PM
Y - Remains perched near its all-time high with volume totals cooling. Its 50 DMA line and recent low ($48.02 on 11/20/18) define important near-term support to watch on pullbacks. See the latest FSU analysis for more details and a new annotated graph.
>>> FEATURED STOCK ARTICLE : Fitness Firm Remains Near High Despite Unhealthy Environment - 12/14/2018 |
View all notes |
Set NEW NOTE alert |
Company Profile |
SEC
News |
Chart |
Request a new note
C
A
S
I |
MEDP
-
NASDAQ
Medpace Holdings Inc
Medical-Research Eqp/Svc
|
$53.41
|
-2.25
-4.04% |
$55.59
|
464,769
85.12% of 50 DAV
50 DAV is 546,000
|
$65.09
-17.95%
|
12/3/2018
|
$63.43
|
PP = $65.19
|
|
MB = $68.45
|
Most Recent Note - 12/13/2018 5:00:26 PM
Y - Slumped near its 50 DMA line ($55.45) today, and more damaging losses would raise greater concerns. Sputtering since highlighted in yellow with pivot point cited based on its 9/17/18 high plus 10 cents in the 12/03/18 mid-day report. Subsequent gains above the pivot point backed by a least +40% above average volume may trigger a technical buy signal. Reported earnings +68% on +62% sales revenues for the Sep '18 quarter marking the 3rd consecutive comparison above the +25% minimum earnings guideline (C criteria).
>>> FEATURED STOCK ARTICLE : Pullback After 9 Straight Gains Challenged High - 12/4/2018 |
View all notes |
Set NEW NOTE alert |
Company Profile |
SEC
News |
Chart |
Request a new note
C
A
S
I |
INVA
-
NASDAQ
Innoviva Inc
Medical-Biomed/Biotech
|
$16.81
|
-0.41
-2.38% |
$17.35
|
993,245
85.04% of 50 DAV
50 DAV is 1,168,000
|
$18.60
-9.62%
|
11/23/2018
|
$17.74
|
PP = $18.09
|
|
MB = $18.99
|
Most Recent Note - 12/13/2018 4:57:58 PM
Y - Volume totals have been cooling while perched near its all-time high. Subsequent gains and a strong close above the pivot point backed by at least +40% above average volume may clinch a technical buy signal. See the latest FSU analysis for more details and a new annotated graph.
>>> FEATURED STOCK ARTICLE : Perched Near High With Volume Totals Cooling - 12/13/2018 |
View all notes |
Set NEW NOTE alert |
Company Profile |
SEC
News |
Chart |
Request a new note
C
A
S
I |
|
|
|
THESE ARE NOT BUY RECOMMENDATIONS!
Comments contained in the body of this report are technical
opinions only. The material herein has been obtained
from sources believed to be reliable and accurate, however,
its accuracy and completeness cannot be guaranteed.
This site is not an investment advisor, hence it does
not endorse or recommend any securities or other investments.
Any recommendation contained in this report may not
be suitable for all investors and it is not to be deemed
an offer or solicitation on our part with respect to
the purchase or sale of any securities. All trademarks,
service marks and trade names appearing in this report
are the property of their respective owners, and are
likewise used for identification purposes only.
This report is a service available
only to active Paid Premium Members.
You may opt-out of receiving report notifications
at any time. Questions or comments may be submitted
by writing to Premium Membership Services 665 S.E. 10 Street, Suite 201 Deerfield Beach, FL 33441-5634 or by calling 1-800-965-8307
or 954-785-1121.
|
|
|

