Help Lines 954-785-1121


You are not logged in. Upgrade Here
 <<<Previous Mid Day Report     Next Mid Day Report >>> 
 <<<Previous After Market Report Next After Market Report >>> 
You are not logged in.
This means you CAN ONLY VIEW reports that were published prior to Sunday, February 25, 2024.
You MUST UPGRADE YOUR MEMBERSHIP if you want to see any current reports.

AFTER MARKET UPDATE - FRIDAY, DECEMBER 13TH, 2019
Previous After Market Report Next After Market Report >>>
Indices NYSE Nasdaq
DOW  +3.33 28,135.38 +0.01% Volume 844,464,360 -5% Volume 2,187,105,650 -8%
NASDAQ +17.56 8,734.88 +0.20% Advancers 1,489 52% Advancers 1,556 49%
S&P 500 +0.23 3,168.80 +0.01% Decliners 1,358 48% Decliners 1,590 51%
Russell 2000 -6.84 1,637.98 -0.42% 52 Wk Highs 181   52 Wk Highs 255  
S&P 600 -6.80 1,002.79 -0.67% 52 Wk Lows 18   52 Wk Lows 57  

Major Indices Inched Further Into New Record High Territory

For the week, the Dow gained 0.4%, the S&P advanced 0.7%, and the Nasdaq Composite rallied 0.9%. On Friday the Dow added 3 points while the S&P 500 ticked up less than 0.1% and the Nasdaq Composite ended the day higher by 0.2%. Advancers led decliners by a narrow margin on the NYSE, meanwhile, decliners barely outnumbered advancers on the Nasdaq exchange. The volume totals were lighter than the prior session on the NYSE and on the Nasdaq exchange. There were 83 high-ranked companies from the Leaders List that hit a new 52-week high and were listed on the BreakOuts Page, versus the total of 107 on the prior session. New 52-week highs totals easily outnumbered new 52-week lows totals on the NYSE and on the Nasdaq exchange. The major indices (M criteria) are in a "confirmed uptrend" after enduring distributional pressure in recent weeks. The Featured Stocks Page provides the most timely analysis on high-ranked leaders.

Charts used courtesy of www.stockcharts.com

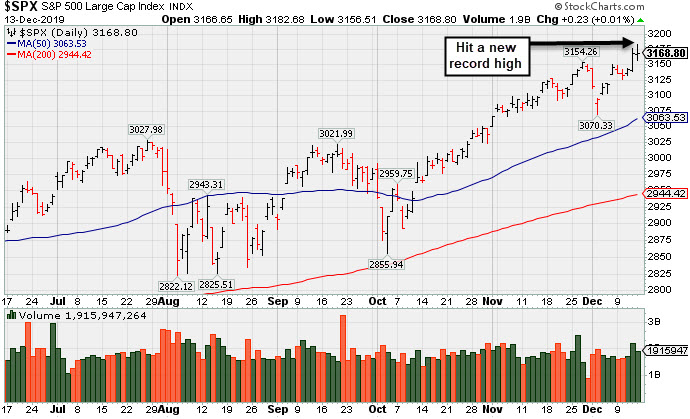
PICTURED: The S&P 500 Index hit a new record high. It recently found support above prior highs and above its 50-day moving average (DMA) line.

Stocks finished slightly higher Friday as investors digested confirmation of a long-awaited “phase one” U.S.-China trade deal. The Dow initially jumped more than 100 points after Washington and Beijing agreed to a preliminary trade deal, averting the upcoming December 15 tariffs. Risk sentiment was dampened after President Trump said the U.S. would leave 25% tariffs in place on $250 billion of Chinese imports, and rollback duties on just $120 billion worth of goods. Market participants also kept tabs on political updates from across the pond. European bourses ended higher after U.K. Prime Minister Boris Johnson’s Conservative party secured a landslide election victory, helping ease fears of prolonged Brexit negotiations.

Five of 11 S&P 500 sectors finished in positive territory with Technology shares pacing gains. Adobe (ADBE +3.92%) rose after the software company topped analyst expectations on both the top and bottom line. In other earnings, Costco (COST -1.84%) fell after the club warehouse retailer fell short of revenue estimates.

On the data front, retail sales climbed 0.2% in November, below expectations of a 0.5% gain and the prior month’s upwardly revised 0.4% figure. Treasuries rebounded, sending yields lower along the curve with the yield on the 10-year note down seven basis points to 1.82%. In commodities, WTI crude added 1.0% to $59.81/barrel.

Kenneth J. Gruneisen started out as a licensed stockbroker in August 1987, a couple of months prior to the historic stock market crash that took the Dow Jones Industrial Average down -22.6% in a single day. He has published daily fact-based fundamental and technical analysis on high-ranked stocks online for two decades. Through FACTBASEDINVESTING.COM, Kenneth provides educational articles, news, market commentary, and other information regarding proven investment systems that work in good times and bad.

Comments contained in the body of this report are technical opinions only and are not necessarily those of Gruneisen Growth Corp. The material herein has been obtained from sources believed to be reliable and accurate, however, its accuracy and completeness cannot be guaranteed. Our firm, employees, and customers may effect transactions, including transactions contrary to any recommendation herein, or have positions in the securities mentioned herein or options with respect thereto. Any recommendation contained in this report may not be suitable for all investors and it is not to be deemed an offer or solicitation on our part with respect to the purchase or sale of any securities.


Gold & Silver and Biotech Indexes Led Group Gainers

The Bank Index ($BKX -0.98%) and Broker/Dealer Index ($XBD -0.60%) both lost ground while thRetail Index ($RLX +0.06%) finished flat. The tech sector was mixed as the Semiconductor Index ($SOX -0.60%) and Networking Index ($NWX -0.98%) both slumped while the Biotech Index ($BTK +0.65%) eked out a modest gain. The Oil Services Index ($OSX -0.70%) and the Integrated Oil Index ($XOI -0.85%) both lost ground, meanwhile, the Gold & Silver Index ($XAU +0.85%) notched a solid gain.
Charts courtesy of www.stockcharts.com

PICTURED: The Retail Index ($RLX +0.06%) found support at its 200-day moving average (DMA) line during its consolidation in recent months. It is perched only -4.6% off its record high hit in July.

Industry Index Symbol Close Change % Change YTD % Change
Oil Services $OSX  74.15 -0.52 -0.70% -8.00%
Integrated Oil $XOI  1,222.39 -10.50 -0.85% +5.46%
Semiconductor $SOX  1,796.04 -10.83 -0.60% +55.48%
Networking $NWX  571.27 -5.64 -0.98% +16.90%
Broker/Dealer $XBD  290.59 -1.75 -0.60% +22.44%
Retail $RLX  2,380.91 +1.48 +0.06% +22.01%
Gold & Silver $XAU  100.28 +0.85 +0.85% +41.92%
Bank $BKX  112.64 -1.11 -0.98% +31.30%
Biotech $BTK  5,091.71 +32.74 +0.65% +20.63%


Reversed Into Red After Hitting Yet Another New High

Audiocodes Ltd (AUDC -$0.43 or -1.71% to $24.69) reversed into the red after hitting another new all-time high, breaking a streak of 3 consecutive gains backed by below average volume. It is extended from the previously noted base. Prior highs in the $22 area define initial support above its 50-day moving average (DMA) line ($21.34). Fundamentals remain strong.

Bullish action came after it reported earnings +26% on +15% sales revenues for the Sep '19 quarter, continuing its strong earnings track record for a 11th consecutive quarterly comparison above the +25% minimum guideline (C criteria). Annual earnings growth has been strong and it has a 99 Earnings Per Share Rating.

This Israel-based designer of advanced voice-over-IP products was last shown in this FSU section on 11/22/19 with an annotated graph under the headline, "Volume Totals Cooling After Gains for New Highs". The number of top-rated funds owning its shares rose from 33 in Mar '18 to 82 in Sep '19, a reassuring sign concerning the I criteria. Its current Up/Down Volume Ratio of 2.3 is an unbiased indication its shares have been under accumulation over the past 50 days. It has a Timeliness Rating of A and Sponsorship Rating of B. The small supply of 22.8 million shares (S criteria) in the public float can contribute to greater price volatility in the event of institutional buying or selling.

Charts courtesy of www.stockcharts.com


Color Codes Explained :
Y - Better candidates highlighted by our staff of experts.
G - Previously featured in past reports as yellow but may no longer be buyable under the guidelines.

***Last / Change / Volume data in this table is the closing quote data***
Symbol/Exchange
Company Name
Industry Group
PRICE CHANGE
(%Change)
Day High Volume
(% DAV)
(% 50 day avg vol)
52 Wk Hi
% From Hi
Featured
Date
Price
Featured
Pivot Featured
Max Buy
StockCharts.com Latest Chart for MLR MLR - NYSE
Miller Industries Inc
AUTOMOTIVE - Auto Parts  
$36.50 -0.55
-1.48%

$36.97

25,817
56.12% of 50 DAV
50 DAV is 46,000
$37.70
-3.18%
9/24/2019 $34.00 PP = $35.36
MB = $37.13
Most Recent Note - 12/10/2019 5:48:45 PM
Y - Showing resilience after recently reporting earnings which were below the fundamental guidelines of the fact-based investment system. Remains perched near its 52-week high. Prior highs in the $35 area define initial support above its 50 DMA line ($34.59).
>>> FEATURED STOCK ARTICLE : Miller Still Quietly Hovering Above Prior Highs - 12/4/2019
 |  View all notes | Set NEW NOTE alert | Company Profile | SEC News | Chart | Request a new note C A  S  I 
StockCharts.com Latest Chart for CCBG CCBG - NASDAQ
Capital City Bk Gp
BANKING - Regional - Mid-Atlantic Banks  
$29.80 +0.20
0.68%

$29.95

26,613
68.24% of 50 DAV
50 DAV is 39,000
$30.85
-3.40%
9/13/2019 $27.03 PP = $27.05
MB = $28.40
Most Recent Note - 12/12/2019 6:07:01 PM
G - Closed at the session high with a big gain today backed by above average volume. Recently found support at its 50 DMA line ($28.56). Prior highs define the next important support to watch. More damaging losses would raise concerns and trigger a technical sell signal.
>>> FEATURED STOCK ARTICLE : Found Support at 50-Day Moving Average - 12/10/2019
 |  View all notes | Set NEW NOTE alert | Company Profile | SEC News | Chart | Request a new note C A  S  I 
StockCharts.com Latest Chart for FTNT FTNT - NASDAQ
Fortinet Inc
Computer Sftwr-Security  
$105.64 +1.24
1.19%

$106.65

1,070,722
79.02% of 50 DAV
50 DAV is 1,355,000
$106.00
-0.34%
12/9/2019 $103.85 PP = $106.10
MB = $111.41
Most Recent Note - 12/13/2019 5:27:55 PM
Y - Touched a new high as it posted a gain today with below average volume. Color code was changed to yellow with new pivot point cited based on its 11/20/19 high plus 10 cents after forming an advanced 3-weeks tight base pattern. Volume totals have been cooling while still stubbornly holding its ground. Prior high in the $97 area defines initial support to watch on pullbacks.

>>> FEATURED STOCK ARTICLE : Extended From Prior Base Perched Near Record HIgh - 12/2/2019
 |  View all notes | Set NEW NOTE alert | Company Profile | SEC News | Chart | Request a new note C A  S  I 
StockCharts.com Latest Chart for SPSC SPSC - NASDAQ
S P S Commerce Inc
COMPUTER SOFTWARE and SERVICES - Application Software  
$56.18 +0.61
1.10%

$56.49

201,554
99.78% of 50 DAV
50 DAV is 202,000
$59.14
-5.01%
11/29/2019 $56.59 PP = $59.24
MB = $62.20
Most Recent Note - 12/10/2019 5:53:34 PM
Y - Endured distributional pressure in recent weeks near its all-time high. Subsequent gains above its pivot point backed by at least +40% above average volume are needed to trigger a new technical buy signal. Fundamentals remain strong.
>>> FEATURED STOCK ARTICLE : Rebound Leaves Supply Chain Management Software Firm Near High - 11/29/2019
 |  View all notes | Set NEW NOTE alert | Company Profile | SEC News | Chart | Request a new note C A  S  I 
StockCharts.com Latest Chart for AUDC AUDC - NASDAQ
Audiocodes Ltd
ELECTRONICS - Scientific and Technical Instrum  
$24.69 -0.43
-1.71%

$25.63

253,320
96.32% of 50 DAV
50 DAV is 263,000
$25.20
-2.02%
9/13/2019 $19.68 PP = $19.84
MB = $20.83
Most Recent Note - 12/13/2019 5:22:00 PM
G - There was a "negative reversal" today after hitting a new all-time high, breaking a streak of 3 consecutive gains. It is extended from the previously noted base, and prior highs in the $22 area define initial support above its 50 DMA line ($21.34). Fundamentals remain strong. See the latest FSU analysis for more details and a new annotated graph.
>>> FEATURED STOCK ARTICLE : Reversed Into Red After Hitting Yet Another New High - 12/13/2019
 |  View all notes | Set NEW NOTE alert | Company Profile | SEC News | Chart | Request a new note C A  S  I 
Symbol/Exchange
Company Name
Industry Group
PRICE CHANGE
(%Change)
Day High Volume
(% DAV)
(% 50 day avg vol)
52 Wk Hi
% From Hi
Featured
Date
Price
Featured
Pivot Featured
Max Buy
StockCharts.com Latest Chart for CHDN CHDN - NASDAQ
Churchill Downs Inc
LEISURE - Gaming Activities  
$135.45 +1.04
0.77%

$135.52

315,426
108.39% of 50 DAV
50 DAV is 291,000
$135.86
-0.30%
10/8/2019 $129.77 PP = $132.83
MB = $139.47
Most Recent Note - 12/13/2019 5:26:33 PM
G - Posted a gain today with near average volume for a best-ever close while challenging its 52-week high. Its 50 DMA line ($129.61) defines near-term support above the prior low ($121.81 on 11/07/19) The Jun and Sep '19 quarterly earnings versus the year ago periods were both below the +25% minimum guideline (C criteria) and raised fundamental concerns.
>>> FEATURED STOCK ARTICLE : Met Resistance After Rebounding Near Prior High - 12/9/2019
 |  View all notes | Set NEW NOTE alert | Company Profile | SEC News | Chart | Request a new note C A  S  I 
StockCharts.com Latest Chart for LULU LULU - NASDAQ
Lululemon Athletica
MANUFACTURING - Textile Manufacturing  
$223.55 -0.92
-0.41%

$225.50

5,196,851
272.66% of 50 DAV
50 DAV is 1,906,000
$235.50
-5.07%
9/6/2019 $201.25 PP = $194.35
MB = $204.07
Most Recent Note - 12/13/2019 12:29:57 PM
G - Down again today following a big loss on heavy volume on the prior session after it reported earnings +28% on +23% sales revenues for the Oct '19 quarter. Prior notes reminded members - "Volume and volatility often increase near earnings news. It is very extended from any sound base and quietly inching into new all-time high territory with recent gains lacking great volume conviction. Its 50 DMA line and prior high coincide in the $209 area defining important near-term support to watch."

>>> FEATURED STOCK ARTICLE : New High Close Stretches Already Extended Leader - 11/26/2019
 |  View all notes | Set NEW NOTE alert | Company Profile | SEC News | Chart | Request a new note C A  S  I 
StockCharts.com Latest Chart for CPRT CPRT - NASDAQ
Copart Inc
SPECIALTY RETAIL - Auto Dealerships  
$88.62 +0.14
0.16%

$88.98

1,091,708
65.06% of 50 DAV
50 DAV is 1,678,000
$92.41
-4.10%
9/5/2019 $79.13 PP = $79.84
MB = $83.83
Most Recent Note - 12/12/2019 6:01:29 PM
G - Consolidating after getting extended from any sound base. The 50 DMA line ($84.47) defines near-term support above the prior low ($80.71 on 11/06/19). Fundamentals remain strong. See the latest FSU analysis for more details and a new annotated graph.
>>> FEATURED STOCK ARTICLE : Extended From Prior Base and Hovering Near Record High - 12/12/2019
 |  View all notes | Set NEW NOTE alert | Company Profile | SEC News | Chart | Request a new note C A  S  I 
StockCharts.com Latest Chart for NMIH NMIH - NASDAQ
N M I Holdings Inc Cl A
Finance-MrtgandRel Svc  
$33.24 +0.05
0.15%

$33.46

448,339
103.07% of 50 DAV
50 DAV is 435,000
$34.50
-3.65%
11/8/2019 $32.89 PP = $31.44
MB = $33.01
Most Recent Note - 12/10/2019 5:51:13 PM
G - Perched within close striking distance of its all-time high. Prior highs in the $30-31 area coincide with its 50 DMA line ($30.53) defining important near-term support..
>>> FEATURED STOCK ARTICLE : Holding Ground Stubbornly Near All-Time High - 11/27/2019
 |  View all notes | Set NEW NOTE alert | Company Profile | SEC News | Chart | Request a new note C A  S  I 
StockCharts.com Latest Chart for SPLK SPLK - NASDAQ
Splunk Inc
Computer Sftwr-Database  
$143.51 -0.14
-0.10%

$144.75

2,345,829
123.21% of 50 DAV
50 DAV is 1,904,000
$152.68
-6.01%
11/25/2019 $147.79 PP = $142.16
MB = $149.27
Most Recent Note - 12/11/2019 6:01:25 PM
Y - Slumped today with higher volume, consolidating above its pivot point and below its "max buy" level. Prior highs in the $142-143 area define initial support to watch on pullbacks.
>>> FEATURED STOCK ARTICLE : Spurt of Volume-Driven Gains Reaches New All-Time High - 11/25/2019
 |  View all notes | Set NEW NOTE alert | Company Profile | SEC News | Chart | Request a new note C A  S  I 
Symbol/Exchange
Company Name
Industry Group
PRICE CHANGE
(%Change)
Day High Volume
(% DAV)
(% 50 day avg vol)
52 Wk Hi
% From Hi
Featured
Date
Price
Featured
Pivot Featured
Max Buy
StockCharts.com Latest Chart for PAYC PAYC - NYSE
Paycom Software Inc
COMPUTER SOFTWARE and SERVICES - Application Software  
$256.99 +2.51
0.99%

$259.30

364,611
64.31% of 50 DAV
50 DAV is 567,000
$279.95
-8.20%
11/20/2019 $252.97 PP = $259.81
MB = $272.80
Most Recent Note - 12/11/2019 6:00:00 PM
Y - Consolidating above its pivot point and below its "max buy" level. Prior high ($259) defines initial support to watch on pullbacks. Fundamentals remain strong. See the latest FSU analysis for more details and a new annotated graph.
>>> FEATURED STOCK ARTICLE : Consolidating Near Prior Highs Which Define Initial Support - 12/11/2019
 |  View all notes | Set NEW NOTE alert | Company Profile | SEC News | Chart | Request a new note C A  S  I 
StockCharts.com Latest Chart for BLD BLD - NYSE
Topbuild Corp
Bldg-Constr Prds/Misc  
$105.95 +0.85
0.81%

$106.77

267,564
100.21% of 50 DAV
50 DAV is 267,000
$113.74
-6.85%
12/9/2019 $109.71 PP = $113.84
MB = $119.53
Most Recent Note - 12/13/2019 5:24:58 PM
Y - Found support at its 50 DMA line ($104.82) today following a volume-driven loss. Color code was changed to yellow after a tight consolidation, with new pivot point cited based on its 11/27/19 high plus 10 cents. Subsequent gains for new highs back by at least +40% above average volume are needed to trigger a new (or add-on) technical buy signal. Reported earnings +24% on +5% sales revenues for the Sep '19 quarter versus the year ago period, just below the +25% minimum guideline (C criteria). Its 50 DMA line has acted as support during its ongoing ascent.
>>> FEATURED STOCK ARTICLE : Consolidating After Getting Extended From Any Sound Base - 12/3/2019
 |  View all notes | Set NEW NOTE alert | Company Profile | SEC News | Chart | Request a new note C A  S  I 
StockCharts.com Latest Chart for GLOB GLOB - NYSE
Globant SA
Computer-Tech Services  
$104.97 +0.73
0.70%

$105.43

169,565
63.04% of 50 DAV
50 DAV is 269,000
$112.33
-6.55%
11/14/2019 $106.87 PP = $112.43
MB = $118.05
Most Recent Note - 12/12/2019 6:08:40 PM
G - Posted a solid gain today with volume slightly above average. Disciplined investors will watch for noted improvement and subsequent volume-driven gains for new highs which are still needed to trigger a technical buy signal. Found support near its 50 DMA line ($98.49) after volume-driven losses. Prior lows and its 200 DMA line define the next important support to watch. Fundamentals remain strong.
>>> FEATURED STOCK ARTICLE : Found Support at 50-Day Average During Choppy Consolidation - 12/5/2019
 |  View all notes | Set NEW NOTE alert | Company Profile | SEC News | Chart | Request a new note C A  S  I 

THESE ARE NOT BUY RECOMMENDATIONS!  Comments contained in the body of this report are technical opinions only. The material herein has been obtained from sources believed to be reliable and accurate, however, its accuracy and completeness cannot be guaranteed. This site is not an investment advisor, hence it does not endorse or recommend any securities or other investments. Any recommendation contained in this report may not be suitable for all investors and it is not to be deemed an offer or solicitation on our part with respect to the purchase or sale of any securities. All trademarks, service marks and trade names appearing in this report are the property of their respective owners, and are likewise used for identification purposes only.

This report is a service available only to active Paid Premium Members. You may opt-out of receiving report notifications at any time.  Questions or comments may be submitted by writing to Premium Membership Services 665 S.E. 10 Street, Suite 201 Deerfield Beach, FL 33441-5634 or by calling 1-800-965-8307 or 954-785-1121.

Kenneth J. Gruneisen founded Gruneisen Growth Corp. (2003), which prior to May 11, 2015, operated CANSLIM.net and CANSLIM.com both under license from Data Analysis Inc. / Investor's Business Daily. Kenneth has passed the CAN SLIM® Master's Exam. Gruneisen Growth Corp. now continues over two decades of fact based market analysis via FactBasedInvesting.com.

Copyright © 1996-2024 Gruneisen Growth Corp. All rights reserved. Protected by the copyright laws of the United States and Canada and by international treaties

Privacy Policy | Terms of Use | Contact Us