You are not logged in.
This means you
CAN ONLY VIEW reports that were published prior to Friday, February 23, 2024.
You
MUST UPGRADE YOUR MEMBERSHIP if you want to see any current reports.
AFTER MARKET UPDATE - THURSDAY, DECEMBER 13TH, 2018
Previous After Market Report Next After Market Report >>>
|
|
|
|
DOW |
+70.11 |
24,597.38 |
+0.29% |
|
Volume |
913,305,620 |
-7% |
|
Volume |
2,134,786,846 |
-11% |
|
NASDAQ |
-27.98 |
7,070.33 |
-0.39% |
|
Advancers |
1,068 |
36% |
|
Advancers |
798 |
26% |
|
S&P 500 |
-0.53 |
2,650.54 |
-0.02% |
|
Decliners |
1,911 |
64% |
|
Decliners |
2,281 |
74% |
|
Russell 2000 |
-22.62 |
1,432.70 |
-1.55% |
|
52 Wk Highs |
25 |
|
|
52 Wk Highs |
16 |
|
|
S&P 600 |
-14.87 |
892.11 |
-1.64% |
|
52 Wk Lows |
379 |
|
|
52 Wk Lows |
352 |
|
|
 |
Leadership Thinned and Major Indices Ended Mixed
Kenneth J. Gruneisen - Passed the CAN SLIM® Master's Exam
Stocks finished mixed Thursday. The Dow added 70 points to 24597. The S&P 500 slipped less than a point to 2,650 while the Nasdaq Composite declined 27 points to 7070. The volume totals on the session were lighter than the prior session totals on the NYSE and on the Nasdaq exchange. Breadth was negative as decliners led advancers by almost a 2-1 margin on the NYSE and nearly 3-1 on the Nasdaq exchange. There were 3 high-ranked companies from the Leaders List that made new 52-week highs and were listed on the BreakOuts Page, versus 11 on the prior session. New 52-week lows totals expanded and solidly outnumbered shrinking new 52-week highs totals on the NYSE and on the Nasdaq exchange. The Nasdaq Composite Index is the only major average that has not undercut the recent (11/20/18) low, so the newspaper has still maintained an "uptrend under pressure" label. As noted in prior commentaries, the weight of the evidence suggests that the major indices (M criteria) are in a correction again after damaging losses violated the recent Day 1 lows. From this point forward any solid follow-through day can shift the market direction (M criteria) to a more bullish stance. The Featured Stocks Page provides the most timely analysis on high-ranked leaders. Strict buying and selling rules should always be followed on a case by case basis. Charts used courtesy of www.stockcharts.com
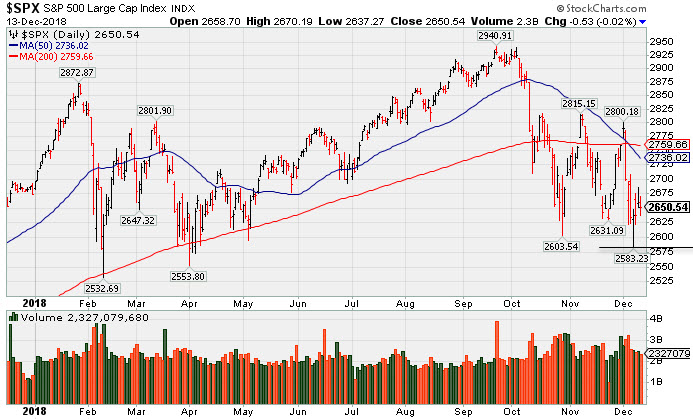
PICTURED: The S&P 500 Index ended quietly lower on Thursday, what may be consider Day 4 of a new rally attempt since the prior low was undercut. It met prompt resistance and tumbled after a rebound above its 50-day moving average (DMA) line.
The major averages struggled for direction and finished little changed as investors await further trade updates. Overnight, Reuters reported that Chinese state-owned companies made their first “major purchase” of U.S. soybeans since President Trump and President Xi agreed to a “trade truce” in early December. On the data front, separate surveys showed import prices declined the most since late 2015 during November, while export prices fell more than expected in the same time period. A separate report showed initial jobless eased in the most recent week and are near a 49-year low.
Six of 11 S&P 500 sectors finished higher with Utilities and Consumer Staples the notable outperformers. Financials underperformed as the flattening yield curve pressured bank stocks. Elsewhere, broad weakness in the Consumer Discretionary and Materials groups offset modest gains in Tech shares. In corporate news, General Electric (GE +7.3%) rose following a surprise upgrade from an influential Wall Street analyst.
Treasuries were mixed as the yield on the 10-year climbed one basis point to 2.91%. In commodities, WTI crude advanced 3.6% to $52.98/barrel, amid reports Saudi Arabia will cut its U.S. oil exports to 30-year lows. COMEX gold slipped 0.1% to $1,242.70/ounce amid a stronger dollar. |
 Kenneth J. Gruneisen started out as a licensed stockbroker in August 1987, a couple of months prior to the historic stock market crash that took the Dow Jones Industrial Average down -22.6% in a single day. He has published daily fact-based fundamental and technical analysis on high-ranked stocks online for two decades. Through FACTBASEDINVESTING.COM, Kenneth provides educational articles, news, market commentary, and other information regarding proven investment systems that work in good times and bad.
Comments contained in the body of this report are technical opinions only and are not necessarily those of Gruneisen Growth Corp. The material herein has been obtained from sources believed to be reliable and accurate, however, its accuracy and completeness cannot be guaranteed. Our firm, employees, and customers may effect transactions, including transactions contrary to any recommendation herein, or have positions in the securities mentioned herein or options with respect thereto. Any recommendation contained in this report may not be suitable for all investors and it is not to be deemed an offer or solicitation on our part with respect to the purchase or sale of any securities. |
|
 |
Tech, Financial, and Retail Indexes Fell
Kenneth J. Gruneisen - Passed the CAN SLIM® Master's Exam
The Broker/Dealer Index ($XBD -1.40%) and the Bank Index ($BKX -1.64%) both outpaced the Retail Index ($RLX -0.41%) to the downside. The tech sector had a negative bias as the Biotech Index ($BTK -1.90%) outpaced the Semiconductor Index ($SOX -0.36%) and the Networking Index ($NWX -0.44%) to the downside. While the Oil Services Index ($OSX -1.85%) fell, the Gold & Silver Index ($XAU +0.17%) and the Integrated Oil Index ($XOI +0.38%) each posted small gains.
Charts courtesy of www.stockcharts.com
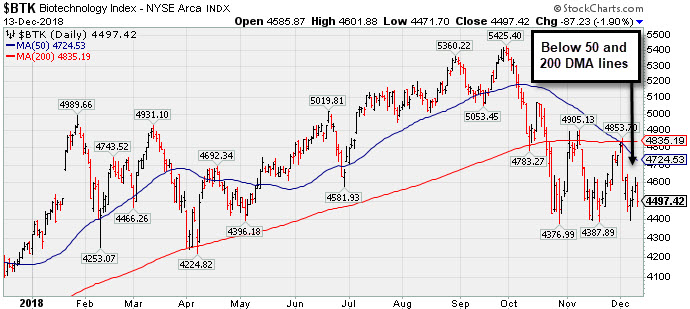 PICTURED: The Biotech Index ($BTK -1.90%) slumped near its October-November lows. It is below its 50-day and 200-day moving averages which recently acted as resistance.
| Oil Services |
$OSX |
93.23 |
-1.75 |
-1.84% |
-37.66% |
| Integrated Oil |
$XOI |
1,264.82 |
+4.76 |
+0.38% |
-5.30% |
| Semiconductor |
$SOX |
1,194.59 |
-4.31 |
-0.36% |
-4.67% |
| Networking |
$NWX |
513.88 |
-2.27 |
-0.44% |
+4.76% |
| Broker/Dealer |
$XBD |
243.76 |
-3.46 |
-1.40% |
-8.10% |
| Retail |
$RLX |
2,066.95 |
-8.57 |
-0.41% |
+19.22% |
| Gold & Silver |
$XAU |
68.75 |
+0.11 |
+0.16% |
-19.37% |
| Bank |
$BKX |
89.02 |
-1.48 |
-1.64% |
-16.58% |
| Biotech |
$BTK |
4,497.42 |
-87.23 |
-1.90% |
+6.52% |
|
|
|
 |
Perched Near High With Volume Totals Cooling
Kenneth J. Gruneisen - Passed the CAN SLIM® Master's Exam
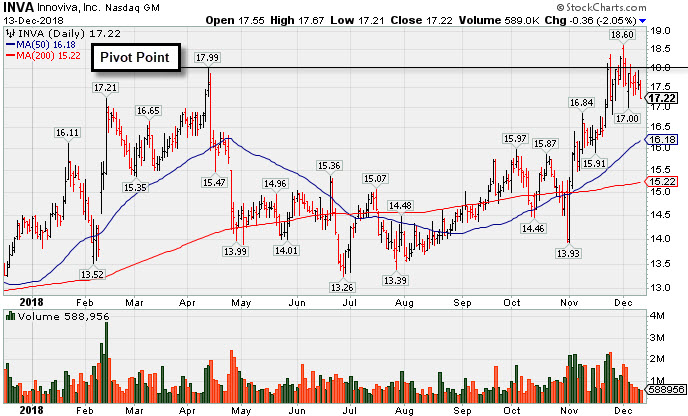
Innoviva Inc (INVA -$0.36 or -2.05% to $17.22) has seen volume totals cooling while remaining perched near its all-time high. Subsequent gains and a strong close above the pivot point backed by at least +40% above average volume may trigger a technical buy signal. New buying efforts are discouraged under the fact-based investment system until a new confirmed market rally (M criteria) with a follow-through day is noted.
Earnings increases in quarterly comparisons through Sep '18 have been above the +25% minimum guideline (C criteria). Annual earnings (A criteria) growth has been good after turning a profitable FY '15. It has earned a 94 Earnings Per Share Rating, well above the 80+ minimum for buy candidates.
The number of top-rated funds owning its shares rose from 351 in Dec '17 to 390 in Sep '18, a reassuring sign concerning the I criteria. The current Up/Down Volume Ratio of 1.0 is an unbiased indication its shares have been neutral concerning accumulation/distribution over the past 50 days. There are only 66.7 million shares in the public float (S criteria). It has earned an A Timeliness Rating and B Sponsorship Rating.
Charts courtesy of www.stockcharts.com
 |
|
|
Color Codes Explained :
Y - Better candidates highlighted by our
staff of experts.
G - Previously featured
in past reports as yellow but may no longer be buyable under the
guidelines.
***Last / Change / Volume data in this table is the closing quote data***
Symbol/Exchange
Company Name
Industry Group |
PRICE |
CHANGE
(%Change) |
Day High |
Volume
(% DAV)
(% 50 day avg vol) |
52 Wk Hi
% From Hi |
Featured
Date |
Price
Featured |
Pivot Featured |
|
Max Buy |
MLR
-
NYSE
Miller Industries Inc
AUTOMOTIVE - Auto Parts
|
$27.35
|
-0.20
-0.73% |
$28.27
|
25,265
87.12% of 50 DAV
50 DAV is 29,000
|
$29.40
-6.97%
|
11/30/2018
|
$28.35
|
PP = $29.50
|
|
MB = $30.98
|
Most Recent Note - 12/10/2018 1:04:20 PM
Y - Pulling back for a 4th consecutive session after trading within close striking distance of its 52-week high. Highlighted in yellow with pivot point cited based on its 8/10/18 high plus 10 cents in the 11/30/18 mid-day report. Faces little resistance due to overhead supply up to the $29 level. Subsequent gains above the pivot point backed by at least +40% above average volume are needed to trigger a technical buy signal. Reported earnings +95% on +28% sales revenues for the Sep '18 quarter. Recent quarterly comparisons have been above the +25% minimum earnings guideline (C criteria) and, sequentially, showed encouraging sales revenues acceleration. Annual earnings history (A criteria) has also been good. Very small supply of only 11.4 million shares outstanding (A criteria) can contribute to greater price volatility in the event of institutional buying or selling.
>>> FEATURED STOCK ARTICLE : Perched Within Striking Distance of All Time High - 12/3/2018 |
View all notes |
Set NEW NOTE alert |
Company Profile |
SEC
News |
Chart |
Request a new note
C
A
S
I |
ZBRA
-
NASDAQ
Zebra Tech Corp Cl A
COMPUTER HARDWARE - Computer Peripherals
|
$172.79
|
-0.72
-0.41% |
$175.24
|
257,663
54.24% of 50 DAV
50 DAV is 475,000
|
$184.75
-6.47%
|
11/6/2018
|
$170.41
|
PP = $179.57
|
|
MB = $188.55
|
Most Recent Note - 12/12/2018 5:34:13 PM
Y - Consolidating above its 50 DMA line ($168.53) after 3 consecutive gains on light volume and its color code is changed to yellow. The prior lows and 200 DMA line ($155) define important near-term support to watch.
>>> FEATURED STOCK ARTICLE : Challenging High After Rebound Above 50-day Average - 11/28/2018 |
View all notes |
Set NEW NOTE alert |
Company Profile |
SEC
News |
Chart |
Request a new note
C
A
S
I |
CME
-
NASDAQ
C M E Group Inc
DIVERSIFIED SERVICES - Business/Management Services
|
$187.94
|
-0.63
-0.33% |
$188.92
|
1,897,742
84.80% of 50 DAV
50 DAV is 2,238,000
|
$197.08
-4.64%
|
10/4/2018
|
$179.29
|
PP = $177.45
|
|
MB = $186.32
|
Most Recent Note - 12/12/2018 5:29:58 PM
G - Still perched near its all-time high, consolidating above its 50 DMA line ($184.90) and recent low ($183.43 on 12/06/18) defining important near-term support. Recently reported earnings +22% on +2% sales revenues for the Sep '18 quarter, below the +25% minimum earnings guideline (C criteria), raising fundamental concerns. See the latest FSU analysis for more details and a new annotated graph.
>>> FEATURED STOCK ARTICLE : Consolidating Above 50-Day Moving Average - 12/12/2018 |
View all notes |
Set NEW NOTE alert |
Company Profile |
SEC
News |
Chart |
Request a new note
C
A
S
I |
GDOT
-
NYSE
Green Dot Corp Cl A
FINANCIAL SERVICES - Credit Services
|
$81.25
|
-0.71
-0.87% |
$82.88
|
453,537
90.71% of 50 DAV
50 DAV is 500,000
|
$93.00
-12.63%
|
11/8/2018
|
$90.35
|
PP = $91.61
|
|
MB = $96.19
|
Most Recent Note - 12/12/2018 12:34:27 PM
G - Rebounded above its 50 DMA line, however it faces resistance due to overhead supply up to the $93 level. Its 200 DMA line and prior low ($71.50 on 10/29/18) define important near-term support.
>>> FEATURED STOCK ARTICLE : Recently Found Support Near 200-Day Average - 12/7/2018 |
View all notes |
Set NEW NOTE alert |
Company Profile |
SEC
News |
Chart |
Request a new note
C
A
S
I |
UBNT
-
NASDAQ
Ubiquiti Networks
TELECOMMUNICATIONS - Diversified Communication Serv
|
$110.46
|
-2.46
-2.18% |
$114.24
|
248,322
51.63% of 50 DAV
50 DAV is 481,000
|
$115.44
-4.31%
|
11/9/2018
|
$108.20
|
PP = $101.43
|
|
MB = $106.50
|
Most Recent Note - 12/12/2018 5:32:32 PM
G - Posted a gain today with higher (near average) volume for a best-ever close. Prior high ($101.33 on 9/25/18) defines initial support to watch on pullbacks.
>>> FEATURED STOCK ARTICLE : Volume Totals Cooling While Still Hovering Above "Max Buy" Level - 12/11/2018 |
View all notes |
Set NEW NOTE alert |
Company Profile |
SEC
News |
Chart |
Request a new note
C
A
S
I |
Symbol/Exchange
Company Name
Industry Group |
PRICE |
CHANGE
(%Change) |
Day High |
Volume
(% DAV)
(% 50 day avg vol) |
52 Wk Hi
% From Hi |
Featured
Date |
Price
Featured |
Pivot Featured |
|
Max Buy |
PRAH
-
NASDAQ
P R A Health Sciences
HEALTH SERVICES - Medical Laboratories and Researc
|
$103.51
|
-2.33
-2.20% |
$106.41
|
305,827
58.25% of 50 DAV
50 DAV is 525,000
|
$121.98
-15.14%
|
11/30/2018
|
$117.06
|
PP = $112.98
|
|
MB = $118.63
|
Most Recent Note - 12/12/2018 5:36:26 PM
G - Found support recently at its 50 DMA line ($102.93). Undercut its pivot point after a noted "negative reversal".
>>> FEATURED STOCK ARTICLE : Streak of Gains For New Highs Marked by Increasing Volume - 11/30/2018 |
View all notes |
Set NEW NOTE alert |
Company Profile |
SEC
News |
Chart |
Request a new note
C
A
S
I |
PLNT
-
NYSE
Planet Fitness Inc Cl A
Leisure-Services
|
$54.46
|
-0.45
-0.82% |
$55.82
|
682,451
53.48% of 50 DAV
50 DAV is 1,276,000
|
$58.50
-6.91%
|
11/7/2018
|
$57.10
|
PP = $55.45
|
|
MB = $58.22
|
Most Recent Note - 12/12/2018 5:31:15 PM
Y - Still sputtering following a "negative reversal" on 12/04/18 after it touched a new all-time high. Its 50 DMA line and recent low ($48.02 on 11/20/18) define important near-term support to watch on pullbacks.
>>> FEATURED STOCK ARTICLE : Fitness Firm Perched Near All-Time High - 11/29/2018 |
View all notes |
Set NEW NOTE alert |
Company Profile |
SEC
News |
Chart |
Request a new note
C
A
S
I |
MEDP
-
NASDAQ
Medpace Holdings Inc
Medical-Research Eqp/Svc
|
$55.66
|
-2.92
-4.98% |
$58.58
|
359,062
65.28% of 50 DAV
50 DAV is 550,000
|
$65.09
-14.49%
|
12/3/2018
|
$63.43
|
PP = $65.19
|
|
MB = $68.45
|
 Most Recent Note - 12/13/2018 5:00:26 PM
Y - Slumped near its 50 DMA line ($55.45) today, and more damaging losses would raise greater concerns. Sputtering since highlighted in yellow with pivot point cited based on its 9/17/18 high plus 10 cents in the 12/03/18 mid-day report. Subsequent gains above the pivot point backed by a least +40% above average volume may trigger a technical buy signal. Reported earnings +68% on +62% sales revenues for the Sep '18 quarter marking the 3rd consecutive comparison above the +25% minimum earnings guideline (C criteria).
>>> FEATURED STOCK ARTICLE : Pullback After 9 Straight Gains Challenged High - 12/4/2018 |
View all notes |
Set NEW NOTE alert |
Company Profile |
SEC
News |
Chart |
Request a new note
C
A
S
I |
INVA
-
NASDAQ
Innoviva Inc
Medical-Biomed/Biotech
|
$17.22
|
-0.36
-2.05% |
$17.67
|
588,956
50.21% of 50 DAV
50 DAV is 1,173,000
|
$18.60
-7.42%
|
11/23/2018
|
$17.74
|
PP = $18.09
|
|
MB = $18.99
|
Most Recent Note - 12/13/2018 4:57:58 PM
Y - Volume totals have been cooling while perched near its all-time high. Subsequent gains and a strong close above the pivot point backed by at least +40% above average volume may clinch a technical buy signal. See the latest FSU analysis for more details and a new annotated graph.
>>> FEATURED STOCK ARTICLE : Perched Near High With Volume Totals Cooling - 12/13/2018 |
View all notes |
Set NEW NOTE alert |
Company Profile |
SEC
News |
Chart |
Request a new note
C
A
S
I |
|
|
|
THESE ARE NOT BUY RECOMMENDATIONS!
Comments contained in the body of this report are technical
opinions only. The material herein has been obtained
from sources believed to be reliable and accurate, however,
its accuracy and completeness cannot be guaranteed.
This site is not an investment advisor, hence it does
not endorse or recommend any securities or other investments.
Any recommendation contained in this report may not
be suitable for all investors and it is not to be deemed
an offer or solicitation on our part with respect to
the purchase or sale of any securities. All trademarks,
service marks and trade names appearing in this report
are the property of their respective owners, and are
likewise used for identification purposes only.
This report is a service available
only to active Paid Premium Members.
You may opt-out of receiving report notifications
at any time. Questions or comments may be submitted
by writing to Premium Membership Services 665 S.E. 10 Street, Suite 201 Deerfield Beach, FL 33441-5634 or by calling 1-800-965-8307
or 954-785-1121.
|
|
|

