Help Lines 954-785-1121


You are not logged in. Upgrade Here
 <<<Previous Mid Day Report     Next Mid Day Report >>> 
 <<<Previous After Market Report Next After Market Report >>> 
You are not logged in.
This means you CAN ONLY VIEW reports that were published prior to Sunday, February 25, 2024.
You MUST UPGRADE YOUR MEMBERSHIP if you want to see any current reports.

AFTER MARKET UPDATE - THURSDAY, DECEMBER 12TH, 2019
Previous After Market Report Next After Market Report >>>
Indices NYSE Nasdaq
DOW  +220.75 28,132.05 +0.79% Volume 892,638,620 +19% Volume 2,382,926,850 +20%
NASDAQ +63.27 8,717.32 +0.73% Advancers 1,772 62% Advancers 2,002 63%
S&P 500 +26.94 3,168.57 +0.86% Decliners 1,086 38% Decliners 1,173 37%
Russell 2000 +12.89 1,644.81 +0.79% 52 Wk Highs 215   52 Wk Highs 328  
S&P 600 +10.55 1,009.59 +1.06% 52 Wk Lows 21   52 Wk Lows 65  

Major Indices Surged to New Record Highs

The Dow rallied 220 points, closing within 0.1% of its all-time high. The S&P 500 jumped 0.9%, and the Nasdaq Composite climbed 0.7%, to send both indexes to their first record levels since November 27. Breadth was positive as advancers led decliners by a 3-2 margin on the  NYSE and 5-3 on the Nasdaq exchange. The volume totals were higher than the prior session on the NYSE and on the Nasdaq exchange, indicative of greater institutional buying demand. Leadership expanded as there were 107 high-ranked companies from the Leaders List that hit a new 52-week high and were listed on the BreakOuts Page, versus the total of 48 on the prior session. New 52-week highs totals expanded and easily outnumbered new 52-week lows totals on the NYSE and on the Nasdaq exchange. The major indices (M criteria) are in a "confirmed uptrend" after enduring distributional pressure in recent weeks. The Featured Stocks Page provides the most timely analysis on high-ranked leaders.

Charts used courtesy of www.stockcharts.com

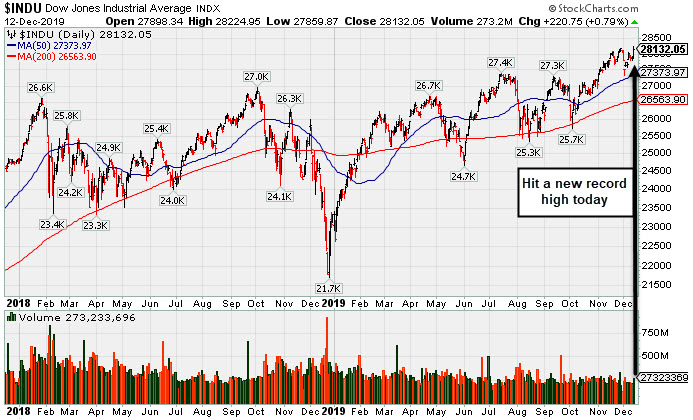
PICTURED: The Dow Jones Industrial Average hit a new record high. It recently found support above prior highs and above its 50-day moving average (DMA) line.

Stock finished firmly higher on Thursday, as investors digested updates on the trade front. A report revealed Washington and Beijing had reached a phase-one deal in principle that awaited President Trump’s approval. The agreement is widely expected to delay U.S. tariffs that are set to take place on December 15, and reduce existing duties. 

Amid the risk-on mood, perceived safe-haven assets retreated. Treasuries posted their largest decline since mid-September, with the yield on the 10-year note jumping ten basis points to 1.89%. COMEX gold slipped 0.1% to $1,468.50/ounce.

Seven of 11 S&P 500 sectors ended the session in positive territory. The Financials group paced the gains, jumping 2%, amid a spike in Treasury yields. Energy also outperformed as WTI crude added 1.1% to $59.42/barrel. Meanwhile, the Communication Services sector was weighed down by Facebook (FB -3.72%) amid news the FTC may seek a preliminary injunction against the social media giant, with federal officials citing antitrust concerns.

In central bank news, both the European Central Bank and Federal Reserve left respective key rates unchanged in policy decisions this week. Fed Chair Jerome Powell reiterated on Wednesday that the current state of policy is likely to remain appropriate. On the data front, initial jobless claims jumped to a two-year high to 252,000. Separately, core producer price index (ex-food and energy), dipped to 1.3% year-over-year.

Kenneth J. Gruneisen started out as a licensed stockbroker in August 1987, a couple of months prior to the historic stock market crash that took the Dow Jones Industrial Average down -22.6% in a single day. He has published daily fact-based fundamental and technical analysis on high-ranked stocks online for two decades. Through FACTBASEDINVESTING.COM, Kenneth provides educational articles, news, market commentary, and other information regarding proven investment systems that work in good times and bad.

Comments contained in the body of this report are technical opinions only and are not necessarily those of Gruneisen Growth Corp. The material herein has been obtained from sources believed to be reliable and accurate, however, its accuracy and completeness cannot be guaranteed. Our firm, employees, and customers may effect transactions, including transactions contrary to any recommendation herein, or have positions in the securities mentioned herein or options with respect thereto. Any recommendation contained in this report may not be suitable for all investors and it is not to be deemed an offer or solicitation on our part with respect to the purchase or sale of any securities.


Financial, Energy, and Tech Indexes Led Group Gainers

The Bank Index ($BKX +2.88%) and Broker/Dealer Index ($XBD +2.04%) both posted solid gains while thRetail Index ($RLX +0.66%) also edged higher. The tech sector had a positive bias as the Semiconductor Index ($SOX +2.71%) and Networking Index ($NWX +2.59%) both posted solid gains and outpaced the Biotech Index ($BTK +0.42%). Energy-linked groups also had a positive bias as the Oil Services Index ($OSX +3.17%) and the Integrated Oil Index ($XOI +2.04%) both ratcheted high, meanwhile the Gold & Silver Index ($XAU -0.13%) inched lower.
Charts courtesy of www.stockcharts.com

PICTURED: The 2-year graph of the Semiconductor Index ($SOX +2.71%) shows it perched at a new record high. It has rallied +69.4% from its December 2018 low, however it was a choppy climb.

Industry Index Symbol Close Change % Change YTD % Change
Oil Services $OSX  74.67 +2.29 +3.16% -7.36%
Integrated Oil $XOI  1,232.89 +24.62 +2.04% +6.37%
Semiconductor $SOX  1,806.87 +47.67 +2.71% +56.42%
Networking $NWX  576.91 +14.54 +2.59% +18.06%
Broker/Dealer $XBD  292.34 +5.85 +2.04% +23.17%
Retail $RLX  2,379.43 +15.69 +0.66% +21.93%
Gold & Silver $XAU  99.43 -0.13 -0.13% +40.72%
Bank $BKX  113.75 +3.19 +2.89% +32.59%
Biotech $BTK  5,058.97 +21.23 +0.42% +19.86%


Extended From Prior Base and Hovering Near Record High

Copart Inc (CPRT +$0.19 or +0.22% to $88.48) is consolidating after getting extended from any sound base. The 50-day moving average (DMA) line ($84.47) defines near-term support above the prior low ($80.71 on 11/06/19). 

Fundamentals remain strong. Bullish action came after it reported earnings +38% on +20% sales revenues for the Oct '19 quarter, continuing its strong earnings track record. The past 3 quarterly earnings increases were above the +25% minimum guideline (C criteria) and its sales revenues growth rate has accelerated. Annual earnings (A criteria) history has been strong and steady since a downturn in FY '13.

CPRT was last shown in this FSU session on 11/21/19 with an annotated graph under the headline, "Gapped Up Following Another Strong Earnings Report". A volume-driven gain above the pivot point on 9/05/19 clinched a technical buy signal when CPRT was highlighted in yellow with pivot point cited based on its 7/26/19 high plus 10 cents (read here).

The number of top-rated funds owning its shares rose from 1,120 in Sep '18 to 1,378 in Sep '19, a reassuring sign concerning the I criteria. It has a Timeliness Rating of A and Sponsorship Rating of B. Its current Up/Down Volume Ratio of 1.6 is an unbiased indication its shares have been under accumulation over the past 50 days.

Charts courtesy of www.stockcharts.com

Color Codes Explained :
Y - Better candidates highlighted by our staff of experts.
G - Previously featured in past reports as yellow but may no longer be buyable under the guidelines.

***Last / Change / Volume data in this table is the closing quote data***
Symbol/Exchange
Company Name
Industry Group
PRICE CHANGE
(%Change)
Day High Volume
(% DAV)
(% 50 day avg vol)
52 Wk Hi
% From Hi
Featured
Date
Price
Featured
Pivot Featured
Max Buy
StockCharts.com Latest Chart for MLR MLR - NYSE
Miller Industries Inc
AUTOMOTIVE - Auto Parts  
$37.05 +0.49
1.34%

$37.40

47,418
105.37% of 50 DAV
50 DAV is 45,000
$37.70
-1.72%
9/24/2019 $34.00 PP = $35.36
MB = $37.13
Most Recent Note - 12/10/2019 5:48:45 PM
Y - Showing resilience after recently reporting earnings which were below the fundamental guidelines of the fact-based investment system. Remains perched near its 52-week high. Prior highs in the $35 area define initial support above its 50 DMA line ($34.59).
>>> FEATURED STOCK ARTICLE : Miller Still Quietly Hovering Above Prior Highs - 12/4/2019
 |  View all notes | Set NEW NOTE alert | Company Profile | SEC News | Chart | Request a new note C A  S  I 
StockCharts.com Latest Chart for CCBG CCBG - NASDAQ
Capital City Bk Gp
BANKING - Regional - Mid-Atlantic Banks  
$29.60 +0.70
2.42%

$29.60

61,733
162.46% of 50 DAV
50 DAV is 38,000
$30.85
-4.05%
9/13/2019 $27.03 PP = $27.05
MB = $28.40
Most Recent Note - 12/12/2019 6:07:01 PM
G - Closed at the session high with a big gain today backed by above average volume. Recently found support at its 50 DMA line ($28.56). Prior highs define the next important support to watch. More damaging losses would raise concerns and trigger a technical sell signal.
>>> FEATURED STOCK ARTICLE : Found Support at 50-Day Moving Average - 12/10/2019
 |  View all notes | Set NEW NOTE alert | Company Profile | SEC News | Chart | Request a new note C A  S  I 
StockCharts.com Latest Chart for FTNT FTNT - NASDAQ
Fortinet Inc
Computer Sftwr-Security  
$104.40 +0.26
0.25%

$105.02

720,271
52.88% of 50 DAV
50 DAV is 1,362,000
$106.00
-1.51%
12/9/2019 $103.85 PP = $106.10
MB = $111.41
Most Recent Note - 12/9/2019 5:34:56 PM
Y - Color code is changed to yellow with new pivot point cited based on its 11/20/19 high plus 10 cents after forming an advanced 3-weeks tight base pattern. Volume totals have been cooling while still stubbornly holding its ground. Prior high in the $97 area defines initial support to watch on pullbacks.
>>> FEATURED STOCK ARTICLE : Extended From Prior Base Perched Near Record HIgh - 12/2/2019
 |  View all notes | Set NEW NOTE alert | Company Profile | SEC News | Chart | Request a new note C A  S  I 
StockCharts.com Latest Chart for SPSC SPSC - NASDAQ
S P S Commerce Inc
COMPUTER SOFTWARE and SERVICES - Application Software  
$55.57 +0.06
0.11%

$56.25

246,335
122.31% of 50 DAV
50 DAV is 201,400
$59.14
-6.04%
11/29/2019 $56.59 PP = $59.24
MB = $62.20
Most Recent Note - 12/10/2019 5:53:34 PM
Y - Endured distributional pressure in recent weeks near its all-time high. Subsequent gains above its pivot point backed by at least +40% above average volume are needed to trigger a new technical buy signal. Fundamentals remain strong.
>>> FEATURED STOCK ARTICLE : Rebound Leaves Supply Chain Management Software Firm Near High - 11/29/2019
 |  View all notes | Set NEW NOTE alert | Company Profile | SEC News | Chart | Request a new note C A  S  I 
StockCharts.com Latest Chart for AUDC AUDC - NASDAQ
Audiocodes Ltd
ELECTRONICS - Scientific and Technical Instrum  
$25.12 +0.63
2.57%

$25.20

209,256
79.26% of 50 DAV
50 DAV is 264,000
$25.04
0.32%
9/13/2019 $19.68 PP = $19.84
MB = $20.83
Most Recent Note - 12/12/2019 6:03:25 PM
G - Hit a new all-time high with today's 3rd consecutive gain backed by below average volume. Extended from the previously noted base. Prior highs in the $22 area define initial support above its 50 DMA line ($21.22). Fundamentals remain strong.
>>> FEATURED STOCK ARTICLE : Volume Totals Cooling After Gains for New Highs - 11/22/2019
 |  View all notes | Set NEW NOTE alert | Company Profile | SEC News | Chart | Request a new note C A  S  I 
Symbol/Exchange
Company Name
Industry Group
PRICE CHANGE
(%Change)
Day High Volume
(% DAV)
(% 50 day avg vol)
52 Wk Hi
% From Hi
Featured
Date
Price
Featured
Pivot Featured
Max Buy
StockCharts.com Latest Chart for CHDN CHDN - NASDAQ
Churchill Downs Inc
LEISURE - Gaming Activities  
$134.41 +0.86
0.64%

$135.86

266,177
91.79% of 50 DAV
50 DAV is 290,000
$135.32
-0.67%
10/8/2019 $129.77 PP = $132.83
MB = $139.47
Most Recent Note - 12/9/2019 5:31:50 PM
G - Quietly perched within close striking distance of its 52-week high. Its 50 DMA line ($128.77) defines near-term support above the prior low ($121.81 on 11/07/19) The Jun and Sep '19 quarterly earnings versus the year ago periods were both below the +25% minimum guideline (C criteria) and raised fundamental concerns. See the latest FSU analysis for more details and a new annotated graph.
>>> FEATURED STOCK ARTICLE : Met Resistance After Rebounding Near Prior High - 12/9/2019
 |  View all notes | Set NEW NOTE alert | Company Profile | SEC News | Chart | Request a new note C A  S  I 
StockCharts.com Latest Chart for LULU LULU - NASDAQ
Lululemon Athletica
MANUFACTURING - Textile Manufacturing  
$224.47 -8.72
-3.74%

$228.82

11,129,884
651.63% of 50 DAV
50 DAV is 1,708,000
$235.50
-4.68%
9/6/2019 $201.25 PP = $194.35
MB = $204.07
Most Recent Note - 12/12/2019 12:41:56 PM
G - Down today with a big loss on heavy volume after it reported earnings +28% on +23% sales revenues for the Oct '19 quarter. Prior notes reminded members - "Volume and volatility often increase near earnings news. It is very extended from any sound base and quietly inching into new all-time high territory with recent gains lacking great volume conviction. Its 50 DMA line and prior high coincide in the $209 area defining important near-term support to watch."

>>> FEATURED STOCK ARTICLE : New High Close Stretches Already Extended Leader - 11/26/2019
 |  View all notes | Set NEW NOTE alert | Company Profile | SEC News | Chart | Request a new note C A  S  I 
StockCharts.com Latest Chart for CPRT CPRT - NASDAQ
Copart Inc
SPECIALTY RETAIL - Auto Dealerships  
$88.48 +0.19
0.22%

$89.29

1,761,335
104.84% of 50 DAV
50 DAV is 1,680,000
$92.41
-4.25%
9/5/2019 $79.13 PP = $79.84
MB = $83.83
Most Recent Note - 12/12/2019 6:01:29 PM
G - Consolidating after getting extended from any sound base. The 50 DMA line ($84.47) defines near-term support above the prior low ($80.71 on 11/06/19). Fundamentals remain strong. See the latest FSU analysis for more details and a new annotated graph.
>>> FEATURED STOCK ARTICLE : Extended From Prior Base and Hovering Near Record High - 12/12/2019
 |  View all notes | Set NEW NOTE alert | Company Profile | SEC News | Chart | Request a new note C A  S  I 
StockCharts.com Latest Chart for NMIH NMIH - NASDAQ
N M I Holdings Inc Cl A
Finance-MrtgandRel Svc  
$33.19 -0.54
-1.60%

$34.18

458,260
105.83% of 50 DAV
50 DAV is 433,000
$34.50
-3.80%
11/8/2019 $32.89 PP = $31.44
MB = $33.01
Most Recent Note - 12/10/2019 5:51:13 PM
G - Perched within close striking distance of its all-time high. Prior highs in the $30-31 area coincide with its 50 DMA line ($30.53) defining important near-term support..
>>> FEATURED STOCK ARTICLE : Holding Ground Stubbornly Near All-Time High - 11/27/2019
 |  View all notes | Set NEW NOTE alert | Company Profile | SEC News | Chart | Request a new note C A  S  I 
StockCharts.com Latest Chart for SPLK SPLK - NASDAQ
Splunk Inc
Computer Sftwr-Database  
$143.65 -2.25
-1.54%

$146.20

2,141,423
113.24% of 50 DAV
50 DAV is 1,891,000
$152.68
-5.91%
11/25/2019 $147.79 PP = $142.16
MB = $149.27
Most Recent Note - 12/11/2019 6:01:25 PM
Y - Slumped today with higher volume, consolidating above its pivot point and below its "max buy" level. Prior highs in the $142-143 area define initial support to watch on pullbacks.
>>> FEATURED STOCK ARTICLE : Spurt of Volume-Driven Gains Reaches New All-Time High - 11/25/2019
 |  View all notes | Set NEW NOTE alert | Company Profile | SEC News | Chart | Request a new note C A  S  I 
Symbol/Exchange
Company Name
Industry Group
PRICE CHANGE
(%Change)
Day High Volume
(% DAV)
(% 50 day avg vol)
52 Wk Hi
% From Hi
Featured
Date
Price
Featured
Pivot Featured
Max Buy
StockCharts.com Latest Chart for PAYC PAYC - NYSE
Paycom Software Inc
COMPUTER SOFTWARE and SERVICES - Application Software  
$254.48 -7.59
-2.90%

$262.42

495,311
87.36% of 50 DAV
50 DAV is 567,000
$279.95
-9.10%
11/20/2019 $252.97 PP = $259.81
MB = $272.80
Most Recent Note - 12/11/2019 6:00:00 PM
Y - Consolidating above its pivot point and below its "max buy" level. Prior high ($259) defines initial support to watch on pullbacks. Fundamentals remain strong. See the latest FSU analysis for more details and a new annotated graph.
>>> FEATURED STOCK ARTICLE : Consolidating Near Prior Highs Which Define Initial Support - 12/11/2019
 |  View all notes | Set NEW NOTE alert | Company Profile | SEC News | Chart | Request a new note C A  S  I 
StockCharts.com Latest Chart for BLD BLD - NYSE
Topbuild Corp
Bldg-Constr Prds/Misc  
$105.10 -3.47
-3.20%

$109.87

417,627
158.19% of 50 DAV
50 DAV is 264,000
$113.74
-7.60%
5/17/2019 $82.19 PP = $87.31
MB = $91.68
Most Recent Note - 12/9/2019 5:41:10 PM
Y - Color code is changed to yellow after a tight consolidation, with new pivot point cited based on its 11/27/19 high plus 10 cents. Subsequent gains for new highs back by at least +40% above average volume are needed to trigger a new (or add-on) technical buy signal. Reported earnings +24% on +5% sales revenues for the Sep '19 quarter versus the year ago period, just below the +25% minimum guideline (C criteria). Its 50 DMA line ($103.82) acted as support during its ongoing ascent.
>>> FEATURED STOCK ARTICLE : Consolidating After Getting Extended From Any Sound Base - 12/3/2019
 |  View all notes | Set NEW NOTE alert | Company Profile | SEC News | Chart | Request a new note C A  S  I 
StockCharts.com Latest Chart for GLOB GLOB - NYSE
Globant SA
Computer-Tech Services  
$104.24 +1.97
1.93%

$104.86

317,132
118.78% of 50 DAV
50 DAV is 267,000
$112.33
-7.20%
11/14/2019 $106.87 PP = $112.43
MB = $118.05
Most Recent Note - 12/12/2019 6:08:40 PM
G - Posted a solid gain today with volume slightly above average. Disciplined investors will watch for noted improvement and subsequent volume-driven gains for new highs which are still needed to trigger a technical buy signal. Found support near its 50 DMA line ($98.49) after volume-driven losses. Prior lows and its 200 DMA line define the next important support to watch. Fundamentals remain strong.
>>> FEATURED STOCK ARTICLE : Found Support at 50-Day Average During Choppy Consolidation - 12/5/2019
 |  View all notes | Set NEW NOTE alert | Company Profile | SEC News | Chart | Request a new note C A  S  I 

THESE ARE NOT BUY RECOMMENDATIONS!  Comments contained in the body of this report are technical opinions only. The material herein has been obtained from sources believed to be reliable and accurate, however, its accuracy and completeness cannot be guaranteed. This site is not an investment advisor, hence it does not endorse or recommend any securities or other investments. Any recommendation contained in this report may not be suitable for all investors and it is not to be deemed an offer or solicitation on our part with respect to the purchase or sale of any securities. All trademarks, service marks and trade names appearing in this report are the property of their respective owners, and are likewise used for identification purposes only.

This report is a service available only to active Paid Premium Members. You may opt-out of receiving report notifications at any time.  Questions or comments may be submitted by writing to Premium Membership Services 665 S.E. 10 Street, Suite 201 Deerfield Beach, FL 33441-5634 or by calling 1-800-965-8307 or 954-785-1121.

Kenneth J. Gruneisen founded Gruneisen Growth Corp. (2003), which prior to May 11, 2015, operated CANSLIM.net and CANSLIM.com both under license from Data Analysis Inc. / Investor's Business Daily. Kenneth has passed the CAN SLIM® Master's Exam. Gruneisen Growth Corp. now continues over two decades of fact based market analysis via FactBasedInvesting.com.

Copyright © 1996-2024 Gruneisen Growth Corp. All rights reserved. Protected by the copyright laws of the United States and Canada and by international treaties

Privacy Policy | Terms of Use | Contact Us