Help Lines 954-785-1121


You are not logged in. Upgrade Here
 <<<Previous Mid Day Report     Next Mid Day Report >>> 
 <<<Previous After Market Report Next After Market Report >>> 
You are not logged in.
This means you CAN ONLY VIEW reports that were published prior to Monday, February 19, 2024.
You MUST UPGRADE YOUR MEMBERSHIP if you want to see any current reports.

AFTER MARKET UPDATE - WEDNESDAY, DECEMBER 11TH, 2019
Previous After Market Report Next After Market Report >>>
Indices NYSE Nasdaq
DOW  +29.58 27,911.30 +0.11% Volume 753,216,700 -3% Volume 1,985,542,850 -2%
NASDAQ +37.87 8,654.05 +0.44% Advancers 1,839 64% Advancers 1,719 56%
S&P 500 +9.11 3,141.63 +0.29% Decliners 1,038 36% Decliners 1,367 44%
Russell 2000 +0.21 1,631.93 +0.01% 52 Wk Highs 116   52 Wk Highs 137  
S&P 600 +0.17 999.04 +0.02% 52 Wk Lows 16   52 Wk Lows 62  

Leadership Improved Major Indices Rose With Less Volume

The Dow gained 29 points, while the S&P 500 added 0.3%. The Nasdaq Composite was up 0.4%. Advancers led decliners by a 9-5 margin on the  NYSE and 4-3 on the Nasdaq exchange. The volume totals were lighter than the prior session on the NYSE and on the Nasdaq exchange. There were 48 high-ranked companies from the Leaders List that hit a new 52-week high and were listed on the BreakOuts Page, versus the total of 25 on the prior session. New 52-week highs totals expanded and easily outnumbered new 52-week lows totals on the NYSE and on the Nasdaq exchange. The major indices (M criteria) are in a "confirmed uptrend" after enduring distributional pressure in recent weeks. The Featured Stocks Page provides the most timely analysis on high-ranked leaders.

Charts used courtesy of www.stockcharts.com

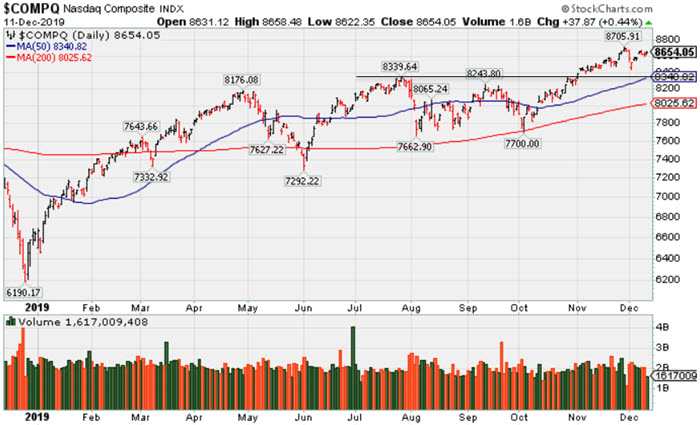
PICTURED: The Nasdaq Composite Index is consolidating -0.6% off its record high. It recently found support well above prior highs and above its 50-day moving average (DMA) line.

Stocks finished higher on Wednesday as investors digested the Federal Reserve’s policy decision. As expected, central bank officials voted unanimously to leave rates unchanged after three consecutive cuts. Fed Chair Jerome Powell reiterated that the current state of policy is likely to remain appropriate, contingent on incoming data. The U.S. dollar dropped to a four-month low, while Treasuries climbed. The yield on the benchmark 10-year note declined five basis points to 1.79%.

On the data front, core consumer prices (excluding food and energy) advanced at an annualized 2.3% pace last month, unchanged from the prior period. In commodities, WTI crude fell 0.8% to $58.76/barrel following a surprise weekly build in U.S. crude stockpiles.

Eight of 11 S&P 500 sectors closed in positive territory, with Technology and Industrial shares pacing gains. In corporate news, Home Depot (HD -1.81%) following a weak sales growth outlook for 2020. Chevron (CVX -1.41%) after announcing plans to write down as much as $11 billion worth of assets amid a decline in oil prices. GameStop (GME -15.05%) after the video game retailer cut its full-year profit guidance and posted an unexpected loss in the latest quarter.

In geopolitics, investors continue to await trade updates ahead of Sunday’s deadline, at which time the U.S. is scheduled to impose tariffs on the final tranche of Chinese imports that includes a number of consumer products. Tomorrow’s general election in the U.K. will be closely watched, as it will help determine the future of Brexit.

Kenneth J. Gruneisen started out as a licensed stockbroker in August 1987, a couple of months prior to the historic stock market crash that took the Dow Jones Industrial Average down -22.6% in a single day. He has published daily fact-based fundamental and technical analysis on high-ranked stocks online for two decades. Through FACTBASEDINVESTING.COM, Kenneth provides educational articles, news, market commentary, and other information regarding proven investment systems that work in good times and bad.

Comments contained in the body of this report are technical opinions only and are not necessarily those of Gruneisen Growth Corp. The material herein has been obtained from sources believed to be reliable and accurate, however, its accuracy and completeness cannot be guaranteed. Our firm, employees, and customers may effect transactions, including transactions contrary to any recommendation herein, or have positions in the securities mentioned herein or options with respect thereto. Any recommendation contained in this report may not be suitable for all investors and it is not to be deemed an offer or solicitation on our part with respect to the purchase or sale of any securities.


Semiconductor Index and Gold & Silver Index Led Group Gainers

The Bank Index ($BKX -0.47%) and Broker/Dealer Index ($XBD -0.14%) lost ground while the Retail Index ($RLX +0.15%) inched higher. The tech sector was mixed as the Semiconductor Index ($SOX +2.23%) posted a solid gain and the Networking Index ($NWX +0.53%) tallied a smaller gain, but the Biotech Index ($BTK -1.02%) lost ground. Commodity-linked groups also had a positive bias as the Gold & Silver Index ($XAU +2.86%) posted a solid gain and the Oil Services Index ($OSX +1.19%) also rose, but the Integrated Oil Index ($XOI -0.36%) inched lower.
Charts courtesy of www.stockcharts.com

PICTURED: The Broker/Dealer Index ($XBD -0.14%) is perched near its 2019 high, rebounding toward its March 2018 record high after a choppy consolidation.

Industry Index Symbol Close Change % Change YTD % Change
Oil Services $OSX  72.38 +0.85 +1.19% -10.20%
Integrated Oil $XOI  1,208.26 -4.39 -0.36% +4.24%
Semiconductor $SOX  1,759.20 +38.30 +2.23% +52.29%
Networking $NWX  562.37 +2.99 +0.53% +15.08%
Broker/Dealer $XBD  286.48 -0.40 -0.14% +20.71%
Retail $RLX  2,363.74 +3.51 +0.15% +21.13%
Gold & Silver $XAU  99.56 +2.77 +2.86% +40.90%
Bank $BKX  110.56 -0.52 -0.47% +28.87%
Biotech $BTK  5,037.74 -52.07 -1.02% +19.35%


Consolidating Near Prior Highs Which Define Initial Support

Paycom Software Inc (PAYC -$3.43 or -1.29% to $262.07) is consolidating above its pivot point and below its "max buy" level. The prior high ($259) defines initial support to watch on pullbacks. 

PAYC finished strong after highlighted in yellow with new pivot point cited based on its 8/29/19 high plus 10 cents in the 11/20/19 mid-day report (read here). The gain for a new high was backed by +167% above average volume and triggered a new technical buy signal. It was last shown in this FSU section on 11/20/19 under the headline "Powerful Gain for New High Backed by Heavy Volume". Fundamentals have been strong. It reported earnings +35% on +31% sales revenues for the Sep '19 quarter.

The Computer Software - Enterprise firm's current Up/Down Volume Ratio of 2.3 is an unbiased indication its shares have been under accumulation over the past 50 days. Its small supply of only 58.4 million shares outstanding (S criteria) can contribute to greater price volatility in the event of institutional buying or selling. The number of top-rated funds owning its shares rose from 384 in Jun '17 to 877 in Sep '19, a reassuring sign concerning the I criteria. It has a Timeliness rating of A and Sponsorship rating of B. It completed Secondary Offerings on 11/13/15, 9/16/15, 5/15/15 and 1/14/15 since its $15 IPO on 4/15/14.

Charts used courtesy of www.stockcharts.com

Color Codes Explained :
Y - Better candidates highlighted by our staff of experts.
G - Previously featured in past reports as yellow but may no longer be buyable under the guidelines.

***Last / Change / Volume data in this table is the closing quote data***
Symbol/Exchange
Company Name
Industry Group
PRICE CHANGE
(%Change)
Day High Volume
(% DAV)
(% 50 day avg vol)
52 Wk Hi
% From Hi
Featured
Date
Price
Featured
Pivot Featured
Max Buy
StockCharts.com Latest Chart for MLR MLR - NYSE
Miller Industries Inc
AUTOMOTIVE - Auto Parts  
$36.56 +0.18
0.49%

$36.66

33,652
74.78% of 50 DAV
50 DAV is 45,000
$37.70
-3.02%
9/24/2019 $34.00 PP = $35.36
MB = $37.13
Most Recent Note - 12/10/2019 5:48:45 PM
Y - Showing resilience after recently reporting earnings which were below the fundamental guidelines of the fact-based investment system. Remains perched near its 52-week high. Prior highs in the $35 area define initial support above its 50 DMA line ($34.59).
>>> FEATURED STOCK ARTICLE : Miller Still Quietly Hovering Above Prior Highs - 12/4/2019
 |  View all notes | Set NEW NOTE alert | Company Profile | SEC News | Chart | Request a new note C A  S  I 
StockCharts.com Latest Chart for CCBG CCBG - NASDAQ
Capital City Bk Gp
BANKING - Regional - Mid-Atlantic Banks  
$28.90 -0.53
-1.80%

$29.57

29,570
77.82% of 50 DAV
50 DAV is 38,000
$30.85
-6.32%
9/13/2019 $27.03 PP = $27.05
MB = $28.40
Most Recent Note - 12/10/2019 5:44:04 PM
G - Posted a 3rd consecutive gain today with light volume after it found support at its 50 DMA line ($28.45). Prior highs which define the next important support to watch. More damaging losses would raise concerns and trigger a technical sell signal. See the latest FSU analysis for more details and a new annotated graph.
>>> FEATURED STOCK ARTICLE : Found Support at 50-Day Moving Average - 12/10/2019
 |  View all notes | Set NEW NOTE alert | Company Profile | SEC News | Chart | Request a new note C A  S  I 
StockCharts.com Latest Chart for FTNT FTNT - NASDAQ
Fortinet Inc
Computer Sftwr-Security  
$104.14 +0.59
0.57%

$104.37

691,565
50.66% of 50 DAV
50 DAV is 1,365,000
$106.00
-1.75%
12/9/2019 $103.85 PP = $106.10
MB = $111.41
Most Recent Note - 12/9/2019 5:34:56 PM
Y - Color code is changed to yellow with new pivot point cited based on its 11/20/19 high plus 10 cents after forming an advanced 3-weeks tight base pattern. Volume totals have been cooling while still stubbornly holding its ground. Prior high in the $97 area defines initial support to watch on pullbacks.
>>> FEATURED STOCK ARTICLE : Extended From Prior Base Perched Near Record HIgh - 12/2/2019
 |  View all notes | Set NEW NOTE alert | Company Profile | SEC News | Chart | Request a new note C A  S  I 
StockCharts.com Latest Chart for SPSC SPSC - NASDAQ
S P S Commerce Inc
COMPUTER SOFTWARE and SERVICES - Application Software  
$55.51 -0.27
-0.48%

$55.76

214,849
106.89% of 50 DAV
50 DAV is 201,000
$59.14
-6.14%
11/29/2019 $56.59 PP = $59.24
MB = $62.20
Most Recent Note - 12/10/2019 5:53:34 PM
Y - Endured distributional pressure in recent weeks near its all-time high. Subsequent gains above its pivot point backed by at least +40% above average volume are needed to trigger a new technical buy signal. Fundamentals remain strong.
>>> FEATURED STOCK ARTICLE : Rebound Leaves Supply Chain Management Software Firm Near High - 11/29/2019
 |  View all notes | Set NEW NOTE alert | Company Profile | SEC News | Chart | Request a new note C A  S  I 
StockCharts.com Latest Chart for AUDC AUDC - NASDAQ
Audiocodes Ltd
ELECTRONICS - Scientific and Technical Instrum  
$24.49 +0.69
2.90%

$24.54

184,385
68.54% of 50 DAV
50 DAV is 269,000
$25.04
-2.20%
9/13/2019 $19.68 PP = $19.84
MB = $20.83
Most Recent Note - 12/11/2019 6:02:41 PM
G - Posted a quiet gain today for a best-ever close. Extended from the previously noted base. Prior highs in the $22 area define initial support above its 50 DMA line ($21.07). Fundamentals remain strong.
>>> FEATURED STOCK ARTICLE : Volume Totals Cooling After Gains for New Highs - 11/22/2019
 |  View all notes | Set NEW NOTE alert | Company Profile | SEC News | Chart | Request a new note C A  S  I 
Symbol/Exchange
Company Name
Industry Group
PRICE CHANGE
(%Change)
Day High Volume
(% DAV)
(% 50 day avg vol)
52 Wk Hi
% From Hi
Featured
Date
Price
Featured
Pivot Featured
Max Buy
StockCharts.com Latest Chart for CHDN CHDN - NASDAQ
Churchill Downs Inc
LEISURE - Gaming Activities  
$133.55 +1.66
1.26%

$133.59

144,334
49.77% of 50 DAV
50 DAV is 290,000
$135.32
-1.31%
10/8/2019 $129.77 PP = $132.83
MB = $139.47
Most Recent Note - 12/9/2019 5:31:50 PM
G - Quietly perched within close striking distance of its 52-week high. Its 50 DMA line ($128.77) defines near-term support above the prior low ($121.81 on 11/07/19) The Jun and Sep '19 quarterly earnings versus the year ago periods were both below the +25% minimum guideline (C criteria) and raised fundamental concerns. See the latest FSU analysis for more details and a new annotated graph.
>>> FEATURED STOCK ARTICLE : Met Resistance After Rebounding Near Prior High - 12/9/2019
 |  View all notes | Set NEW NOTE alert | Company Profile | SEC News | Chart | Request a new note C A  S  I 
StockCharts.com Latest Chart for LULU LULU - NASDAQ
Lululemon Athletica
MANUFACTURING - Textile Manufacturing  
$233.19 +3.54
1.54%

$235.50

5,234,229
321.71% of 50 DAV
50 DAV is 1,627,000
$233.53
-0.15%
9/6/2019 $201.25 PP = $194.35
MB = $204.07
Most Recent Note - 12/11/2019 12:29:21 PM
G - Earnings news is due. Volume and volatility often increase near earnings news. It is very extended from any sound base and quietly inching into new all-time high territory with recent gains lacking great volume conviction. Its 50 DMA line and prior high coincide in the $209 area defining important near-term support to watch along.

>>> FEATURED STOCK ARTICLE : New High Close Stretches Already Extended Leader - 11/26/2019
 |  View all notes | Set NEW NOTE alert | Company Profile | SEC News | Chart | Request a new note C A  S  I 
StockCharts.com Latest Chart for CPRT CPRT - NASDAQ
Copart Inc
SPECIALTY RETAIL - Auto Dealerships  
$88.29 -0.09
-0.10%

$88.80

1,185,269
69.89% of 50 DAV
50 DAV is 1,696,000
$92.41
-4.46%
9/5/2019 $79.13 PP = $79.84
MB = $83.83
Most Recent Note - 12/9/2019 12:11:56 PM
G - Consolidating after getting extended from any sound base. The 50 DMA line ($83.92) defines near-term support above the prior low ($80.71 on 11/06/19). Fundamentals remain strong.
>>> FEATURED STOCK ARTICLE : Gapped Up Following Another Strong Earnings Report - 11/21/2019
 |  View all notes | Set NEW NOTE alert | Company Profile | SEC News | Chart | Request a new note C A  S  I 
StockCharts.com Latest Chart for NMIH NMIH - NASDAQ
N M I Holdings Inc Cl A
Finance-MrtgandRel Svc  
$33.73 -0.25
-0.74%

$34.29

274,726
62.87% of 50 DAV
50 DAV is 437,000
$34.50
-2.23%
11/8/2019 $32.89 PP = $31.44
MB = $33.01
Most Recent Note - 12/10/2019 5:51:13 PM
G - Perched within close striking distance of its all-time high. Prior highs in the $30-31 area coincide with its 50 DMA line ($30.53) defining important near-term support..
>>> FEATURED STOCK ARTICLE : Holding Ground Stubbornly Near All-Time High - 11/27/2019
 |  View all notes | Set NEW NOTE alert | Company Profile | SEC News | Chart | Request a new note C A  S  I 
StockCharts.com Latest Chart for SPLK SPLK - NASDAQ
Splunk Inc
Computer Sftwr-Database  
$145.90 -3.18
-2.13%

$148.61

2,844,071
153.15% of 50 DAV
50 DAV is 1,857,000
$152.68
-4.44%
11/25/2019 $147.79 PP = $142.16
MB = $149.27
Most Recent Note - 12/11/2019 6:01:25 PM
Y - Slumped today with higher volume, consolidating above its pivot point and below its "max buy" level. Prior highs in the $142-143 area define initial support to watch on pullbacks.
>>> FEATURED STOCK ARTICLE : Spurt of Volume-Driven Gains Reaches New All-Time High - 11/25/2019
 |  View all notes | Set NEW NOTE alert | Company Profile | SEC News | Chart | Request a new note C A  S  I 
Symbol/Exchange
Company Name
Industry Group
PRICE CHANGE
(%Change)
Day High Volume
(% DAV)
(% 50 day avg vol)
52 Wk Hi
% From Hi
Featured
Date
Price
Featured
Pivot Featured
Max Buy
StockCharts.com Latest Chart for PAYC PAYC - NYSE
Paycom Software Inc
COMPUTER SOFTWARE and SERVICES - Application Software  
$262.07 -3.43
-1.29%

$267.37

567,990
100.53% of 50 DAV
50 DAV is 565,000
$279.95
-6.39%
11/20/2019 $252.97 PP = $259.81
MB = $272.80
Most Recent Note - 12/11/2019 6:00:00 PM
Y - Consolidating above its pivot point and below its "max buy" level. Prior high ($259) defines initial support to watch on pullbacks. Fundamentals remain strong. See the latest FSU analysis for more details and a new annotated graph.
>>> FEATURED STOCK ARTICLE : Consolidating Near Prior Highs Which Define Initial Support - 12/11/2019
 |  View all notes | Set NEW NOTE alert | Company Profile | SEC News | Chart | Request a new note C A  S  I 
StockCharts.com Latest Chart for BLD BLD - NYSE
Topbuild Corp
Bldg-Constr Prds/Misc  
$108.57 +0.37
0.34%

$109.39

198,350
75.13% of 50 DAV
50 DAV is 264,000
$113.74
-4.55%
5/17/2019 $82.19 PP = $87.31
MB = $91.68
Most Recent Note - 12/9/2019 5:41:10 PM
Y - Color code is changed to yellow after a tight consolidation, with new pivot point cited based on its 11/27/19 high plus 10 cents. Subsequent gains for new highs back by at least +40% above average volume are needed to trigger a new (or add-on) technical buy signal. Reported earnings +24% on +5% sales revenues for the Sep '19 quarter versus the year ago period, just below the +25% minimum guideline (C criteria). Its 50 DMA line ($103.82) acted as support during its ongoing ascent.
>>> FEATURED STOCK ARTICLE : Consolidating After Getting Extended From Any Sound Base - 12/3/2019
 |  View all notes | Set NEW NOTE alert | Company Profile | SEC News | Chart | Request a new note C A  S  I 
StockCharts.com Latest Chart for GLOB GLOB - NYSE
Globant SA
Computer-Tech Services  
$102.27 +1.76
1.75%

$102.40

113,844
42.48% of 50 DAV
50 DAV is 268,000
$112.33
-8.96%
11/14/2019 $106.87 PP = $112.43
MB = $118.05
Most Recent Note - 12/10/2019 5:57:56 PM
G - Disciplined investors will watch for noted improvement and subsequent volume-driven gains for new highs which are still needed to trigger a technical buy signal. Found support near its 50 DMA line ($98) after volume-driven losses. Prior lows and its 200 DMA line define the next important support to watch. Fundamentals remain strong.
>>> FEATURED STOCK ARTICLE : Found Support at 50-Day Average During Choppy Consolidation - 12/5/2019
 |  View all notes | Set NEW NOTE alert | Company Profile | SEC News | Chart | Request a new note C A  S  I 

THESE ARE NOT BUY RECOMMENDATIONS!  Comments contained in the body of this report are technical opinions only. The material herein has been obtained from sources believed to be reliable and accurate, however, its accuracy and completeness cannot be guaranteed. This site is not an investment advisor, hence it does not endorse or recommend any securities or other investments. Any recommendation contained in this report may not be suitable for all investors and it is not to be deemed an offer or solicitation on our part with respect to the purchase or sale of any securities. All trademarks, service marks and trade names appearing in this report are the property of their respective owners, and are likewise used for identification purposes only.

This report is a service available only to active Paid Premium Members. You may opt-out of receiving report notifications at any time.  Questions or comments may be submitted by writing to Premium Membership Services 665 S.E. 10 Street, Suite 201 Deerfield Beach, FL 33441-5634 or by calling 1-800-965-8307 or 954-785-1121.

Kenneth J. Gruneisen founded Gruneisen Growth Corp. (2003), which prior to May 11, 2015, operated CANSLIM.net and CANSLIM.com both under license from Data Analysis Inc. / Investor's Business Daily. Kenneth has passed the CAN SLIM® Master's Exam. Gruneisen Growth Corp. now continues over two decades of fact based market analysis via FactBasedInvesting.com.

Copyright © 1996-2024 Gruneisen Growth Corp. All rights reserved. Protected by the copyright laws of the United States and Canada and by international treaties

Privacy Policy | Terms of Use | Contact Us