You are not logged in.
This means you
CAN ONLY VIEW reports that were published prior to Saturday, February 24, 2024.
You
MUST UPGRADE YOUR MEMBERSHIP if you want to see any current reports.
AFTER MARKET UPDATE - MONDAY, DECEMBER 10TH, 2018
Previous After Market Report Next After Market Report >>>
|
|
|
|
DOW |
+34.31 |
24,423.26 |
+0.14% |
|
Volume |
1,008,781,640 |
-3% |
|
Volume |
2,340,981,340 |
-5% |
|
NASDAQ |
+51.27 |
7,020.52 |
+0.74% |
|
Advancers |
975 |
33% |
|
Advancers |
1,258 |
41% |
|
S&P 500 |
+4.64 |
2,637.72 |
+0.18% |
|
Decliners |
2,024 |
67% |
|
Decliners |
1,844 |
59% |
|
Russell 2000 |
-4.99 |
1,443.09 |
-0.34% |
|
52 Wk Highs |
12 |
|
|
52 Wk Highs |
15 |
|
|
S&P 600 |
-6.35 |
898.91 |
-0.70% |
|
52 Wk Lows |
561 |
|
|
52 Wk Lows |
517 |
|
|
 |
Leadership Thin as Major Indices Manage Positive Reversal
Kenneth J. Gruneisen - Passed the CAN SLIM® Master's Exam
Stocks finished higher on Monday. The Dow added 34 points to 24423 while the S&P 500 climbed 4 points to 2637. The Nasdaq Composite advanced 51 points to 7020. The volume totals on the session were lighter than the prior session totals on the NYSE and on the Nasdaq exchange, indicative of less distributional pressure. Breadth was negative as decliners led advancers by more than a 2-1 margin on the NYSE and 3-2 on the Nasdaq exchange. There were 3 high-ranked companies from the Leaders List that made new 52-week highs and were listed on the BreakOuts Page, versus 6 on the prior session. New 52-week lows totals expanded and solidly outnumbered shrinking new 52-week highs totals on the NYSE and on the Nasdaq exchange. The major indices (M criteria) are in a correction again as damaging losses violated the recent Day 1 lows. New buying efforts are not justified under the fact-based investment system's rules until a new confirmed rally is noted. The Featured Stocks Page provides the most timely analysis on high-ranked leaders. Strict buying and selling rules should always be followed on a case by case basis. Charts used courtesy of www.stockcharts.com
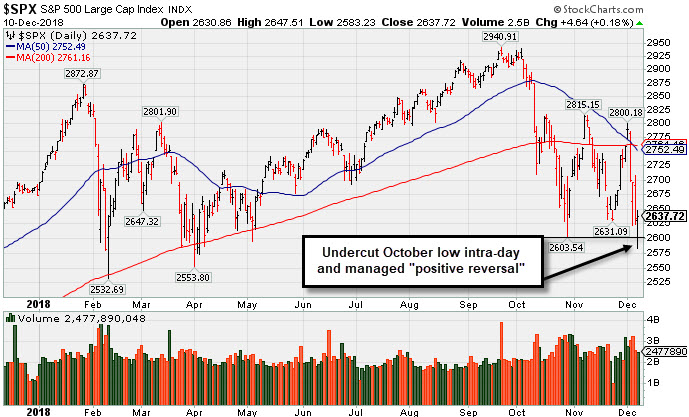
PICTURED: The S&P 500 Index undercut its October low intra-day then managed a "positive reversal". Its 50-day moving average line (blue line) has slumped below its 200-day moving average line (red line), a bearish technical signal termed a "death cross".
U.S. equities recovered from sharp early morning losses as strength in the Technology sector boosted the major averages. Stocks hit their session lows near mid-day after British Prime Minister Theresa May announced she would delay the “Brexit” vote and will instead reengage EU leaders in Brussels on a modified proposal. On the data front, the lone economic update revealed that U.S. job openings hovered near a record 7.1 million in October.
Technology shares paced gains as Microsoft (MSFT +2.64%) and Intel (INTC +2.10%) rose. Industrials erased early morning losses as defense stocks rallied in afternoon trading following a report President Trump no longer plans to “trim” defense spending. Energy and Financials stocks underperformed as falling oil prices and a flattening yield curve pressured both groups. In corporate news, Qualcomm (QCOM +2.23%) rose after China granted the chipmaker an injunction against Apple (AAPL +0.66%). Elsewhere, Facebook (FB +3.22%) rose on news the social media giant authorized a $9 billion increase to its share repurchase program.
Treasuries were mixed with the yield on the 10-year note unchanged at 2.85%. In commodities, WTI crude declined 3.3% to $50.88/barrel. COMEX gold lost 0.3% to $1,243.70/ounce amid a stronger dollar. |
 Kenneth J. Gruneisen started out as a licensed stockbroker in August 1987, a couple of months prior to the historic stock market crash that took the Dow Jones Industrial Average down -22.6% in a single day. He has published daily fact-based fundamental and technical analysis on high-ranked stocks online for two decades. Through FACTBASEDINVESTING.COM, Kenneth provides educational articles, news, market commentary, and other information regarding proven investment systems that work in good times and bad.
Comments contained in the body of this report are technical opinions only and are not necessarily those of Gruneisen Growth Corp. The material herein has been obtained from sources believed to be reliable and accurate, however, its accuracy and completeness cannot be guaranteed. Our firm, employees, and customers may effect transactions, including transactions contrary to any recommendation herein, or have positions in the securities mentioned herein or options with respect thereto. Any recommendation contained in this report may not be suitable for all investors and it is not to be deemed an offer or solicitation on our part with respect to the purchase or sale of any securities. |
|
 |
Tech Sector and Retail Index Posted Gains
Kenneth J. Gruneisen - Passed the CAN SLIM® Master's Exam
The tech sector had a positive bias as the Semiconductor Index ($SOX 1.41%), Biotech Index ($BTK +0.73%), and the Networking Index ($NWX +1.24%) posted unanimous gains. The Retail Index ($RLX +0.46%) also posted a modest gain, but the Broker/Dealer Index ($XBD -0.82%) and the Bank Index ($BKX -2.12%) suffered losses that limited the major indices' gains. Energy-linked groups also fell as the Oil Services Index ($OSX -2.92%) and Integrated Oil Index ($XOI -1.67%) both sank, and the Gold & Silver Index ($XAU -0.79%) also edged lower.
Charts courtesy of www.stockcharts.com
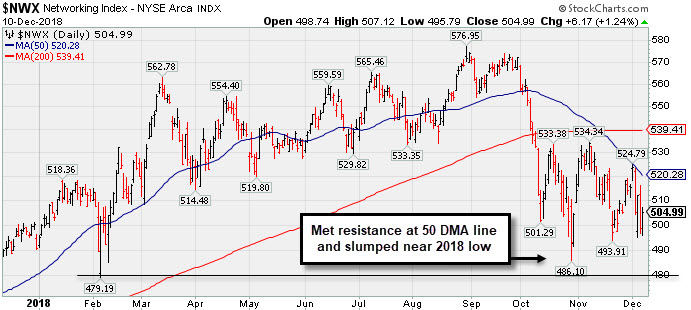 PICTURED: The Networking Index ($NWX +1.24%) has slumped near its 2018 low after meeting resistance near its 50-day moving average (DMA) line..
| Oil Services |
$OSX |
95.05 |
-2.86 |
-2.92% |
-36.44% |
| Integrated Oil |
$XOI |
1,250.38 |
-21.25 |
-1.67% |
-6.38% |
| Semiconductor |
$SOX |
1,174.19 |
+16.33 |
+1.41% |
-6.29% |
| Networking |
$NWX |
504.99 |
+6.17 |
+1.24% |
+2.95% |
| Broker/Dealer |
$XBD |
244.85 |
-2.01 |
-0.82% |
-7.69% |
| Retail |
$RLX |
2,048.71 |
+9.39 |
+0.46% |
+18.17% |
| Gold & Silver |
$XAU |
67.40 |
-0.54 |
-0.79% |
-20.96% |
| Bank |
$BKX |
91.29 |
-1.97 |
-2.11% |
-14.45% |
| Biotech |
$BTK |
4,500.48 |
+32.51 |
+0.73% |
+6.59% |
|
|
|
 |
Damaging Technical Action Following Latest Strong Earnings Report
Kenneth J. Gruneisen - Passed the CAN SLIM® Master's Exam
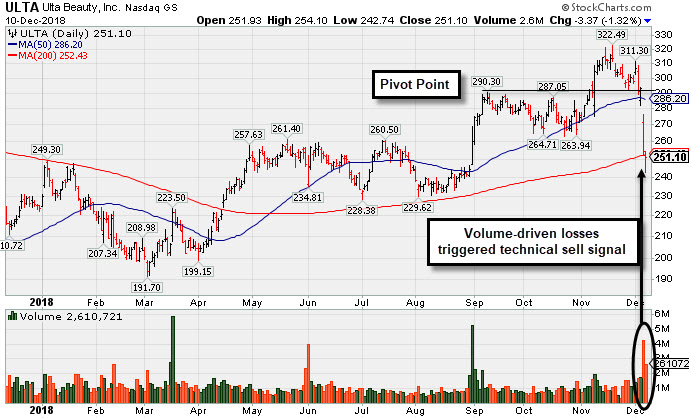
Ulta Beauty Inc (ULTA -$3.37 or -1.32% to $251.10) gapped down on the prior session violating its 50-day moving average (DMA) line with a damaging volume-driven loss triggering a technical sell signal and its color code was changed to green. Members were previously reminded - "Volume and volatility often increase near earnings news." Bearish action came after it reported earnings +30% on +16% sales revenues for the Oct '18 quarter.
ULTA had finished strong after highlighted in yellow with pivot point cited based on its 9/11/18 high plus 10 cents in the 11/07/18 mid-day report (read here). The gain and close above the pivot point backed by +79% above average volume clinched a technical buy signal. It went on to rally through all overhead supply up to the $314 level for new highs before stalling and encountering distributional pressure.
Fundamentals remain strong as earnings increases were above the +25% minimum guideline (C criteria) in the past 3 quarterly comparisons. Its solid annual earnings (A criteria) history is very reassuring. ULTA was last shown in this FSU section on 11/09/18 under the headline, "Volume Driven Gains Indicate Institutional Buying Demand" . It went through a deep consolidation since dropped from the Featured Stocks list on 6/29/17.
It still has a small supply (S criteria) of only 59.3 million shares outstanding. The number of top-rated funds with an ownership interest has grown from 566 funds in Jun '14 to 1,481 funds as of Sep '18, which is a very encouraging sign of increasing institutional interest (the I criteria). |
|
|
Color Codes Explained :
Y - Better candidates highlighted by our
staff of experts.
G - Previously featured
in past reports as yellow but may no longer be buyable under the
guidelines.
***Last / Change / Volume data in this table is the closing quote data***
Symbol/Exchange
Company Name
Industry Group |
PRICE |
CHANGE
(%Change) |
Day High |
Volume
(% DAV)
(% 50 day avg vol) |
52 Wk Hi
% From Hi |
Featured
Date |
Price
Featured |
Pivot Featured |
|
Max Buy |
MLR
-
NYSE
Miller Industries Inc
AUTOMOTIVE - Auto Parts
|
$27.33
|
+0.09
0.33% |
$27.51
|
26,718
92.13% of 50 DAV
50 DAV is 29,000
|
$29.40
-7.04%
|
11/30/2018
|
$28.35
|
PP = $29.50
|
|
MB = $30.98
|
 Most Recent Note - 12/10/2018 1:04:20 PM
Y - Pulling back for a 4th consecutive session after trading within close striking distance of its 52-week high. Highlighted in yellow with pivot point cited based on its 8/10/18 high plus 10 cents in the 11/30/18 mid-day report. Faces little resistance due to overhead supply up to the $29 level. Subsequent gains above the pivot point backed by at least +40% above average volume are needed to trigger a technical buy signal. Reported earnings +95% on +28% sales revenues for the Sep '18 quarter. Recent quarterly comparisons have been above the +25% minimum earnings guideline (C criteria) and, sequentially, showed encouraging sales revenues acceleration. Annual earnings history (A criteria) has also been good. Very small supply of only 11.4 million shares outstanding (A criteria) can contribute to greater price volatility in the event of institutional buying or selling.
>>> FEATURED STOCK ARTICLE : Perched Within Striking Distance of All Time High - 12/3/2018 |
View all notes |
Set NEW NOTE alert |
Company Profile |
SEC
News |
Chart |
Request a new note
C
A
S
I |
MPX
-
NYSE
Marine Products Corp
AUTOMOTIVE - Recreational Vehicles
|
$16.99
|
-4.85
-22.21% |
$20.65
|
227,213
540.98% of 50 DAV
50 DAV is 42,000
|
$24.82
-31.55%
|
10/24/2018
|
$23.00
|
PP = $24.92
|
|
MB = $26.17
|
Most Recent Note - 12/10/2018 5:39:47 PM
It will be dropped from the Featured Stocks list tonight. Gapped down today slumping further below its 50 DMA line ($21.98) and violating the recent low ($20.25 on 10/26/18) triggering a worrisome technical sell signal.
>>> FEATURED STOCK ARTICLE : Perched Within Striking Distance of Pivot Point - 11/13/2018 |
View all notes |
Set NEW NOTE alert |
Company Profile |
SEC
News |
Chart |
Request a new note
C
A
S
I |
ZBRA
-
NASDAQ
Zebra Tech Corp Cl A
COMPUTER HARDWARE - Computer Peripherals
|
$167.87
|
+2.53
1.53% |
$169.21
|
285,854
60.18% of 50 DAV
50 DAV is 475,000
|
$184.75
-9.14%
|
11/6/2018
|
$170.41
|
PP = $179.57
|
|
MB = $188.55
|
Most Recent Note - 12/7/2018 5:14:16 PM
G - Sank below its 50 DMA line ($169) again raising concerns and its color code is changed to green. The prior lows and 200 DMA line ($155) define important near-term support to watch.
>>> FEATURED STOCK ARTICLE : Challenging High After Rebound Above 50-day Average - 11/28/2018 |
View all notes |
Set NEW NOTE alert |
Company Profile |
SEC
News |
Chart |
Request a new note
C
A
S
I |
CME
-
NASDAQ
C M E Group Inc
DIVERSIFIED SERVICES - Business/Management Services
|
$190.35
|
+3.24
1.73% |
$190.74
|
1,921,970
88.61% of 50 DAV
50 DAV is 2,169,000
|
$197.08
-3.41%
|
10/4/2018
|
$179.29
|
PP = $177.45
|
|
MB = $186.32
|
Most Recent Note - 12/10/2018 5:34:15 PM
G - Managed a positive reversal for a light volume gain today, ending near the session high. Perched near its all-time high, above its 50 DMA line ($184.23) and recent low ($183.43 on 12/06/18) defining important near-term support. Recently reported earnings +22% on +2% sales revenues for the Sep '18 quarter, below the +25% minimum earnings guideline (C criteria), raising fundamental concerns.
>>> FEATURED STOCK ARTICLE : Extended From Base After More Gain With Above Average Volume - 11/15/2018 |
View all notes |
Set NEW NOTE alert |
Company Profile |
SEC
News |
Chart |
Request a new note
C
A
S
I |
GDOT
-
NYSE
Green Dot Corp Cl A
FINANCIAL SERVICES - Credit Services
|
$79.46
|
+0.46
0.58% |
$79.95
|
343,050
70.30% of 50 DAV
50 DAV is 488,000
|
$93.00
-14.56%
|
11/8/2018
|
$90.35
|
PP = $91.61
|
|
MB = $96.19
|
Most Recent Note - 12/7/2018 5:12:21 PM
G - Still below its 50 DMA line. Its 200 DMA line and prior low ($71.50 on 10/29/18) define important near-term support. See the latest FSU analysis for more details and a new annotated graph.
>>> FEATURED STOCK ARTICLE : Recently Found Support Near 200-Day Average - 12/7/2018 |
View all notes |
Set NEW NOTE alert |
Company Profile |
SEC
News |
Chart |
Request a new note
C
A
S
I |
Symbol/Exchange
Company Name
Industry Group |
PRICE |
CHANGE
(%Change) |
Day High |
Volume
(% DAV)
(% 50 day avg vol) |
52 Wk Hi
% From Hi |
Featured
Date |
Price
Featured |
Pivot Featured |
|
Max Buy |
ULTA
-
NASDAQ
Ulta Beauty Inc
SPECIALTY RETAIL - Specialty Retail, Other
|
$251.10
|
-3.37
-1.32% |
$254.10
|
2,622,302
247.39% of 50 DAV
50 DAV is 1,060,000
|
$322.49
-22.14%
|
11/8/2018
|
$296.36
|
PP = $290.40
|
|
MB = $304.92
|
Most Recent Note - 12/10/2018 5:37:57 PM
It will be dropped from the Featured Stocks list tonight. Gapped down on the prior session violating its 50 DMA line with a damaging volume-driven loss triggering a technical sell signal and its color code was changed to green. Members were previously reminded - "Volume and volatility often increase near earnings news."
>>> FEATURED STOCK ARTICLE : Damaging Technical Action Following Latest Strong Earnings Report - 12/10/2018 |
View all notes |
Set NEW NOTE alert |
Company Profile |
SEC
News |
Chart |
Request a new note
C
A
S
I |
UBNT
-
NASDAQ
Ubiquiti Networks
TELECOMMUNICATIONS - Diversified Communication Serv
|
$108.98
|
+2.50
2.35% |
$109.31
|
286,871
59.76% of 50 DAV
50 DAV is 480,000
|
$114.89
-5.14%
|
11/9/2018
|
$108.20
|
PP = $101.43
|
|
MB = $106.50
|
Most Recent Note - 12/7/2018 5:17:47 PM
G - Retreated from its all-time high with recent losses on lighter volume. Prior high ($101.33 on 9/25/18) defines initial support to watch on pullbacks.
>>> FEATURED STOCK ARTICLE : Pullback Following Breakout Gain on After Latest Earnings Report - 11/12/2018 |
View all notes |
Set NEW NOTE alert |
Company Profile |
SEC
News |
Chart |
Request a new note
C
A
S
I |
PRAH
-
NASDAQ
P R A Health Sciences
HEALTH SERVICES - Medical Laboratories and Researc
|
$104.90
|
+1.83
1.78% |
$105.78
|
715,486
137.59% of 50 DAV
50 DAV is 520,000
|
$121.98
-14.00%
|
11/30/2018
|
$117.06
|
PP = $112.98
|
|
MB = $118.63
|
Most Recent Note - 12/7/2018 5:20:19 PM
G - Color code is changed to green after a 4th consecutive loss undercut its 50 DMA line ($103.25). Undercut its pivot point after a noted "negative reversal".
>>> FEATURED STOCK ARTICLE : Streak of Gains For New Highs Marked by Increasing Volume - 11/30/2018 |
View all notes |
Set NEW NOTE alert |
Company Profile |
SEC
News |
Chart |
Request a new note
C
A
S
I |
PLNT
-
NYSE
Planet Fitness Inc Cl A
Leisure-Services
|
$53.58
|
+0.12
0.22% |
$54.47
|
916,824
72.08% of 50 DAV
50 DAV is 1,272,000
|
$58.50
-8.41%
|
11/7/2018
|
$57.10
|
PP = $55.45
|
|
MB = $58.22
|
Most Recent Note - 12/7/2018 1:10:10 PM
Y - Pulling back further today following a "negative reversal" on 12/04/18 after it touched a new all-time high. Its 50 DMA line and recent low ($48.02 on 11/20/18) define important near-term support to watch on pullbacks.
>>> FEATURED STOCK ARTICLE : Fitness Firm Perched Near All-Time High - 11/29/2018 |
View all notes |
Set NEW NOTE alert |
Company Profile |
SEC
News |
Chart |
Request a new note
C
A
S
I |
MEDP
-
NASDAQ
Medpace Holdings Inc
Medical-Research Eqp/Svc
|
$57.70
|
-0.01
-0.02% |
$59.34
|
616,264
110.24% of 50 DAV
50 DAV is 559,000
|
$65.09
-11.35%
|
12/3/2018
|
$63.43
|
PP = $65.19
|
|
MB = $68.45
|
Most Recent Note - 12/7/2018 5:15:59 PM
Y - Pulled back today for a 3rd consecutive loss since highlighted in yellow with pivot point cited based on its 9/17/18 high plus 10 cents in the 12/03/18 mid-day report. Subsequent gains above the pivot point backed by a least +40% above average volume may trigger a technical buy signal. Reported earnings +68% on +62% sales revenues for the Sep '18 quarter marking the 3rd consecutive comparison above the +25% minimum earnings guideline (C criteria).
>>> FEATURED STOCK ARTICLE : Pullback After 9 Straight Gains Challenged High - 12/4/2018 |
View all notes |
Set NEW NOTE alert |
Company Profile |
SEC
News |
Chart |
Request a new note
C
A
S
I |
Symbol/Exchange
Company Name
Industry Group |
PRICE |
CHANGE
(%Change) |
Day High |
Volume
(% DAV)
(% 50 day avg vol) |
52 Wk Hi
% From Hi |
Featured
Date |
Price
Featured |
Pivot Featured |
|
Max Buy |
INVA
-
NASDAQ
Innoviva Inc
Medical-Biomed/Biotech
|
$17.62
|
-0.02
-0.11% |
$17.79
|
742,048
63.10% of 50 DAV
50 DAV is 1,176,000
|
$18.60
-5.27%
|
11/23/2018
|
$17.74
|
PP = $18.09
|
|
MB = $18.99
|
Most Recent Note - 12/10/2018 5:35:31 PM
Y - Still holding its ground with volume totals cooling while perched near its all-time high. Subsequent gains and a strong close above the pivot point backed by at least +40% above average volume may clinch a technical buy signal.
>>> FEATURED STOCK ARTICLE : Bullish Action in Biotech Firm With Strong Earnings History - 11/23/2018 |
View all notes |
Set NEW NOTE alert |
Company Profile |
SEC
News |
Chart |
Request a new note
C
A
S
I |
|
|
|
THESE ARE NOT BUY RECOMMENDATIONS!
Comments contained in the body of this report are technical
opinions only. The material herein has been obtained
from sources believed to be reliable and accurate, however,
its accuracy and completeness cannot be guaranteed.
This site is not an investment advisor, hence it does
not endorse or recommend any securities or other investments.
Any recommendation contained in this report may not
be suitable for all investors and it is not to be deemed
an offer or solicitation on our part with respect to
the purchase or sale of any securities. All trademarks,
service marks and trade names appearing in this report
are the property of their respective owners, and are
likewise used for identification purposes only.
This report is a service available
only to active Paid Premium Members.
You may opt-out of receiving report notifications
at any time. Questions or comments may be submitted
by writing to Premium Membership Services 665 S.E. 10 Street, Suite 201 Deerfield Beach, FL 33441-5634 or by calling 1-800-965-8307
or 954-785-1121.
|
|
|