You are not logged in.
This means you
CAN ONLY VIEW reports that were published prior to Sunday, February 18, 2024.
You
MUST UPGRADE YOUR MEMBERSHIP if you want to see any current reports.
AFTER MARKET UPDATE - THURSDAY, DECEMBER 6TH, 2018
Previous After Market Report Next After Market Report >>>
|
|
|
|
DOW |
-79.40 |
24,947.67 |
-0.32% |
|
Volume |
1,284,775,220 |
+13% |
|
Volume |
2,819,408,100 |
+9% |
|
NASDAQ |
+29.83 |
7,188.26 |
+0.42% |
|
Advancers |
1,167 |
39% |
|
Advancers |
1,196 |
38% |
|
S&P 500 |
-4.11 |
2,695.95 |
-0.15% |
|
Decliners |
1,845 |
61% |
|
Decliners |
1,917 |
62% |
|
Russell 2000 |
-3.30 |
1,477.45 |
-0.22% |
|
52 Wk Highs |
35 |
|
|
52 Wk Highs |
9 |
|
|
S&P 600 |
-2.63 |
922.43 |
-0.28% |
|
52 Wk Lows |
648 |
|
|
52 Wk Lows |
465 |
|
|
 |
Indices Undercut Day 1 Lows Killing Brief New Rally
Kenneth J. Gruneisen - Passed the CAN SLIM® Master's Exam
Stocks finished mixed Thursday. The Dow fell 79 points to 24947 while the S&P 500 declined 4 points to 2695. The Nasdaq Composite added 29 points to 7188. The volume totals on the session were higher than the prior session totals on the NYSE and on the Nasdaq exchange, indicative of distributional pressure. Breadth was negative as decliners led advancers by a 3-2 margin on the NYSE and on the Nasdaq exchange. There were 7 high-ranked companies from the Leaders List that made new 52-week highs and were listed on the BreakOuts Page, versus 30 on the prior session. New 52-week lows totals swelled and solidly outnumbered shrinking new 52-week highs totals on the NYSE and on the Nasdaq exchange. The major indices (M criteria) are in a correction again after Thursday's early losses violated the recent Day 1 lows. New buying efforts are not justified under the fact-based investment system's rules until a new confirmed rally is noted. The Featured Stocks Page provides the most timely analysis on high-ranked leaders. Strict buying and selling rules should always be followed on a case by case basis. Charts used courtesy of www.stockcharts.com
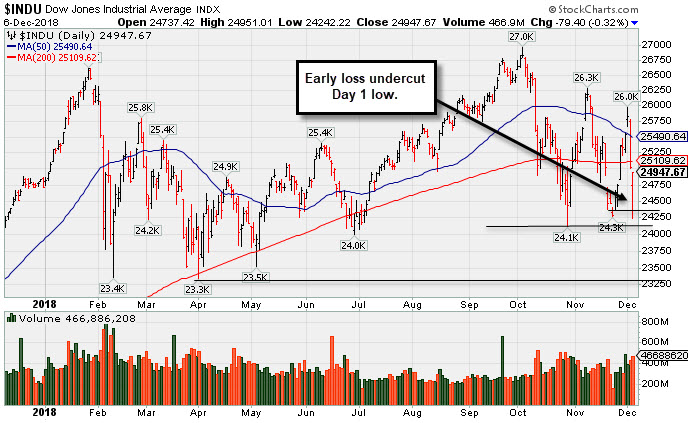
PICTURED: The Dow Jones Industrial Average's brief new rally ended quickly as early losses undercut the Day 1 low.
The major averages recovered from steep losses as investors assessed a late update from the Federal Reserve. U.S equities pared losses after a report that the central bank was considering a more cautious approach to future rate hikes. Trade tensions also garnered attention as Canadian authorities arrested the CFO of Huawei Technologies at the request of United States. The move angered Chinese officials and raised doubts that the two nations will secure a new trade pact.
Energy shares underperformed as uncertainty over OPEC’s proposed supply cuts caused WTI crude to decline 2.3% to $51.70. Financials finished broadly lower, as a flattening yield curve caused the group to fall nearly 1.4%. Technology stocks outperformed as IBM (IBM +1.9%) and Facebook (FB +1.2%) rose.
On the data front, the U.S. trade deficit widened more-than-expected to $55.5 billion. Separate updates on employment showed private payrolls increased less than expected last month while initial jobless claims eased slightly from a six month high. An update on the services sector from the ISM showed activity accelerated to near a record high in in November.
Treasuries finished stronger as the yield on the benchmark 10-year note fell two basis points to 2.88%. Gold added 0.1% to $1238.10/ounce. |
 Kenneth J. Gruneisen started out as a licensed stockbroker in August 1987, a couple of months prior to the historic stock market crash that took the Dow Jones Industrial Average down -22.6% in a single day. He has published daily fact-based fundamental and technical analysis on high-ranked stocks online for two decades. Through FACTBASEDINVESTING.COM, Kenneth provides educational articles, news, market commentary, and other information regarding proven investment systems that work in good times and bad.
Comments contained in the body of this report are technical opinions only and are not necessarily those of Gruneisen Growth Corp. The material herein has been obtained from sources believed to be reliable and accurate, however, its accuracy and completeness cannot be guaranteed. Our firm, employees, and customers may effect transactions, including transactions contrary to any recommendation herein, or have positions in the securities mentioned herein or options with respect thereto. Any recommendation contained in this report may not be suitable for all investors and it is not to be deemed an offer or solicitation on our part with respect to the purchase or sale of any securities. |
|
 |
Retail, Networking, Biotech, and Gold & Silver indexes Rose
Kenneth J. Gruneisen - Passed the CAN SLIM® Master's Exam
The Retail Index ($RLX +0.94%) rose while the Broker/Dealer Index ($XBD -0.14%) edged lower and the Bank Index ($BKX -1.62%) suffered a larger loss. The tech sector was mixed as the Semiconductor Index ($SOX -0.54%) edged lower while the Biotech Index ($BTK +0.38%) edged higher and the Networking Index ($NWX +1.43%) posted a larger gain. Energy-linked groups also fell as the Oil Services Index ($OSX -4.38%) and Integrated Oil Index ($XOI -1.65%) both sank, meanwhile the Gold & Silver Index ($XAU +0.28%) eked out a small gain.
Charts courtesy of www.stockcharts.com,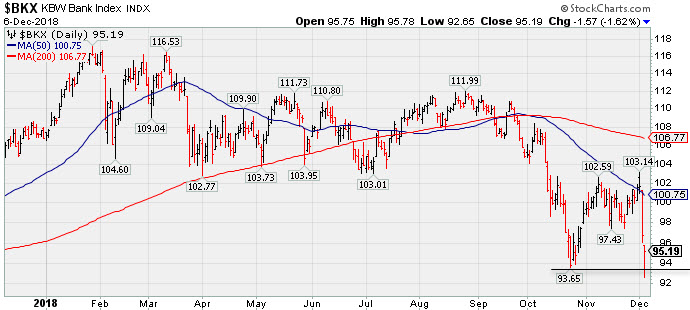 PICTURED: The Bank Index ($BKX -1.62%) met resistance near its 50-day moving average (DMA) line and abruptly retreated undercutting the recent low.
| Oil Services |
$OSX |
98.69 |
-4.52 |
-4.38% |
-34.01% |
| Integrated Oil |
$XOI |
1,281.25 |
-21.46 |
-1.65% |
-4.07% |
| Semiconductor |
$SOX |
1,202.83 |
-6.52 |
-0.54% |
-4.01% |
| Networking |
$NWX |
512.13 |
+7.21 |
+1.43% |
+4.40% |
| Broker/Dealer |
$XBD |
252.68 |
-0.35 |
-0.14% |
-4.73% |
| Retail |
$RLX |
2,109.13 |
+19.73 |
+0.94% |
+21.65% |
| Gold & Silver |
$XAU |
66.35 |
+0.19 |
+0.29% |
-22.19% |
| Bank |
$BKX |
95.19 |
-1.57 |
-1.62% |
-10.80% |
| Biotech |
$BTK |
4,633.34 |
+17.37 |
+0.38% |
+9.74% |
|
|
|
 |
|
|
|
Color Codes Explained :
Y - Better candidates highlighted by our
staff of experts.
G - Previously featured
in past reports as yellow but may no longer be buyable under the
guidelines.
***Last / Change / Volume data in this table is the closing quote data***
Symbol/Exchange
Company Name
Industry Group |
PRICE |
CHANGE
(%Change) |
Day High |
Volume
(% DAV)
(% 50 day avg vol) |
52 Wk Hi
% From Hi |
Featured
Date |
Price
Featured |
Pivot Featured |
|
Max Buy |
MLR
-
NYSE
Miller Industries Inc
AUTOMOTIVE - Auto Parts
|
$27.60
|
-0.51
-1.81% |
$28.05
|
35,381
131.04% of 50 DAV
50 DAV is 27,000
|
$29.40
-6.12%
|
11/30/2018
|
$28.35
|
PP = $29.50
|
|
MB = $30.98
|
 Most Recent Note - 12/6/2018 12:27:48 PM
Y - Quietly consolidating within striking distance of its 52-week high. Highlighted in yellow with pivot point cited based on its 8/10/18 high plus 10 cents in the 11/30/18 mid-day report. Faces little resistance due to overhead supply up to the $29 level. Subsequent gains above the pivot point backed by at least +40% above average volume are needed to trigger a technical buy signal. Reported earnings +95% on +28% sales revenues for the Sep '18 quarter. Recent quarterly comparisons have been above the +25% minimum earnings guideline (C criteria) and, sequentially, showed encouraging sales revenues acceleration. Annual earnings history (A criteria) has also been good. Very small supply of only 11.4 million shares outstanding (A criteria) can contribute to greater price volatility in the event of institutional buying or selling. See the latest FSU analysis for more details and an annotated graph.
>>> FEATURED STOCK ARTICLE : Perched Within Striking Distance of All Time High - 12/3/2018 |
View all notes |
Set NEW NOTE alert |
Company Profile |
SEC
News |
Chart |
Request a new note
C
A
S
I |
MPX
-
NYSE
Marine Products Corp
AUTOMOTIVE - Recreational Vehicles
|
$21.84
|
+0.34
1.58% |
$22.31
|
63,009
140.02% of 50 DAV
50 DAV is 45,000
|
$24.82
-12.01%
|
10/24/2018
|
$23.00
|
PP = $24.92
|
|
MB = $26.17
|
Most Recent Note - 12/6/2018 12:29:05 PM
G - Hovering near its 50 DMA line ($22.08) and above the recent low ($20.25 on 10/26/18) previously noted as important near-term support. Subsequent gains above the pivot point backed by at least +40% above average volume may trigger a technical buy signal.
>>> FEATURED STOCK ARTICLE : Perched Within Striking Distance of Pivot Point - 11/13/2018 |
View all notes |
Set NEW NOTE alert |
Company Profile |
SEC
News |
Chart |
Request a new note
C
A
S
I |
ZBRA
-
NASDAQ
Zebra Tech Corp Cl A
COMPUTER HARDWARE - Computer Peripherals
|
$172.58
|
+1.56
0.91% |
$172.75
|
268,318
56.49% of 50 DAV
50 DAV is 475,000
|
$184.75
-6.59%
|
11/6/2018
|
$170.41
|
PP = $179.57
|
|
MB = $188.55
|
Most Recent Note - 12/4/2018 4:00:56 PM
Y - Slumped back toward its 50 DMA line ($169). The prior lows and 200 DMA line ($154) define important near-term support to watch. See the latest FSU analysis for more details and an annotated graph.
>>> FEATURED STOCK ARTICLE : Challenging High After Rebound Above 50-day Average - 11/28/2018 |
View all notes |
Set NEW NOTE alert |
Company Profile |
SEC
News |
Chart |
Request a new note
C
A
S
I |
CME
-
NASDAQ
C M E Group Inc
DIVERSIFIED SERVICES - Business/Management Services
|
$189.02
|
+0.82
0.44% |
$189.16
|
2,826,184
132.56% of 50 DAV
50 DAV is 2,132,000
|
$197.08
-4.09%
|
10/4/2018
|
$179.29
|
PP = $177.45
|
|
MB = $186.32
|
Most Recent Note - 12/4/2018 5:26:01 PM
G - Enduring distributional pressure in recent weeks yet still remaining near its all-time high. Its 50 DMA line ($183.27) defines near-term support. Strength continued after reporting earnings +22% on +2% sales revenues for the Sep '18 quarter, below the +25% minimum earnings guideline (C criteria), raising fundamental concerns.
>>> FEATURED STOCK ARTICLE : Extended From Base After More Gain With Above Average Volume - 11/15/2018 |
View all notes |
Set NEW NOTE alert |
Company Profile |
SEC
News |
Chart |
Request a new note
C
A
S
I |
GDOT
-
NYSE
Green Dot Corp Cl A
FINANCIAL SERVICES - Credit Services
|
$78.96
|
-0.04
-0.05% |
$79.15
|
639,826
136.13% of 50 DAV
50 DAV is 470,000
|
$93.00
-15.10%
|
11/8/2018
|
$90.35
|
PP = $91.61
|
|
MB = $96.19
|
Most Recent Note - 12/4/2018 3:59:36 PM
G - Slumping back below its 50 DMA line. It has not formed a sound base. Its 200 DMA line and prior low ($71.50 on 10/29/18) define important near-term support.
>>> FEATURED STOCK ARTICLE : Volume Heavy Behind Rally to New High - 11/8/2018 |
View all notes |
Set NEW NOTE alert |
Company Profile |
SEC
News |
Chart |
Request a new note
C
A
S
I |
Symbol/Exchange
Company Name
Industry Group |
PRICE |
CHANGE
(%Change) |
Day High |
Volume
(% DAV)
(% 50 day avg vol) |
52 Wk Hi
% From Hi |
Featured
Date |
Price
Featured |
Pivot Featured |
|
Max Buy |
ULTA
-
NASDAQ
Ulta Beauty Inc
SPECIALTY RETAIL - Specialty Retail, Other
|
$292.92
|
+1.79
0.61% |
$293.55
|
1,658,336
170.79% of 50 DAV
50 DAV is 971,000
|
$322.49
-9.17%
|
11/8/2018
|
$296.36
|
PP = $290.40
|
|
MB = $304.92
|
Most Recent Note - 12/6/2018 12:46:05 PM
Y - Testing the prior high ($290) and its 50 DMA line ($287) amid broad-based market weakness (M criteria). Due to report earnings news after the close. Volume and volatility often increase near earnings news.
>>> FEATURED STOCK ARTICLE : Volume Driven Gains Indicate Institutional Buying Demand - 11/9/2018 |
View all notes |
Set NEW NOTE alert |
Company Profile |
SEC
News |
Chart |
Request a new note
C
A
S
I |
UBNT
-
NASDAQ
Ubiquiti Networks
TELECOMMUNICATIONS - Diversified Communication Serv
|
$110.64
|
+2.06
1.90% |
$110.96
|
328,246
68.67% of 50 DAV
50 DAV is 478,000
|
$114.89
-3.70%
|
11/9/2018
|
$108.20
|
PP = $101.43
|
|
MB = $106.50
|
Most Recent Note - 12/4/2018 5:34:09 PM
G - Retreated from its all-time high with a big loss today on lighter volume. Prior high ($101.33 on 9/25/18) defines initial support to watch on pullbacks.
>>> FEATURED STOCK ARTICLE : Pullback Following Breakout Gain on After Latest Earnings Report - 11/12/2018 |
View all notes |
Set NEW NOTE alert |
Company Profile |
SEC
News |
Chart |
Request a new note
C
A
S
I |
PRAH
-
NASDAQ
P R A Health Sciences
HEALTH SERVICES - Medical Laboratories and Researc
|
$106.34
|
-4.45
-4.02% |
$108.89
|
976,726
193.79% of 50 DAV
50 DAV is 504,000
|
$121.98
-12.82%
|
11/30/2018
|
$117.06
|
PP = $112.98
|
|
MB = $118.63
|
Most Recent Note - 12/6/2018 12:36:05 PM
Y - Down considerably today. Markets are widely negative for a 2nd consecutive session, immediately reversing after a new confirmed market rally (M criteria) was noted in the latest Market Commentary (read here). Undercut its pivot point on the prior session raising concerns after a noted "negative reversal".
>>> FEATURED STOCK ARTICLE : Streak of Gains For New Highs Marked by Increasing Volume - 11/30/2018 |
View all notes |
Set NEW NOTE alert |
Company Profile |
SEC
News |
Chart |
Request a new note
C
A
S
I |
HQY
-
NASDAQ
Healthequity Inc
COMPUTER SOFTWARE and SERVICES - Healthcare Information Service
|
$74.03
|
-9.57
-11.45% |
$78.00
|
2,895,157
417.77% of 50 DAV
50 DAV is 693,000
|
$101.58
-27.12%
|
11/2/2018
|
$95.56
|
PP = $100.09
|
|
MB = $105.09
|
Most Recent Note - 12/6/2018 6:15:35 PM
G - Reported earnings +65% on +24% sales revenues for the Oct '18 quarter. Gapped down today and violated its 200 DMA line and prior lows raising more serious concerns. Only a prompt rebound would help its outlook improve.
>>> FEATURED STOCK ARTICLE : Found Support at 200-Day Average But Faces Overhead Supply - 11/26/2018 |
View all notes |
Set NEW NOTE alert |
Company Profile |
SEC
News |
Chart |
Request a new note
C
A
S
I |
OLLI
-
NASDAQ
Ollie's Bargain Outlet
Retail-DiscountandVariety
|
$71.90
|
-14.93
-17.19% |
$80.64
|
5,376,493
795.34% of 50 DAV
50 DAV is 676,000
|
$97.61
-26.34%
|
11/16/2018
|
$90.70
|
PP = $97.71
|
|
MB = $102.60
|
Most Recent Note - 12/6/2018 6:17:53 PM
G - Reported earnings +45% on +19% sales revenues for the Oct '18 quarter. Gapped down and violated its 200 DMA line with a big volume driven loss triggering a technical sell signal. Only a prompt rebound would help its outlook improve.
>>> FEATURED STOCK ARTICLE : Consolidating Near 50-Day Average Forming New Base - 11/16/2018 |
View all notes |
Set NEW NOTE alert |
Company Profile |
SEC
News |
Chart |
Request a new note
C
A
S
I |
Symbol/Exchange
Company Name
Industry Group |
PRICE |
CHANGE
(%Change) |
Day High |
Volume
(% DAV)
(% 50 day avg vol) |
52 Wk Hi
% From Hi |
Featured
Date |
Price
Featured |
Pivot Featured |
|
Max Buy |
PLNT
-
NYSE
Planet Fitness Inc Cl A
Leisure-Services
|
$56.23
|
+0.60
1.08% |
$56.25
|
1,138,939
85.51% of 50 DAV
50 DAV is 1,332,000
|
$58.50
-3.88%
|
11/7/2018
|
$57.10
|
PP = $55.45
|
|
MB = $58.22
|
Most Recent Note - 12/4/2018 5:27:41 PM
Y - There was a "negative reversal" today after it touched a new all-time high. Its 50 DMA line and recent low ($48.02 on 11/20/18) define important near-term support to watch on pullbacks.
>>> FEATURED STOCK ARTICLE : Fitness Firm Perched Near All-Time High - 11/29/2018 |
View all notes |
Set NEW NOTE alert |
Company Profile |
SEC
News |
Chart |
Request a new note
C
A
S
I |
MEDP
-
NASDAQ
Medpace Holdings Inc
Medical-Research Eqp/Svc
|
$59.67
|
-1.73
-2.82% |
$60.71
|
733,475
131.92% of 50 DAV
50 DAV is 556,000
|
$65.09
-8.33%
|
12/3/2018
|
$63.43
|
PP = $65.19
|
|
MB = $68.45
|
Most Recent Note - 12/4/2018 5:23:30 PM
Y - Pulled back today. Highlighted in yellow with pivot point cited based on its 9/17/18 high plus 10 cents in the 12/03/18 mid-day report. Subsequent gains above the pivot point backed by a least +40% above average volume may trigger a technical buy signal. Reported earnings +68% on +62% sales revenues for the Sep '18 quarter marking the 3rd consecutive comparison above the +25% minimum earnings guideline (C criteria). See the latest FSU analysis for more details and a new annotated graph.
>>> FEATURED STOCK ARTICLE : Pullback After 9 Straight Gains Challenged High - 12/4/2018 |
View all notes |
Set NEW NOTE alert |
Company Profile |
SEC
News |
Chart |
Request a new note
C
A
S
I |
INVA
-
NASDAQ
Innoviva Inc
Medical-Biomed/Biotech
|
$17.86
|
+0.25
1.42% |
$17.86
|
917,968
79.20% of 50 DAV
50 DAV is 1,159,000
|
$18.60
-3.98%
|
11/23/2018
|
$17.74
|
PP = $18.09
|
|
MB = $18.99
|
Most Recent Note - 12/4/2018 5:29:54 PM
Y - Churning above average volume the past 2 sessions while perched near its all-time high, encountering distributional pressure. Subsequent gains and a strong close above the pivot point backed by at least +40% above average volume may clinch a technical buy signal.
>>> FEATURED STOCK ARTICLE : Bullish Action in Biotech Firm With Strong Earnings History - 11/23/2018 |
View all notes |
Set NEW NOTE alert |
Company Profile |
SEC
News |
Chart |
Request a new note
C
A
S
I |
|
|
|
THESE ARE NOT BUY RECOMMENDATIONS!
Comments contained in the body of this report are technical
opinions only. The material herein has been obtained
from sources believed to be reliable and accurate, however,
its accuracy and completeness cannot be guaranteed.
This site is not an investment advisor, hence it does
not endorse or recommend any securities or other investments.
Any recommendation contained in this report may not
be suitable for all investors and it is not to be deemed
an offer or solicitation on our part with respect to
the purchase or sale of any securities. All trademarks,
service marks and trade names appearing in this report
are the property of their respective owners, and are
likewise used for identification purposes only.
This report is a service available
only to active Paid Premium Members.
You may opt-out of receiving report notifications
at any time. Questions or comments may be submitted
by writing to Premium Membership Services 665 S.E. 10 Street, Suite 201 Deerfield Beach, FL 33441-5634 or by calling 1-800-965-8307
or 954-785-1121.
|
|
|

