Help Lines 954-785-1121


You are not logged in. Upgrade Here
 <<<Previous Mid Day Report     Next Mid Day Report >>> 
 <<<Previous After Market Report Next After Market Report >>> 
You are not logged in.
This means you CAN ONLY VIEW reports that were published prior to Monday, February 19, 2024.
You MUST UPGRADE YOUR MEMBERSHIP if you want to see any current reports.

AFTER MARKET UPDATE - WEDNESDAY, DECEMBER 4TH, 2019
Previous After Market Report Next After Market Report >>>
Indices NYSE Nasdaq
DOW  +146.97 27,649.78 +0.53% Volume 934,384,460 +9% Volume 2,143,413,040 -7%
NASDAQ +46.03 8,566.67 +0.54% Advancers 1,977 69% Advancers 1,926 62%
S&P 500 +19.56 3,112.76 +0.63% Decliners 903 31% Decliners 1,183 38%
Russell 2000 +11.27 1,613.90 +0.70% 52 Wk Highs 72   52 Wk Highs 79  
S&P 600 +7.78 985.29 +0.80% 52 Wk Lows 14   52 Wk Lows 52  

Breadth Positive as Major Indicess Rose With Greater Leadership

The Dow gained 146 points, while the S&P 500 added 0.6%. The Nasdaq Composite rose 0.5%. Breadth was positive as advancers led decliners by a 2-1 margin on the NYSE and 3-2 on the Nasdaq exchange. The volume totals were mixed, higher than the prior session on the NYSE and lower on the Nasdaq exchange. Leadership improved as there were 28 high-ranked companies from the Leaders List that hit a new 52-week high and were listed on the BreakOuts Page, versus the total of 8 on the prior session. New 52-week highs totals expanded and outnumbered shrinking new 52-week lows totals on the NYSE and on the Nasdaq exchange. The major indices (M criteria) are in a "confirmed uptrend" after enduring distributional pressure in recent weeks. The Featured Stocks Page provides the most timely analysis on high-ranked leaders.

Charts used courtesy of www.stockcharts.com

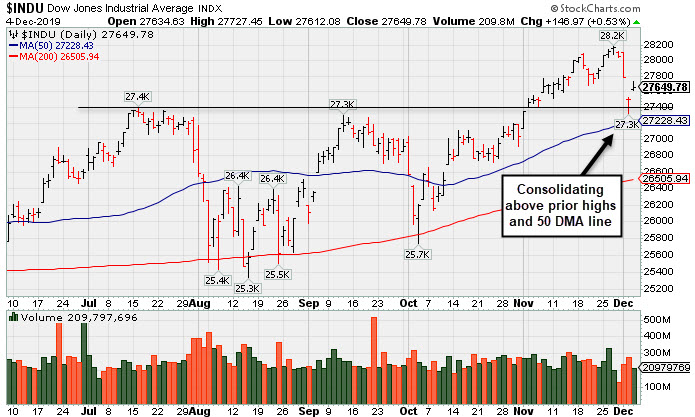
PICTURED: The Dow Jones Industrial Average posted a gain today after a 3-day pullback from its record high toward prior highs and its 50-day moving average (DMA) line. 

Stocks finished higher Wednesday, rebounding from a three-day slide on renewed U.S.-China trade optimism. Reports suggested that Washington and Beijing are close to finalizing the amount of tariffs each side would rescind in a preliminary trade pact. Meanwhile, President Trump commented that the negotiations are going “very well,” despite previously suggesting that a deal could wait until after the 2020 U.S. presidential election. 

On the data front, the Institute for Supply Management revealed that the pace of U.S. services sector expansion slowed last month. However, underlying components were mixed, with improvements in both new orders and employment helping to offset a sharp drop in business activity. Separately, the ADP reported that only 67,000 private payrolls were added in November, the lowest in six months and second-worst reading since 2010.

Treasuries erased the week’s gains, with the yield on the 10-year note up six basis points to 1.77%. In commodities, WTI crude jumped more than 4% to $58.40/barrel, notching its best day since mid-September on reports that “key members” of OPEC prefer deeper supply curbs ahead of tomorrow’s cartel meeting. Oil prices were also supported by larger-than-expected drawdown in U.S. crude stockpiles.

All 11 S&P 500 sectors closed in positive territory with Energy and Financials advancing at least 1%. In earnings, Salesforce.com (CRM -3.18%) after the business software provider reported a net loss during the third quarter. Human resources software company Workday (WDAY -4.67%) fell following a disappointing forward outlook.

Kenneth J. Gruneisen started out as a licensed stockbroker in August 1987, a couple of months prior to the historic stock market crash that took the Dow Jones Industrial Average down -22.6% in a single day. He has published daily fact-based fundamental and technical analysis on high-ranked stocks online for two decades. Through FACTBASEDINVESTING.COM, Kenneth provides educational articles, news, market commentary, and other information regarding proven investment systems that work in good times and bad.

Comments contained in the body of this report are technical opinions only and are not necessarily those of Gruneisen Growth Corp. The material herein has been obtained from sources believed to be reliable and accurate, however, its accuracy and completeness cannot be guaranteed. Our firm, employees, and customers may effect transactions, including transactions contrary to any recommendation herein, or have positions in the securities mentioned herein or options with respect thereto. Any recommendation contained in this report may not be suitable for all investors and it is not to be deemed an offer or solicitation on our part with respect to the purchase or sale of any securities.


Financial, Tech, and Energy-Linked Groups Rose

The Broker/Dealer Index ($XBD +0.79%) and Bank Index ($BKX +1.20%) both posted solid gains while the Retail Index ($RLX +0.17%) lagged. The tech sector was led by the Semiconductor Index ($SOX +1.55%) and the Biotech Index ($BTK +1.15%) while the Networking Index ($NWX -0.22%) suffered a small loss. The Oil Services Index ($OSX +3.54%) and the Integrated Oil Index ($XOI +1.57%) both rose while the Gold & Silver Index ($XAU -0.47%) ended slightly lower
Charts courtesy of www.stockcharts.com

PICTURED: The Integrated Oil Index ($XOI +1.57%) has been sputtering below its 50-day and 200-day moving average (DMA) lines.

Industry Index Symbol Close Change % Change YTD % Change
Oil Services $OSX  68.57 +2.35 +3.55% -14.93%
Integrated Oil $XOI  1,201.01 +18.51 +1.57% +3.62%
Semiconductor $SOX  1,691.45 +25.74 +1.55% +46.42%
Networking $NWX  564.29 -1.26 -0.22% +15.48%
Broker/Dealer $XBD  286.01 +2.25 +0.79% +20.51%
Retail $RLX  2,359.06 +3.99 +0.17% +20.89%
Gold & Silver $XAU  97.51 -0.46 -0.47% +38.00%
Bank $BKX  108.76 +1.28 +1.19% +26.77%
Biotech $BTK  5,059.72 +57.28 +1.15% +19.87%


Miller Still Quietly Hovering Above Prior Highs

Miller Industries Inc (MLR -$0.42 or -1.17% to $35.61) pulled back today for a 4th consecutive loss with light volume, yet still remains perched near its 52-week high. Prior highs in the $35 area define initial support above its 50 DMA line ($34.39).

MLR has shown resilience after recently reporting earnings which were below the fundamental guidelines of the fact-based investment system.
It reported earnings -7% on +0% sales revenues for the Sep '19 quarter versus the year ago period, below the +25% minimum guideline (C criteria) raising fundamental concerns.

MLR's annual earnings history (A criteria) has been good. The very small supply of only 11.4 million shares outstanding (S criteria) can contribute to greater price volatility in the event of institutional buying or selling. It returned to the Featured Stocks list on 9/24/19 when highlighted in yellow in the mid-day report (read here). It was last shown in this FSU section on 11/15/19 with an annotated graph under the headline, "Showing Resilience After Latest Quarter Missed Minimum Guidelines"

The number of top-rated funds owning its shares rose from 196 in Mar '18 to 250 in Sep '19, a reassuring sign concerning the I criteria. The current Up/Down Volume Ratio of 0.9 is an unbiased indication its shares have been under slight distributional pressure over the past 50 days. It has earned a C Timeliness rating and a E Sponsorship Rating.

Charts courtesy of www.stockcharts.com


Color Codes Explained :
Y - Better candidates highlighted by our staff of experts.
G - Previously featured in past reports as yellow but may no longer be buyable under the guidelines.

***Last / Change / Volume data in this table is the closing quote data***
Symbol/Exchange
Company Name
Industry Group
PRICE CHANGE
(%Change)
Day High Volume
(% DAV)
(% 50 day avg vol)
52 Wk Hi
% From Hi
Featured
Date
Price
Featured
Pivot Featured
Max Buy
StockCharts.com Latest Chart for MLR MLR - NYSE
Miller Industries Inc
AUTOMOTIVE - Auto Parts  
$35.61 -0.42
-1.17%

$36.39

29,155
64.79% of 50 DAV
50 DAV is 45,000
$37.70
-5.54%
9/24/2019 $34.00 PP = $35.36
MB = $37.13
Most Recent Note - 12/4/2019 5:45:57 PM
Y - Pulled back today for a 4th consecutive loss with light volume, remaining near its 52-week high. Prior highs in the $35 area define initial support above its 50 DMA line ($34.39). Showed resilience after recently reporting earnings which were below the fundamental guidelines of the fact-based investment system. See the latest FSU analysis for more details and a new annotated graph.
>>> FEATURED STOCK ARTICLE : Miller Still Quietly Hovering Above Prior Highs - 12/4/2019
 |  View all notes | Set NEW NOTE alert | Company Profile | SEC News | Chart | Request a new note C A  S  I 
StockCharts.com Latest Chart for CCBG CCBG - NASDAQ
Capital City Bk Gp
BANKING - Regional - Mid-Atlantic Banks  
$28.65 +0.35
1.24%

$28.90

25,668
62.60% of 50 DAV
50 DAV is 41,000
$30.85
-7.13%
9/13/2019 $27.03 PP = $27.05
MB = $28.40
Most Recent Note - 12/4/2019 5:49:11 PM
G - Posted a gain today with light volume after it tested its 50 DMA line ($28.31) and prior highs which define important support to watch. More damaging losses would raise concerns and trigger a technical sell signal.
>>> FEATURED STOCK ARTICLE : Consolidating After Volume-Driven Gains for New Highs - 11/19/2019
 |  View all notes | Set NEW NOTE alert | Company Profile | SEC News | Chart | Request a new note C A  S  I 
StockCharts.com Latest Chart for FTNT FTNT - NASDAQ
Fortinet Inc
Computer Sftwr-Security  
$103.57 -0.23
-0.22%

$104.50

1,107,085
80.75% of 50 DAV
50 DAV is 1,371,000
$106.00
-2.29%
11/11/2019 $97.14 PP = $97.06
MB = $101.91
Most Recent Note - 12/2/2019 12:33:21 PM
G - Stubbornly holding its ground after getting extended from the prior base. Prior high in the $97 area defines initial support to watch on pullbacks.
>>> FEATURED STOCK ARTICLE : Extended From Prior Base Perched Near Record HIgh - 12/2/2019
 |  View all notes | Set NEW NOTE alert | Company Profile | SEC News | Chart | Request a new note C A  S  I 
StockCharts.com Latest Chart for SPSC SPSC - NASDAQ
S P S Commerce Inc
COMPUTER SOFTWARE and SERVICES - Application Software  
$55.59 -0.27
-0.48%

$56.37

239,502
120.35% of 50 DAV
50 DAV is 199,000
$59.14
-6.00%
11/29/2019 $56.59 PP = $59.24
MB = $62.20
Most Recent Note - 12/4/2019 5:56:20 PM
Y - Finished lower with today's 5th consecutive loss after stalling near its all-time high. Subsequent gains above its pivot point backed by at least +40% above average volume are needed to trigger a new technical buy signal. Fundamentals remain strong.
>>> FEATURED STOCK ARTICLE : Rebound Leaves Supply Chain Management Software Firm Near High - 11/29/2019
 |  View all notes | Set NEW NOTE alert | Company Profile | SEC News | Chart | Request a new note C A  S  I 
StockCharts.com Latest Chart for AUDC AUDC - NASDAQ
Audiocodes Ltd
ELECTRONICS - Scientific and Technical Instrum  
$24.46 +0.11
0.45%

$25.04

369,181
132.80% of 50 DAV
50 DAV is 278,000
$24.49
-0.12%
9/13/2019 $19.68 PP = $19.84
MB = $20.83
Most Recent Note - 12/4/2019 12:42:22 PM
G - Inching into new high territory with today's 3rd consecutive gain adding to a spurt of gains marked by near average volume. Prior highs in the $22 area define initial support above its 50 DMA line ($20.65). Fundamentals remain strong.
>>> FEATURED STOCK ARTICLE : Volume Totals Cooling After Gains for New Highs - 11/22/2019
 |  View all notes | Set NEW NOTE alert | Company Profile | SEC News | Chart | Request a new note C A  S  I 
Symbol/Exchange
Company Name
Industry Group
PRICE CHANGE
(%Change)
Day High Volume
(% DAV)
(% 50 day avg vol)
52 Wk Hi
% From Hi
Featured
Date
Price
Featured
Pivot Featured
Max Buy
StockCharts.com Latest Chart for CHDN CHDN - NASDAQ
Churchill Downs Inc
LEISURE - Gaming Activities  
$129.85 +0.45
0.35%

$131.07

180,743
60.86% of 50 DAV
50 DAV is 297,000
$135.32
-4.04%
10/8/2019 $129.77 PP = $132.83
MB = $139.47
Most Recent Note - 12/2/2019 12:31:23 PM
G - Perched within close striking distance of its 52-week high, but extended from any sound base. Its 50 DMA line ($128) defines near-term support above the prior low ($121.81 on 11/07/19) The Jun and Sep '19 quarterly earnings versus the year ago periods were both below the +25% minimum guideline (C criteria) and raised fundamental concerns.
>>> FEATURED STOCK ARTICLE : Resilience Shown Despite Another Sub Par Earnings Report - 11/18/2019
 |  View all notes | Set NEW NOTE alert | Company Profile | SEC News | Chart | Request a new note C A  S  I 
StockCharts.com Latest Chart for LULU LULU - NASDAQ
Lululemon Athletica
MANUFACTURING - Textile Manufacturing  
$225.58 +2.39
1.07%

$226.33

1,554,504
99.39% of 50 DAV
50 DAV is 1,564,000
$229.65
-1.77%
9/6/2019 $201.25 PP = $194.35
MB = $204.07
Most Recent Note - 12/4/2019 5:53:02 PM
G - Extended from any sound base and stubbornly holding its ground near its all-time high. Its 50 DMA line ($206) defines important near-term support.

>>> FEATURED STOCK ARTICLE : New High Close Stretches Already Extended Leader - 11/26/2019
 |  View all notes | Set NEW NOTE alert | Company Profile | SEC News | Chart | Request a new note C A  S  I 
StockCharts.com Latest Chart for CPRT CPRT - NASDAQ
Copart Inc
SPECIALTY RETAIL - Auto Dealerships  
$87.05 -0.23
-0.26%

$88.97

2,123,809
129.42% of 50 DAV
50 DAV is 1,641,000
$92.41
-5.80%
9/5/2019 $79.13 PP = $79.84
MB = $83.83
Most Recent Note - 12/2/2019 12:32:26 PM
G - Consolidating after getting extended from any sound base. The 50 DMA line ($83.22) defines near-term support above the prior low ($80.71 on 11/06/19). Fundamentals remain strong.
>>> FEATURED STOCK ARTICLE : Gapped Up Following Another Strong Earnings Report - 11/21/2019
 |  View all notes | Set NEW NOTE alert | Company Profile | SEC News | Chart | Request a new note C A  S  I 
StockCharts.com Latest Chart for NMIH NMIH - NASDAQ
N M I Holdings Inc Cl A
Finance-MrtgandRel Svc  
$32.66 +0.39
1.21%

$32.88

411,774
95.76% of 50 DAV
50 DAV is 430,000
$34.50
-5.33%
11/8/2019 $32.89 PP = $31.44
MB = $33.01
Most Recent Note - 12/4/2019 5:51:40 PM
G - Consolidating above prior highs in the $30-31 area which define initial support along with its 50 DMA line ($30.04).
>>> FEATURED STOCK ARTICLE : Holding Ground Stubbornly Near All-Time High - 11/27/2019
 |  View all notes | Set NEW NOTE alert | Company Profile | SEC News | Chart | Request a new note C A  S  I 
StockCharts.com Latest Chart for SPLK SPLK - NASDAQ
Splunk Inc
Computer Sftwr-Database  
$146.62 -1.47
-0.99%

$149.28

1,544,029
82.35% of 50 DAV
50 DAV is 1,875,000
$152.68
-3.97%
11/25/2019 $147.79 PP = $142.16
MB = $149.27
Most Recent Note - 12/4/2019 5:54:07 PM
Y - Color code is changed to yellow after quietly pulling back below its "max buy" level. Prior highs in the $142-143 area define initial support to watch on pullbacks.
>>> FEATURED STOCK ARTICLE : Spurt of Volume-Driven Gains Reaches New All-Time High - 11/25/2019
 |  View all notes | Set NEW NOTE alert | Company Profile | SEC News | Chart | Request a new note C A  S  I 
Symbol/Exchange
Company Name
Industry Group
PRICE CHANGE
(%Change)
Day High Volume
(% DAV)
(% 50 day avg vol)
52 Wk Hi
% From Hi
Featured
Date
Price
Featured
Pivot Featured
Max Buy
StockCharts.com Latest Chart for PAYC PAYC - NYSE
Paycom Software Inc
COMPUTER SOFTWARE and SERVICES - Application Software  
$269.91 -0.52
-0.19%

$274.98

463,314
79.47% of 50 DAV
50 DAV is 583,000
$279.95
-3.59%
11/20/2019 $252.97 PP = $259.81
MB = $272.80
Most Recent Note - 12/2/2019 12:12:49 PM
G - Pulling back after an impressive streak of 14 consecutive gains left it extended from the prior base. Prior high ($259) defines initial support to watch on pullbacks. Fundamentals remain strong.
>>> FEATURED STOCK ARTICLE : Powerful Gain for New High Backed by Heavy Volume - 11/20/2019
 |  View all notes | Set NEW NOTE alert | Company Profile | SEC News | Chart | Request a new note C A  S  I 
StockCharts.com Latest Chart for BLD BLD - NYSE
Topbuild Corp
Bldg-Constr Prds/Misc  
$109.28 -0.31
-0.28%

$110.31

203,583
75.68% of 50 DAV
50 DAV is 269,000
$113.74
-3.92%
5/17/2019 $82.19 PP = $87.31
MB = $91.68
Most Recent Note - 12/3/2019 5:08:14 PM
G - Consolidating after getting extended from any sound base. Bullish action has continued after it reported earnings +24% on +5% sales revenues for the Sep '19 quarter versus the year ago period, just below the +25% minimum guideline (C criteria). Its 50 DMA line ($102.71) acted as support during its ongoing ascent. See the latest FSU analysis for more details and a new annotated graph.
>>> FEATURED STOCK ARTICLE : Consolidating After Getting Extended From Any Sound Base - 12/3/2019
 |  View all notes | Set NEW NOTE alert | Company Profile | SEC News | Chart | Request a new note C A  S  I 
StockCharts.com Latest Chart for GLOB GLOB - NYSE
Globant SA
Computer-Tech Services  
$100.16 +1.40
1.42%

$100.62

221,435
82.93% of 50 DAV
50 DAV is 267,000
$112.33
-10.83%
11/14/2019 $106.87 PP = $112.43
MB = $118.05
Most Recent Note - 12/3/2019 12:30:25 PM
G - Color code is changed to green while slumping near its 50 DMA line ($97) with higher volume behind today's big 4th consecutive loss. Prior lows and its 200 DMA line define the next important support to watch. Reported earnings +35% on +27% sales revenues for the Sep '19 quarter.
>>> FEATURED STOCK ARTICLE : Rallying Near High With 12th Consecutive Gain - 11/14/2019
 |  View all notes | Set NEW NOTE alert | Company Profile | SEC News | Chart | Request a new note C A  S  I 

THESE ARE NOT BUY RECOMMENDATIONS!  Comments contained in the body of this report are technical opinions only. The material herein has been obtained from sources believed to be reliable and accurate, however, its accuracy and completeness cannot be guaranteed. This site is not an investment advisor, hence it does not endorse or recommend any securities or other investments. Any recommendation contained in this report may not be suitable for all investors and it is not to be deemed an offer or solicitation on our part with respect to the purchase or sale of any securities. All trademarks, service marks and trade names appearing in this report are the property of their respective owners, and are likewise used for identification purposes only.

This report is a service available only to active Paid Premium Members. You may opt-out of receiving report notifications at any time.  Questions or comments may be submitted by writing to Premium Membership Services 665 S.E. 10 Street, Suite 201 Deerfield Beach, FL 33441-5634 or by calling 1-800-965-8307 or 954-785-1121.

Kenneth J. Gruneisen founded Gruneisen Growth Corp. (2003), which prior to May 11, 2015, operated CANSLIM.net and CANSLIM.com both under license from Data Analysis Inc. / Investor's Business Daily. Kenneth has passed the CAN SLIM® Master's Exam. Gruneisen Growth Corp. now continues over two decades of fact based market analysis via FactBasedInvesting.com.

Copyright © 1996-2024 Gruneisen Growth Corp. All rights reserved. Protected by the copyright laws of the United States and Canada and by international treaties

Privacy Policy | Terms of Use | Contact Us