You are not logged in.
This means you
CAN ONLY VIEW reports that were published prior to Saturday, February 24, 2024.
You
MUST UPGRADE YOUR MEMBERSHIP if you want to see any current reports.
AFTER MARKET UPDATE - TUESDAY, DECEMBER 4TH, 2018
Previous After Market Report Next After Market Report >>>
|
|
|
|
DOW |
-799.36 |
25,027.07 |
-3.10% |
|
Volume |
1,132,460,540 |
+15% |
|
Volume |
2,596,665,880 |
-0% |
|
NASDAQ |
-283.08 |
7,158.43 |
-3.80% |
|
Advancers |
498 |
16% |
|
Advancers |
443 |
14% |
|
S&P 500 |
-90.31 |
2,700.06 |
-3.24% |
|
Decliners |
2,543 |
84% |
|
Decliners |
2,653 |
86% |
|
Russell 2000 |
-68.21 |
1,480.75 |
-4.40% |
|
52 Wk Highs |
75 |
|
|
52 Wk Highs |
39 |
|
|
S&P 600 |
-44.71 |
925.06 |
-4.61% |
|
52 Wk Lows |
373 |
|
|
52 Wk Lows |
256 |
|
|
 |
Big Losses Immediately Hurt Latest Confirmed Rally
Kenneth J. Gruneisen - Passed the CAN SLIM® Master's Exam
Stocks finished firmly lower Tuesday. The Dow retreated 799 points to 25,027. The S&P 500 slid 90 points to 2,700, falling below its 200-day moving average, a widely watched technical indicator. The Nasdaq Composite tumbled 283 points to 7,158. The volume totals on the session were mixed, higher than the prior session total on the NYSE and slightly lower on the Nasdaq exchange. Breadth was negative as decliners led advancers by a 5-1 margin on the NYSE and nearly 6-1 on the Nasdaq exchange. There were 30 high-ranked companies from the Leaders List that made new 52-week highs and were listed on the BreakOuts Page, versus 49 on the prior session. New 52-week lows totals swelled and solidly outnumbered new 52-week highs totals on the NYSE and on the Nasdaq exchange. Tuesday's damaging losses immediately hurt the outlook for the latest confirmed rally after Monday's gain was noted as a follow-through day for the major indices (M criteria). Technically, the new rally may be under pressure, yet it remains valid unless subsequent losses violate the recent Day 1 low. New buying efforts are justified under the fact-based investment system's rules only in stocks meeting all of the key fundamental and technical criteria. The Featured Stocks Page provides the most timely analysis on high-ranked leaders. Strict buying and selling rules should always be followed on a case by case basis. Charts used courtesy of www.stockcharts.com
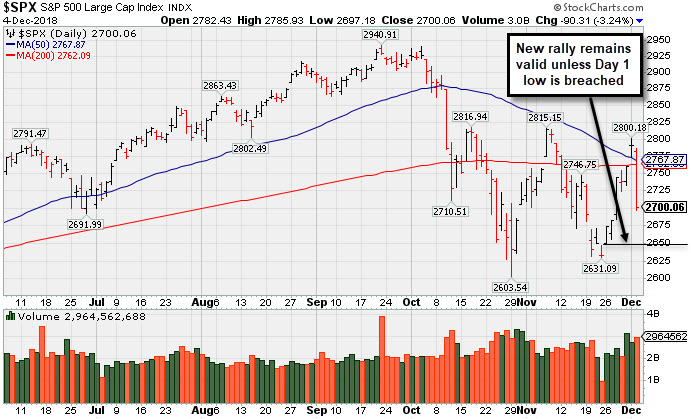
PICTURED: The S&P 500 Index suffered a damaging loss on Tuesday with heavier volume. Ugly losses early in a rally do not bode well, however, the new rally remains valid unless the recent Day 1 low is breached.
The major averages declined as a perceived “risk-off” tone took hold of markets. The trade truce between the U.S. and China, which inspired a rally Monday, seemed less certain. Treasuries garnered attention as they strengthened along the curve. The yield spread between the 10- and 2-year notes fell to a fresh decade low as the 10-year note lost seven basis points to 2.91%. Meanwhile, New York Fed President John Williams reiterated that policymakers are justified in their plans to continue raising interest rates as the U.S. economy remains “in really good shape”. Elsewhere, Fed Chairman Jerome Powell’s testimony scheduled for tomorrow is cancelled due to a market holiday in honor of President George H.W. Bush.
Ten of 11 S&P 500 sectors ended the session more than 1.3% lower. Financials led the decline in sympathy of a flattening yield curve. Shares of Goldman Sachs (GS -3.82%). Industrials also underperformed as Caterpillar (CAT -6.93%) fell. Technology stocks also pressured the major averages with Apple (AAPL -4.40%) after an analyst downgrade.
In commodities, WTI crude lost 0.2% to $52.87/barrel. COMEX gold was up 0.6% to $1,241.10/ounce amid a weaker dollar. |
 Kenneth J. Gruneisen started out as a licensed stockbroker in August 1987, a couple of months prior to the historic stock market crash that took the Dow Jones Industrial Average down -22.6% in a single day. He has published daily fact-based fundamental and technical analysis on high-ranked stocks online for two decades. Through FACTBASEDINVESTING.COM, Kenneth provides educational articles, news, market commentary, and other information regarding proven investment systems that work in good times and bad.
Comments contained in the body of this report are technical opinions only and are not necessarily those of Gruneisen Growth Corp. The material herein has been obtained from sources believed to be reliable and accurate, however, its accuracy and completeness cannot be guaranteed. Our firm, employees, and customers may effect transactions, including transactions contrary to any recommendation herein, or have positions in the securities mentioned herein or options with respect thereto. Any recommendation contained in this report may not be suitable for all investors and it is not to be deemed an offer or solicitation on our part with respect to the purchase or sale of any securities. |
|
 |
Financial, Retail, Tech, and Energy-Linked Groups Fell
Kenneth J. Gruneisen - Passed the CAN SLIM® Master's Exam
There were big and unanimous losses for the Retail Index ($RLX -4.43%), Broker/Dealer Index ($XBD -4.10%), and the Bank Index ($BKX -4.86%). The tech sector also had a negative bias as the Semiconductor Index ($SOX -4.98%), Networking Index ($NWX -3.57%), and the Biotech Index ($BTK -4.86%) each suffered a large loss. Energy-linked groups also fell as the Oil Services Index ($OSX -4.75%) and Integrated Oil Index ($XOI -2.46%) both sank, meanwhile the Gold & Silver Index ($XAU +0.49%) was a standout gainer.
Charts courtesy of www.stockcharts.com
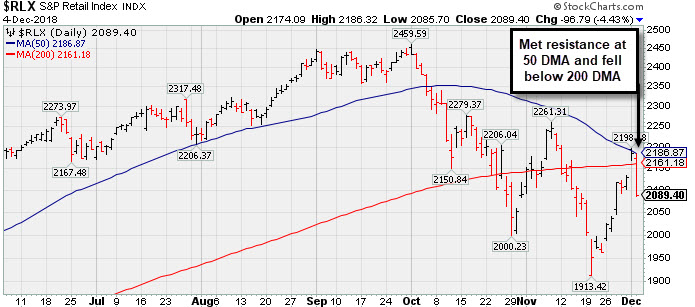 PICTURED: The Retail Index ($RLX -4.43%) met resistance at its 50-day moving average (DMA) line and slumped back below its 200 DMA line. Subsequent gains above the 50 DMA line are needed for the outlook to improve, meanwhile, its November low defines important near-term support to watch.
| Oil Services |
$OSX |
103.21 |
-5.15 |
-4.75% |
-30.99% |
| Integrated Oil |
$XOI |
1,302.70 |
-32.86 |
-2.46% |
-2.46% |
| Semiconductor |
$SOX |
1,209.35 |
-63.39 |
-4.98% |
-3.49% |
| Networking |
$NWX |
504.92 |
-18.69 |
-3.57% |
+2.93% |
| Broker/Dealer |
$XBD |
253.04 |
-10.83 |
-4.10% |
-4.60% |
| Retail |
$RLX |
2,089.40 |
-96.79 |
-4.43% |
+20.51% |
| Gold & Silver |
$XAU |
66.16 |
+0.32 |
+0.49% |
-22.41% |
| Bank |
$BKX |
96.76 |
-4.94 |
-4.86% |
-9.32% |
| Biotech |
$BTK |
4,615.96 |
-195.61 |
-4.07% |
+9.33% |
|
|
|
 |
Pullback After 9 Straight Gains Challenged High
Kenneth J. Gruneisen - Passed the CAN SLIM® Master's Exam
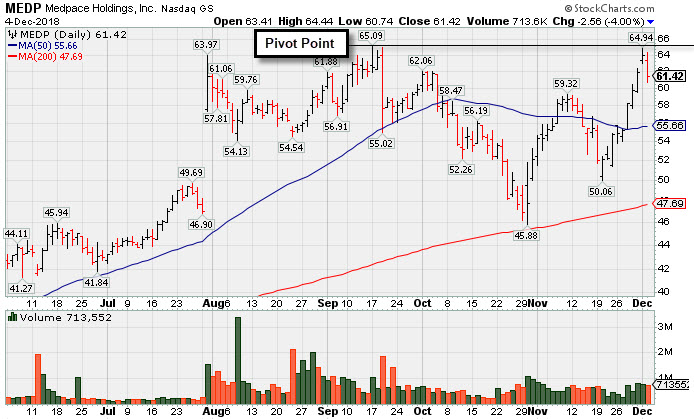
Medpace Holdings Inc (MEDP) was highlighted in yellow with pivot point cited based on its 9/17/18 high plus 10 cents in the 12/03/18 mid-day report (read here) . Subsequent gains above the pivot point backed by a least +40% above average volume may trigger a technical buy signal. Challenging its all-time high with today's 9th consecutive gain.
The high-ranked Medical-Research Eqp/Svc firm reported earnings +68% on +62% sales revenues for the Sep '18 quarter marking the 3rd consecutive comparison above the +25% minimum earnings guideline (C criteria). Its annual earnings (A criteria) history has been strong and it has a 96 Earnings Per Share Rating, putting it in the top 5% of all publicly traded companies.
The number of top-rated funds owning its shares rose from 188 in Dec '17 to 369 in Sep '18, a reassuring sign concerning the I criteria. Its current Up/Down Volume Ratio of 1.9 is an unbiased indication its shares have been under accumulation over the past 50 days. It has earned a Timeliness Rating of A and Sponsorship rating of B. It support at its 200 DMA line during the consolidation since last noted in the 9/19/18 - "Proposed yet another Secondary Offering on 8/07/18. Completed Secondary Offerings on 6/12/18, 5/04/18, and 12/01/17. "
Charts courtesy of www.stockcharts.com |
|
|
Color Codes Explained :
Y - Better candidates highlighted by our
staff of experts.
G - Previously featured
in past reports as yellow but may no longer be buyable under the
guidelines.
***Last / Change / Volume data in this table is the closing quote data***
Symbol/Exchange
Company Name
Industry Group |
PRICE |
CHANGE
(%Change) |
Day High |
Volume
(% DAV)
(% 50 day avg vol) |
52 Wk Hi
% From Hi |
Featured
Date |
Price
Featured |
Pivot Featured |
|
Max Buy |
MLR
-
NYSE
Miller Industries Inc
AUTOMOTIVE - Auto Parts
|
$28.11
|
-0.63
-2.19% |
$28.85
|
20,081
74.37% of 50 DAV
50 DAV is 27,000
|
$29.40
-4.39%
|
11/30/2018
|
$28.35
|
PP = $29.50
|
|
MB = $30.98
|
Most Recent Note - 12/3/2018 5:32:46 PM
Y - Posted a gain today with above average volume. Highlighted in yellow with pivot point cited based on its 8/10/18 high plus 10 cents in the 11/30/18 mid-day report. Faces little resistance due to overhead supply up to the $29 level. Subsequent gains above the pivot point backed by at least +40% above average volume are needed to trigger a technical buy signal. Reported earnings +95% on +28% sales revenues for the Sep '18 quarter. Recent quarterly comparisons have been above the +25% minimum earnings guideline (C criteria) and, sequentially, showed encouraging sales revenues acceleration. Annual earnings history (A criteria) has also been good. Very small supply of only 11.4 million shares outstanding (A criteria) can contribute to greater price volatility in the event of institutional buying or selling. See the latest FSU analysis for more details and a new annotated graph.
>>> FEATURED STOCK ARTICLE : Perched Within Striking Distance of All Time High - 12/3/2018 |
View all notes |
Set NEW NOTE alert |
Company Profile |
SEC
News |
Chart |
Request a new note
C
A
S
I |
MPX
-
NYSE
Marine Products Corp
AUTOMOTIVE - Recreational Vehicles
|
$21.50
|
-0.82
-3.67% |
$22.32
|
40,477
89.95% of 50 DAV
50 DAV is 45,000
|
$24.82
-13.38%
|
10/24/2018
|
$23.00
|
PP = $24.92
|
|
MB = $26.17
|
 Most Recent Note - 12/4/2018 5:32:45 PM
G - Sputtering below its 50 DMA line ($22.11) yet above the recent low ($20.25 on 10/26/18) previously noted as important near-term support. Subsequent gains above the pivot point backed by at least +40% above average volume may trigger a technical buy signal.
>>> FEATURED STOCK ARTICLE : Perched Within Striking Distance of Pivot Point - 11/13/2018 |
View all notes |
Set NEW NOTE alert |
Company Profile |
SEC
News |
Chart |
Request a new note
C
A
S
I |
ZBRA
-
NASDAQ
Zebra Tech Corp Cl A
COMPUTER HARDWARE - Computer Peripherals
|
$171.02
|
-10.35
-5.71% |
$182.65
|
570,490
122.16% of 50 DAV
50 DAV is 467,000
|
$184.75
-7.43%
|
11/6/2018
|
$170.41
|
PP = $179.57
|
|
MB = $188.55
|
Most Recent Note - 12/4/2018 4:00:56 PM
Y - Slumped back toward its 50 DMA line ($169). The prior lows and 200 DMA line ($154) define important near-term support to watch. See the latest FSU analysis for more details and an annotated graph.
>>> FEATURED STOCK ARTICLE : Challenging High After Rebound Above 50-day Average - 11/28/2018 |
View all notes |
Set NEW NOTE alert |
Company Profile |
SEC
News |
Chart |
Request a new note
C
A
S
I |
CME
-
NASDAQ
C M E Group Inc
DIVERSIFIED SERVICES - Business/Management Services
|
$188.20
|
+0.09
0.05% |
$189.28
|
2,607,866
123.95% of 50 DAV
50 DAV is 2,104,000
|
$197.08
-4.51%
|
10/4/2018
|
$179.29
|
PP = $177.45
|
|
MB = $186.32
|
Most Recent Note - 12/4/2018 5:26:01 PM
G - Enduring distributional pressure in recent weeks yet still remaining near its all-time high. Its 50 DMA line ($183.27) defines near-term support. Strength continued after reporting earnings +22% on +2% sales revenues for the Sep '18 quarter, below the +25% minimum earnings guideline (C criteria), raising fundamental concerns.
>>> FEATURED STOCK ARTICLE : Extended From Base After More Gain With Above Average Volume - 11/15/2018 |
View all notes |
Set NEW NOTE alert |
Company Profile |
SEC
News |
Chart |
Request a new note
C
A
S
I |
GDOT
-
NYSE
Green Dot Corp Cl A
FINANCIAL SERVICES - Credit Services
|
$79.00
|
-4.54
-5.43% |
$83.50
|
458,767
98.24% of 50 DAV
50 DAV is 467,000
|
$93.00
-15.05%
|
11/8/2018
|
$90.35
|
PP = $91.61
|
|
MB = $96.19
|
Most Recent Note - 12/4/2018 3:59:36 PM
G - Slumping back below its 50 DMA line. It has not formed a sound base. Its 200 DMA line and prior low ($71.50 on 10/29/18) define important near-term support.
>>> FEATURED STOCK ARTICLE : Volume Heavy Behind Rally to New High - 11/8/2018 |
View all notes |
Set NEW NOTE alert |
Company Profile |
SEC
News |
Chart |
Request a new note
C
A
S
I |
Symbol/Exchange
Company Name
Industry Group |
PRICE |
CHANGE
(%Change) |
Day High |
Volume
(% DAV)
(% 50 day avg vol) |
52 Wk Hi
% From Hi |
Featured
Date |
Price
Featured |
Pivot Featured |
|
Max Buy |
ULTA
-
NASDAQ
Ulta Beauty Inc
SPECIALTY RETAIL - Specialty Retail, Other
|
$291.13
|
-15.36
-5.01% |
$308.40
|
1,561,501
163.51% of 50 DAV
50 DAV is 955,000
|
$322.49
-9.72%
|
11/8/2018
|
$296.36
|
PP = $290.40
|
|
MB = $304.92
|
Most Recent Note - 12/4/2018 1:22:59 PM
Y - Color code is changed to yellow while abruptly retreating below its "max buy" level. The prior high ($290) defines initial support to watch above its 50 DMA line ($286.93). Due to report earnings news after the close on Thursday, December 6, 2018. Volume and volatility often increase near earnings news.
>>> FEATURED STOCK ARTICLE : Volume Driven Gains Indicate Institutional Buying Demand - 11/9/2018 |
View all notes |
Set NEW NOTE alert |
Company Profile |
SEC
News |
Chart |
Request a new note
C
A
S
I |
UBNT
-
NASDAQ
Ubiquiti Networks Inc
TELECOMMUNICATIONS - Diversified Communication Serv
|
$108.58
|
-4.22
-3.74% |
$114.22
|
306,058
63.76% of 50 DAV
50 DAV is 480,000
|
$114.89
-5.49%
|
11/9/2018
|
$108.20
|
PP = $101.43
|
|
MB = $106.50
|
Most Recent Note - 12/4/2018 5:34:09 PM
G - Retreated from its all-time high with a big loss today on lighter volume. Prior high ($101.33 on 9/25/18) defines initial support to watch on pullbacks.
>>> FEATURED STOCK ARTICLE : Pullback Following Breakout Gain on After Latest Earnings Report - 11/12/2018 |
View all notes |
Set NEW NOTE alert |
Company Profile |
SEC
News |
Chart |
Request a new note
C
A
S
I |
PRAH
-
NASDAQ
P R A Health Sciences
HEALTH SERVICES - Medical Laboratories and Researc
|
$110.79
|
-5.32
-4.58% |
$116.48
|
893,028
179.68% of 50 DAV
50 DAV is 497,000
|
$121.98
-9.17%
|
11/30/2018
|
$117.06
|
PP = $112.98
|
|
MB = $118.63
|
Most Recent Note - 12/4/2018 1:17:25 PM
Y - Undercutting its pivot point today raising concerns after a "negative reversal" on the prior session. Markets are widely negative today, immediately reversing after a new confirmed market rally (M criteria) was noted in the latest Market Commentary (read here).
>>> FEATURED STOCK ARTICLE : Streak of Gains For New Highs Marked by Increasing Volume - 11/30/2018 |
View all notes |
Set NEW NOTE alert |
Company Profile |
SEC
News |
Chart |
Request a new note
C
A
S
I |
HQY
-
NASDAQ
Healthequity Inc
COMPUTER SOFTWARE and SERVICES - Healthcare Information Service
|
$83.60
|
-6.11
-6.81% |
$91.19
|
984,871
144.20% of 50 DAV
50 DAV is 683,000
|
$101.58
-17.70%
|
11/2/2018
|
$95.56
|
PP = $100.09
|
|
MB = $105.09
|
Most Recent Note - 12/4/2018 3:57:25 PM
G - Slumping back below its 50 DMA line raising concerns with today's big loss following 4 consecutive gains. Found support near its 200 DMA line after a damaging loss violated the prior low ($80.56 on 10/24/18).
>>> FEATURED STOCK ARTICLE : Found Support at 200-Day Average But Faces Overhead Supply - 11/26/2018 |
View all notes |
Set NEW NOTE alert |
Company Profile |
SEC
News |
Chart |
Request a new note
C
A
S
I |
OLLI
-
NASDAQ
Ollie's Bargain Outlet
Retail-DiscountandVariety
|
$86.83
|
-4.40
-4.82% |
$90.70
|
1,399,244
213.95% of 50 DAV
50 DAV is 654,000
|
$97.61
-11.04%
|
11/16/2018
|
$90.70
|
PP = $97.71
|
|
MB = $102.60
|
Most Recent Note - 12/4/2018 3:58:44 PM
G - Slumping back below its 50 DMA line ($90) today. Due to report earnings news. Faces near term resistance due to overhead supply up to the $97 level.
>>> FEATURED STOCK ARTICLE : Consolidating Near 50-Day Average Forming New Base - 11/16/2018 |
View all notes |
Set NEW NOTE alert |
Company Profile |
SEC
News |
Chart |
Request a new note
C
A
S
I |
Symbol/Exchange
Company Name
Industry Group |
PRICE |
CHANGE
(%Change) |
Day High |
Volume
(% DAV)
(% 50 day avg vol) |
52 Wk Hi
% From Hi |
Featured
Date |
Price
Featured |
Pivot Featured |
|
Max Buy |
PLNT
-
NYSE
Planet Fitness Inc Cl A
Leisure-Services
|
$55.63
|
-1.25
-2.20% |
$58.50
|
1,266,512
95.51% of 50 DAV
50 DAV is 1,326,000
|
$57.66
-3.52%
|
11/7/2018
|
$57.10
|
PP = $55.45
|
|
MB = $58.22
|
Most Recent Note - 12/4/2018 5:27:41 PM
Y - There was a "negative reversal" today after it touched a new all-time high. Its 50 DMA line and recent low ($48.02 on 11/20/18) define important near-term support to watch on pullbacks.
>>> FEATURED STOCK ARTICLE : Fitness Firm Perched Near All-Time High - 11/29/2018 |
View all notes |
Set NEW NOTE alert |
Company Profile |
SEC
News |
Chart |
Request a new note
C
A
S
I |
MEDP
-
NASDAQ
Medpace Holdings Inc
Medical-Research Eqp/Svc
|
$61.40
|
-2.58
-4.03% |
$64.44
|
767,288
138.50% of 50 DAV
50 DAV is 554,000
|
$65.09
-5.67%
|
12/3/2018
|
$63.43
|
PP = $65.19
|
|
MB = $68.45
|
Most Recent Note - 12/4/2018 5:23:30 PM
Y - Pulled back today. Highlighted in yellow with pivot point cited based on its 9/17/18 high plus 10 cents in the 12/03/18 mid-day report. Subsequent gains above the pivot point backed by a least +40% above average volume may trigger a technical buy signal. Reported earnings +68% on +62% sales revenues for the Sep '18 quarter marking the 3rd consecutive comparison above the +25% minimum earnings guideline (C criteria). See the latest FSU analysis for more details and a new annotated graph.
>>> FEATURED STOCK ARTICLE : Pullback After 9 Straight Gains Challenged High - 12/4/2018 |
View all notes |
Set NEW NOTE alert |
Company Profile |
SEC
News |
Chart |
Request a new note
C
A
S
I |
INVA
-
NASDAQ
Innoviva Inc
Medical-Biomed/Biotech
|
$17.61
|
-0.51
-2.81% |
$18.25
|
1,605,494
140.71% of 50 DAV
50 DAV is 1,141,000
|
$18.60
-5.32%
|
11/23/2018
|
$17.74
|
PP = $18.09
|
|
MB = $18.99
|
Most Recent Note - 12/4/2018 5:29:54 PM
Y - Churning above average volume the past 2 sessions while perched near its all-time high, encountering distributional pressure. Subsequent gains and a strong close above the pivot point backed by at least +40% above average volume may clinch a technical buy signal.
>>> FEATURED STOCK ARTICLE : Bullish Action in Biotech Firm With Strong Earnings History - 11/23/2018 |
View all notes |
Set NEW NOTE alert |
Company Profile |
SEC
News |
Chart |
Request a new note
C
A
S
I |
|
|
|
THESE ARE NOT BUY RECOMMENDATIONS!
Comments contained in the body of this report are technical
opinions only. The material herein has been obtained
from sources believed to be reliable and accurate, however,
its accuracy and completeness cannot be guaranteed.
This site is not an investment advisor, hence it does
not endorse or recommend any securities or other investments.
Any recommendation contained in this report may not
be suitable for all investors and it is not to be deemed
an offer or solicitation on our part with respect to
the purchase or sale of any securities. All trademarks,
service marks and trade names appearing in this report
are the property of their respective owners, and are
likewise used for identification purposes only.
This report is a service available
only to active Paid Premium Members.
You may opt-out of receiving report notifications
at any time. Questions or comments may be submitted
by writing to Premium Membership Services 665 S.E. 10 Street, Suite 201 Deerfield Beach, FL 33441-5634 or by calling 1-800-965-8307
or 954-785-1121.
|
|
|