Help Lines 954-785-1121


You are not logged in. Upgrade Here
 <<<Previous Mid Day Report     Next Mid Day Report >>> 
 <<<Previous After Market Report Next After Market Report >>> 
You are not logged in.
This means you CAN ONLY VIEW reports that were published prior to Monday, February 19, 2024.
You MUST UPGRADE YOUR MEMBERSHIP if you want to see any current reports.

AFTER MARKET UPDATE - MONDAY, DECEMBER 2ND, 2019
Previous After Market Report Next After Market Report >>>
Indices NYSE Nasdaq
DOW  -268.37 27,783.04 -0.96% Volume 784,812,040 +58% Volume 2,185,507,890 +104%
NASDAQ -97.48 8,567.99 -1.12% Advancers 807 28% Advancers 913 29%
S&P 500 -27.11 3,113.87 -0.86% Decliners 2,090 72% Decliners 2,213 71%
Russell 2000 -16.92 1,607.58 -1.04% 52 Wk Highs 63   52 Wk Highs 80  
S&P 600 -11.94 981.57 -1.20% 52 Wk Lows 44   52 Wk Lows 46  

Leadership Thinned as Major Indices Fell

The Dow fell 268 points, while the S&P 500 lost 0.9%. The Nasdaq Composite was down 1.1%. Breadth was negative as decliners led advancers by a 5-2 margin on the NYSE and 2-1 on the Nasdaq exchange. The volume totals were obviously higher than the shortened prior session on both major exchanges. Leadership thinned as there were 24 high-ranked companies from the Leaders List that hit a new 52-week high and were listed on the BreakOuts Page, versus the total of 34 on the prior session. New 52-week highs totals contracted yet still outnumbered new 52-week lows on the NYSE and on the Nasdaq exchange. The major indices (M criteria) are in a "confirmed uptrend" after enduring distributional pressure in recent weeks. The Featured Stocks Page provides the most timely analysis on high-ranked leaders.

Charts used courtesy of www.stockcharts.com

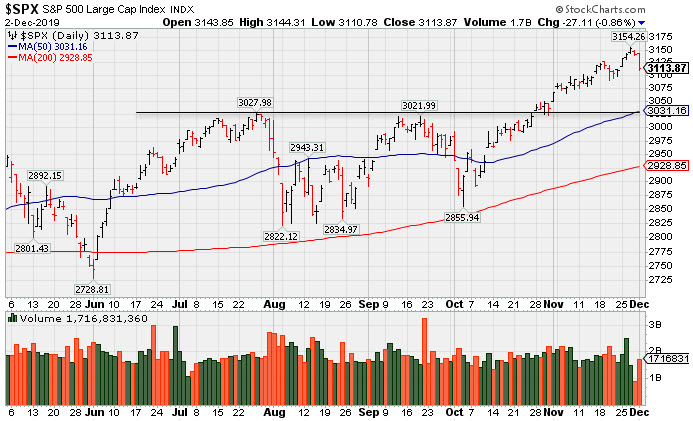
PICTURED: The S&P 500 Index pulled back from its record high. 

Stocks finished lower on Monday, with the S&P 500 dropping the most in almost two months. A report from the Institute for Supply Management showed U.S. manufacturing activity declined at a faster-than-expected pace in November, marking the fourth-straight month of contraction. Separately, construction spending declined 0.8% in October. Overseas, gauge of Chinese factory activity came in at its best level since December 2016, and manufacturing activity in the eurozone improved last month. Treasuries declined, with the yield on the benchmark 10-year note up five basis points to 1.82%.

In trade news, President Trump announced the resumption of steel and aluminum tariffs on imports from Brazil and Argentina, citing the devaluation of their currencies as the catalyst. Meanwhile, reports indicated a U.S.-China “phase one” trade deal may be stalled after Washington passed legislation supporting anti-government protesters in Hong Kong.

Nine of 11 S&P 500 sectors finished in negative territory. Industrials led the decline, while Tech shares also lagged. Consumer Staples and Energy shares were the only outperformers. In commodities, WTI crude rose 1.4% to $55.96/barrel ahead of the December 5th OPEC meeting in which the group and its allies are expected to discuss deepening output cuts.

Kenneth J. Gruneisen started out as a licensed stockbroker in August 1987, a couple of months prior to the historic stock market crash that took the Dow Jones Industrial Average down -22.6% in a single day. He has published daily fact-based fundamental and technical analysis on high-ranked stocks online for two decades. Through FACTBASEDINVESTING.COM, Kenneth provides educational articles, news, market commentary, and other information regarding proven investment systems that work in good times and bad.

Comments contained in the body of this report are technical opinions only and are not necessarily those of Gruneisen Growth Corp. The material herein has been obtained from sources believed to be reliable and accurate, however, its accuracy and completeness cannot be guaranteed. Our firm, employees, and customers may effect transactions, including transactions contrary to any recommendation herein, or have positions in the securities mentioned herein or options with respect thereto. Any recommendation contained in this report may not be suitable for all investors and it is not to be deemed an offer or solicitation on our part with respect to the purchase or sale of any securities.


Gold & Silver and Oil Services indexes Posted Modest Gains

The Retail Index ($RLX -1.00%), Broker/Dealer Index ($XBD -0.71%), and Bank Index ($BKX -0.47%) posted unanimous losses on Monday. The tech sector had a negative bias as the Semiconductor Index ($SOX -1.46%) and Networking Index ($NWX 1.45%) both outpaced the Biotech Index ($BTK -0.46%) to the downside. The Gold & Silver Index ($XAU +0.54%) and Oil Services Index ($OSX +0.50%) each posted a modest gain while the Integrated Oil Index ($XOI -0.10%) ended the session little changed
Charts courtesy of www.stockcharts.com

PICTURED: The Retail Index ($RLX -1.00%) pulled back testing its 50-day moving average (DMA) line. Prior lows define the next important support level.

Industry Index Symbol Close Change % Change YTD % Change
Oil Services $OSX  67.93 +0.34 +0.50% -15.72%
Integrated Oil $XOI  1,200.44 -1.18 -0.10% +3.57%
Semiconductor $SOX  1,691.75 -25.09 -1.46% +46.45%
Networking $NWX  568.62 -8.34 -1.45% +16.36%
Broker/Dealer $XBD  286.77 -2.04 -0.71% +20.83%
Retail $RLX  2,378.41 -24.02 -1.00% +21.88%
Gold & Silver $XAU  96.03 +0.51 +0.53% +35.90%
Bank $BKX  109.22 -0.52 -0.47% +27.31%
Biotech $BTK  4,976.83 -23.14 -0.46% +17.91%


Extended From Prior Base Perched Near Record HIgh

Fortinet Inc (FTNT -$1.19 or -1.13% to $103.92) has been stubbornly holding its ground after getting extended from the prior base. Prior highs in the $97 area defines initial support to watch on pullbacks.

FTNT gapped up on 11/01/19 helping its outlook to improve. Bullish action came after it reported earnings +37% on +21% sales revenues for the Sep '19 quarter versus the year ago period, its 7th consecutive quarterly comparison with earnings above the +25% minimum guideline (C criteria) Annual earnings (A criteria) have been improving since FY '14, also helping it match with the fact-based investment system's guidelines. 

It was highlighted in yellow with new pivot point cited based on its 4/16/19 high plus 10 cents in the 11/11/19 mid-day report (read here), It was last shown in this FSU section that evening with an annotated graph under the headline, "Reversed Into Red Today After Touching New High". 

The number of top-rated funds owning its shares rose from 960 in Jun '18 to 1,554 in Sep '19, a reassuring sign concerning the I criteria. Its current Up/Down Volume ratio of 1.7 is an unbiased indication its shares have been under accumulation over the past 50 days. It has a Timeliness rating of A and Sponsorship rating of B.

Charts courtesy of www.stockcharts.com


Color Codes Explained :
Y - Better candidates highlighted by our staff of experts.
G - Previously featured in past reports as yellow but may no longer be buyable under the guidelines.

***Last / Change / Volume data in this table is the closing quote data***
Symbol/Exchange
Company Name
Industry Group
PRICE CHANGE
(%Change)
Day High Volume
(% DAV)
(% 50 day avg vol)
52 Wk Hi
% From Hi
Featured
Date
Price
Featured
Pivot Featured
Max Buy
StockCharts.com Latest Chart for MLR MLR - NYSE
Miller Industries Inc
AUTOMOTIVE - Auto Parts  
$36.12 -0.53
-1.45%

$37.00

28,102
62.45% of 50 DAV
50 DAV is 45,000
$37.70
-4.19%
9/24/2019 $34.00 PP = $35.36
MB = $37.13
Most Recent Note - 11/26/2019 5:13:53 PM
Y - Perched near its 52-week high. Prior highs in the $35 area define initial support above its 50 DMA line ($34.20). Showed resilience after recently reporting earnings which were below the fundamental guidelines of the fact-based investment system.

>>> FEATURED STOCK ARTICLE : Showing Resilience After Latest Quarter Missed Minimum Guidelines - 11/15/2019
 |  View all notes | Set NEW NOTE alert | Company Profile | SEC News | Chart | Request a new note C A  S  I 
StockCharts.com Latest Chart for CCBG CCBG - NASDAQ
Capital City Bk Gp
BANKING - Regional - Mid-Atlantic Banks  
$28.85 -0.08
-0.28%

$29.03

27,968
66.59% of 50 DAV
50 DAV is 42,000
$30.85
-6.48%
9/13/2019 $27.03 PP = $27.05
MB = $28.40
Most Recent Note - 12/2/2019 12:29:52 PM
G - Endured distributional pressure yet it is still extended from the prior base. Prior highs define important support to watch along with its 50 DMA line ($28.25).
>>> FEATURED STOCK ARTICLE : Consolidating After Volume-Driven Gains for New Highs - 11/19/2019
 |  View all notes | Set NEW NOTE alert | Company Profile | SEC News | Chart | Request a new note C A  S  I 
StockCharts.com Latest Chart for FTNT FTNT - NASDAQ
Fortinet Inc
Computer Sftwr-Security  
$103.92 -1.19
-1.13%

$105.44

1,135,702
82.24% of 50 DAV
50 DAV is 1,381,000
$106.00
-1.96%
11/11/2019 $97.14 PP = $97.06
MB = $101.91
Most Recent Note - 12/2/2019 12:33:21 PM
G - Stubbornly holding its ground after getting extended from the prior base. Prior high in the $97 area defines initial support to watch on pullbacks.
>>> FEATURED STOCK ARTICLE : Extended From Prior Base Perched Near Record HIgh - 12/2/2019
 |  View all notes | Set NEW NOTE alert | Company Profile | SEC News | Chart | Request a new note C A  S  I 
StockCharts.com Latest Chart for SPSC SPSC - NASDAQ
S P S Commerce Inc
COMPUTER SOFTWARE and SERVICES - Application Software  
$55.87 -0.46
-0.82%

$56.90

214,525
108.57% of 50 DAV
50 DAV is 197,600
$59.14
-5.53%
11/29/2019 $56.59 PP = $59.24
MB = $62.20
Most Recent Note - 11/29/2019 2:25:43 PM
Y - Finished lower with today's 2nd consecutive session marked by below average volume. Highlighted in yellow with new pivot point cited based on its 7/26/19 high plus 10 cents. Consolidating near its all-time high. Subsequent gains above its pivot point backed by at least +40% above average volume are needed to trigger a new technical buy signal. Went through a choppy consolidation and rebounded impressively since a 2:1 split impacted share price on 8/23/19 when it was dropped from the Featured Stocks list. Reported earnings +27% on +13% sales revenues for the Sep '19 quarter, and 3 of the past 4 quarterly comparisons were above the +25% minimum earnings guideline (C criteria). See the latest FSU analysis for more details and a new annotated graph.
>>> FEATURED STOCK ARTICLE : Rebound Leaves Supply Chain Management Software Firm Near High - 11/29/2019
 |  View all notes | Set NEW NOTE alert | Company Profile | SEC News | Chart | Request a new note C A  S  I 
StockCharts.com Latest Chart for AUDC AUDC - NASDAQ
Audiocodes Ltd
ELECTRONICS - Scientific and Technical Instrum  
$24.04 +0.07
0.29%

$24.49

294,572
105.96% of 50 DAV
50 DAV is 278,000
$24.35
-1.27%
9/13/2019 $19.68 PP = $19.84
MB = $20.83
Most Recent Note - 11/27/2019 5:23:55 PM
G - Closed one cent off its best ever close with today's 3rd consecutive gain. Prior highs in the $22 area define initial support above Its 50 DMA line ($20.40). Fundamentals remain strong.
>>> FEATURED STOCK ARTICLE : Volume Totals Cooling After Gains for New Highs - 11/22/2019
 |  View all notes | Set NEW NOTE alert | Company Profile | SEC News | Chart | Request a new note C A  S  I 
Symbol/Exchange
Company Name
Industry Group
PRICE CHANGE
(%Change)
Day High Volume
(% DAV)
(% 50 day avg vol)
52 Wk Hi
% From Hi
Featured
Date
Price
Featured
Pivot Featured
Max Buy
StockCharts.com Latest Chart for CHDN CHDN - NASDAQ
Churchill Downs Inc
LEISURE - Gaming Activities  
$129.67 -0.34
-0.26%

$130.16

177,697
58.65% of 50 DAV
50 DAV is 303,000
$135.32
-4.18%
10/8/2019 $129.77 PP = $132.83
MB = $139.47
Most Recent Note - 12/2/2019 12:31:23 PM
G - Perched within close striking distance of its 52-week high, but extended from any sound base. Its 50 DMA line ($128) defines near-term support above the prior low ($121.81 on 11/07/19) The Jun and Sep '19 quarterly earnings versus the year ago periods were both below the +25% minimum guideline (C criteria) and raised fundamental concerns.
>>> FEATURED STOCK ARTICLE : Resilience Shown Despite Another Sub Par Earnings Report - 11/18/2019
 |  View all notes | Set NEW NOTE alert | Company Profile | SEC News | Chart | Request a new note C A  S  I 
StockCharts.com Latest Chart for LULU LULU - NASDAQ
Lululemon Athletica
MANUFACTURING - Textile Manufacturing  
$225.53 -0.16
-0.07%

$227.00

1,398,740
87.26% of 50 DAV
50 DAV is 1,603,000
$229.65
-1.79%
9/6/2019 $201.25 PP = $194.35
MB = $204.07
Most Recent Note - 11/27/2019 5:25:48 PM
G - Extended from any sound base and it hit another new all-time high with today's 4th consecutive gain. Its 50 DMA line ($203.40) defines important near-term support. See the latest FSU analysis for more details and an annotated graph.
>>> FEATURED STOCK ARTICLE : New High Close Stretches Already Extended Leader - 11/26/2019
 |  View all notes | Set NEW NOTE alert | Company Profile | SEC News | Chart | Request a new note C A  S  I 
StockCharts.com Latest Chart for CPRT CPRT - NASDAQ
Copart Inc
SPECIALTY RETAIL - Auto Dealerships  
$87.96 -1.04
-1.17%

$88.87

1,878,013
114.51% of 50 DAV
50 DAV is 1,640,000
$92.41
-4.82%
9/5/2019 $79.13 PP = $79.84
MB = $83.83
Most Recent Note - 12/2/2019 12:32:26 PM
G - Consolidating after getting extended from any sound base. The 50 DMA line ($83.22) defines near-term support above the prior low ($80.71 on 11/06/19). Fundamentals remain strong.
>>> FEATURED STOCK ARTICLE : Gapped Up Following Another Strong Earnings Report - 11/21/2019
 |  View all notes | Set NEW NOTE alert | Company Profile | SEC News | Chart | Request a new note C A  S  I 
StockCharts.com Latest Chart for NMIH NMIH - NASDAQ
N M I Holdings Inc Cl A
Finance-MrtgandRel Svc  
$32.65 -0.92
-2.74%

$34.05

587,677
137.31% of 50 DAV
50 DAV is 428,000
$34.50
-5.36%
11/8/2019 $32.89 PP = $31.44
MB = $33.01
Most Recent Note - 11/27/2019 5:16:28 PM
G - Posted a 5th consecutive small gain with below average volume. Volume totals have been cooling while holding its ground stubbornly after rising above its "max buy" level with gains backed by above average volume. See the latest FSU analysis for more details and a new annotated graph.
>>> FEATURED STOCK ARTICLE : Holding Ground Stubbornly Near All-Time High - 11/27/2019
 |  View all notes | Set NEW NOTE alert | Company Profile | SEC News | Chart | Request a new note C A  S  I 
StockCharts.com Latest Chart for SPLK SPLK - NASDAQ
Splunk Inc
Computer Sftwr-Database  
$148.04 -1.18
-0.79%

$152.68

2,270,996
121.38% of 50 DAV
50 DAV is 1,871,000
$151.26
-2.13%
11/25/2019 $147.79 PP = $142.16
MB = $149.27
Most Recent Note - 11/27/2019 5:21:44 PM
G - Color code is changed to green after rallying above its "max buy" level. Prior highs in the $142-143 area define initial support to watch on pullbacks.
>>> FEATURED STOCK ARTICLE : Spurt of Volume-Driven Gains Reaches New All-Time High - 11/25/2019
 |  View all notes | Set NEW NOTE alert | Company Profile | SEC News | Chart | Request a new note C A  S  I 
Symbol/Exchange
Company Name
Industry Group
PRICE CHANGE
(%Change)
Day High Volume
(% DAV)
(% 50 day avg vol)
52 Wk Hi
% From Hi
Featured
Date
Price
Featured
Pivot Featured
Max Buy
StockCharts.com Latest Chart for PAYC PAYC - NYSE
Paycom Software Inc
COMPUTER SOFTWARE and SERVICES - Application Software  
$269.04 -7.77
-2.81%

$277.85

878,322
148.87% of 50 DAV
50 DAV is 590,000
$279.95
-3.90%
11/20/2019 $252.97 PP = $259.81
MB = $272.80
Most Recent Note - 12/2/2019 12:12:49 PM
G - Pulling back after an impressive streak of 14 consecutive gains left it extended from the prior base. Prior high ($259) defines initial support to watch on pullbacks. Fundamentals remain strong.
>>> FEATURED STOCK ARTICLE : Powerful Gain for New High Backed by Heavy Volume - 11/20/2019
 |  View all notes | Set NEW NOTE alert | Company Profile | SEC News | Chart | Request a new note C A  S  I 
StockCharts.com Latest Chart for BLD BLD - NYSE
Topbuild Corp
Bldg-Constr Prds/Misc  
$107.70 -2.58
-2.34%

$110.62

263,028
94.61% of 50 DAV
50 DAV is 278,000
$113.74
-5.31%
5/17/2019 $82.19 PP = $87.31
MB = $91.68
Most Recent Note - 12/2/2019 12:28:42 PM
G - Extended from any sound base. Reported earnings +24% on +5% sales revenues for the Sep '19 quarter versus the year ago period, just below the +25% minimum guideline (C criteria). Its 50 DMA line ($102.43) acted as support during its ongoing ascent.
>>> FEATURED STOCK ARTICLE : Perched Near High Following Recent Volume-Driven Gains - 11/12/2019
 |  View all notes | Set NEW NOTE alert | Company Profile | SEC News | Chart | Request a new note C A  S  I 
StockCharts.com Latest Chart for GLOB GLOB - NYSE
Globant SA
Computer-Tech Services  
$103.75 -3.25
-3.04%

$106.99

508,669
194.89% of 50 DAV
50 DAV is 261,000
$112.33
-7.64%
11/14/2019 $106.87 PP = $112.43
MB = $118.05
Most Recent Note - 12/2/2019 12:19:45 PM
Y - Color code was changed to yellow while rebounding impressively with 6 consecutive gains after finding prompt support near its 50 DMA line ($96.91). Pulled back abruptly after it reported earnings +35% on +27% sales revenues for the Sep '19 quarter.
>>> FEATURED STOCK ARTICLE : Rallying Near High With 12th Consecutive Gain - 11/14/2019
 |  View all notes | Set NEW NOTE alert | Company Profile | SEC News | Chart | Request a new note C A  S  I 

THESE ARE NOT BUY RECOMMENDATIONS!  Comments contained in the body of this report are technical opinions only. The material herein has been obtained from sources believed to be reliable and accurate, however, its accuracy and completeness cannot be guaranteed. This site is not an investment advisor, hence it does not endorse or recommend any securities or other investments. Any recommendation contained in this report may not be suitable for all investors and it is not to be deemed an offer or solicitation on our part with respect to the purchase or sale of any securities. All trademarks, service marks and trade names appearing in this report are the property of their respective owners, and are likewise used for identification purposes only.

This report is a service available only to active Paid Premium Members. You may opt-out of receiving report notifications at any time.  Questions or comments may be submitted by writing to Premium Membership Services 665 S.E. 10 Street, Suite 201 Deerfield Beach, FL 33441-5634 or by calling 1-800-965-8307 or 954-785-1121.

Kenneth J. Gruneisen founded Gruneisen Growth Corp. (2003), which prior to May 11, 2015, operated CANSLIM.net and CANSLIM.com both under license from Data Analysis Inc. / Investor's Business Daily. Kenneth has passed the CAN SLIM® Master's Exam. Gruneisen Growth Corp. now continues over two decades of fact based market analysis via FactBasedInvesting.com.

Copyright © 1996-2024 Gruneisen Growth Corp. All rights reserved. Protected by the copyright laws of the United States and Canada and by international treaties

Privacy Policy | Terms of Use | Contact Us