You are not logged in.
This means you
CAN ONLY VIEW reports that were published prior to Sunday, February 25, 2024.
You
MUST UPGRADE YOUR MEMBERSHIP if you want to see any current reports.
AFTER MARKET UPDATE - FRIDAY, NOVEMBER 29TH, 2019
Previous After Market Report Next After Market Report >>>
|
|
|
|
DOW |
-112.59 |
28,051.41 |
-0.40% |
|
Volume |
497,266,610 |
-31% |
|
Volume |
1,071,550,899 |
-37% |
|
NASDAQ |
-39.71 |
8,665.47 |
-0.46% |
|
Advancers |
994 |
35% |
|
Advancers |
1,292 |
42% |
|
S&P 500 |
-12.65 |
3,140.98 |
-0.40% |
|
Decliners |
1,853 |
65% |
|
Decliners |
1,760 |
58% |
|
Russell 2000 |
-9.60 |
1,624.50 |
-0.59% |
|
52 Wk Highs |
101 |
|
|
52 Wk Highs |
106 |
|
|
S&P 600 |
-6.48 |
993.51 |
-0.65% |
|
52 Wk Lows |
20 |
|
|
52 Wk Lows |
31 |
|
|
 |
Major Indics Remain Perched Near Record Levels
Kenneth J. Gruneisen - Passed the CAN SLIM® Master's Exam
The Dow lost 112 points, to cap weekly gains at 0.6%. The S&P 500 declined 0.4%, but ended the week up 1.0%. The Nasdaq Composite fell 0.5% but still rallied 1.7% this week. For the month, the S&P 500 rose 3.4%, its best monthly performance since June. The Dow advanced 3.7%, while the Nasdaq Composite climbed 4.5%. Decliners led advancers by a 2-1 margin on the NYSE and 3-2 on the Nasdaq exchange. The shortened session's volume totals were obviously lighter than the prior session on both major exchanges. There were 34 high-ranked companies from the Leaders List that hit a new 52-week high and were listed on the BreakOuts Page, versus the total of 82 on the prior session. New 52-week highs outnumbered new 52-week lows on the NYSE and on the Nasdaq exchange. The major indices (M criteria) are in a "confirmed uptrend" after enduring distributional pressure in recent weeks. The Featured Stocks Page provides the most timely analysis on high-ranked leaders. Charts used courtesy of www.stockcharts.com
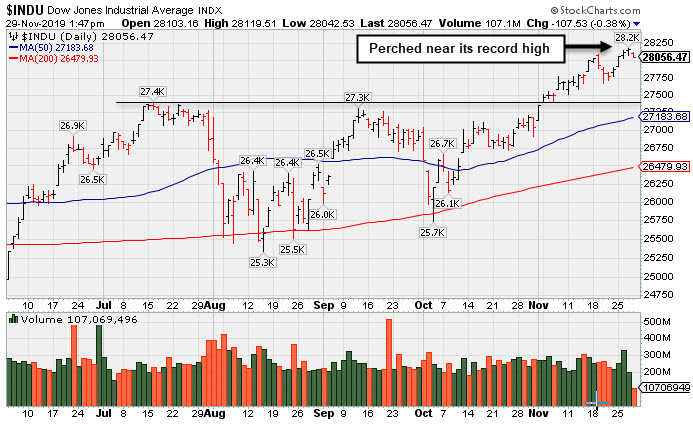
PICTURED: The Dow Jones Industrial Average is perched near its record high.
The major averages fell from their record highs in Friday’s abbreviated trading session. Investor sentiment was dampened after China’s foreign ministry warned of unspecified retaliation against President Trump’s decision to sign a Human Rights Protest Bill supporting the protestors in Hong Kong. There were no economic releases scheduled.
Next week’s data docket will be highlighted by separate updates on manufacturing and service sector activity as well November’s payroll figure. Treasuries were mixed along the curve, with the yield on the benchmark 10-year note adding one basis point to 1.78% and the two-year note down one basis point to 1.61%. In commodities, COMEX gold rose 0.7% to $1,463.50/ounce. Despite the gains, the precious metal declined nearly 3.4% in November, its largest monthly drop in three years.
All 11 S&P 500 sectors ended in negative territory. The Energy group led laggards as WTI crude slumped 4.4% to $55.52/barrel, with oil prices snapping a three week winning streak. Shares of retailers were in focus during today’s session as market participants closely monitored updates on holiday shopping sales figures. Estimates from Adobe (ADBE +0.12%) suggested this year’s Black Friday sales totals, which included both in-store and online shopping, were expected to increase by 20.5% year-over-year to $7.5 billion.
|
 Kenneth J. Gruneisen started out as a licensed stockbroker in August 1987, a couple of months prior to the historic stock market crash that took the Dow Jones Industrial Average down -22.6% in a single day. He has published daily fact-based fundamental and technical analysis on high-ranked stocks online for two decades. Through FACTBASEDINVESTING.COM, Kenneth provides educational articles, news, market commentary, and other information regarding proven investment systems that work in good times and bad.
Comments contained in the body of this report are technical opinions only and are not necessarily those of Gruneisen Growth Corp. The material herein has been obtained from sources believed to be reliable and accurate, however, its accuracy and completeness cannot be guaranteed. Our firm, employees, and customers may effect transactions, including transactions contrary to any recommendation herein, or have positions in the securities mentioned herein or options with respect thereto. Any recommendation contained in this report may not be suitable for all investors and it is not to be deemed an offer or solicitation on our part with respect to the purchase or sale of any securities. |
|
 |
Gold & Silver Index Posted Standout Gain
Kenneth J. Gruneisen - Passed the CAN SLIM® Master's Exam
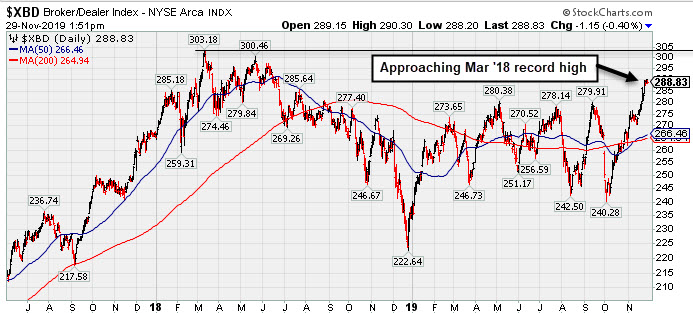
The Retail Index ($RLX -0.83%), Broker/Dealer Index ($XBD -0.40%), and Bank Index ($BKX -0.36%) posted unanimous losses on Friday. The tech sector had a negative bias as the Semiconductor Index ($SOX -1.10%) outpaced the Biotech Index ($BTK -0.26%) and Networking Index ($NWX -0.21%) to the downside. Commodity-linked ground were mixed, with the Oil Services Index ($OSX -1.86%) and the Integrated Oil Index ($XOI -1.07%) both slumping, meanwhile, the Gold & Silver Index ($XAU +1.68%) was a standout gainer on the session.
PICTURED: The Broker/Dealer Index ($XBD -0.40%) has been rebounding toward its March 2018 high. At its October 2019 low it appeared poised to test its Dec '18 low, yet it has rallied impressively..
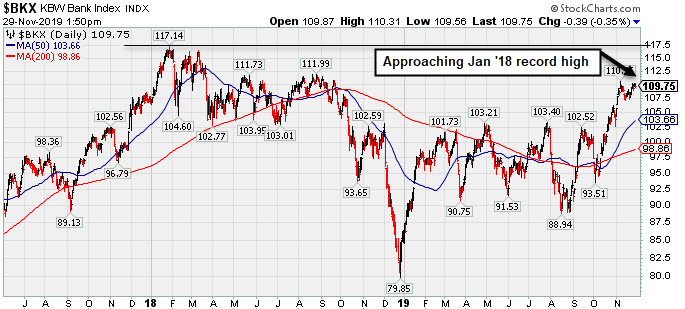
PICTURED: The Bank Index ($BKX -0.36%) has been rebounding toward its January 2018 high. At its August 2019 low it appeared poised to test its Dec '18 low, yet it has rallied impressively. The noted improvement in these financial indexes is an encouraging sign from reliable "leading indicators" that has been helping the broader market's outlook.
| Oil Services |
$OSX |
67.59 |
-1.28 |
-1.86% |
-16.14% |
| Integrated Oil |
$XOI |
1,201.61 |
-12.95 |
-1.07% |
+3.67% |
| Semiconductor |
$SOX |
1,716.84 |
-19.07 |
-1.10% |
+48.62% |
| Networking |
$NWX |
576.96 |
-1.22 |
-0.21% |
+18.07% |
| Broker/Dealer |
$XBD |
288.81 |
-1.16 |
-0.40% |
+21.69% |
| Retail |
$RLX |
2,402.04 |
-20.01 |
-0.83% |
+23.09% |
| Gold & Silver |
$XAU |
95.52 |
+1.59 |
+1.69% |
+35.18% |
| Bank |
$BKX |
109.74 |
-0.39 |
-0.35% |
+27.92% |
| Biotech |
$BTK |
4,999.97 |
-13.02 |
-0.26% |
+18.46% |
|
|
|
 |
Rebound Leaves Supply Chain Management Software Firm Near High
Kenneth J. Gruneisen - Passed the CAN SLIM® Master's Exam
S P S Commerce Inc (SPSC -$1.21 or -2.10% to $56.33) was highlighted in yellow with new pivot point cited based on its 7/26/19 high plus 10 cents in the earlier mid-day report (read here). It is consolidating near its all-time high. Subsequent gains above its pivot point backed by at least +40% above average volume are needed to trigger a new technical buy signal.
A 2:1 split impacted share price on 8/23/19 when it was dropped from the Featured Stocks list. It reported earnings +27% on +13% sales revenues for the Sep '19 quarter, and 3 of the past 4 quarterly comparisons were above the +25% minimum earnings guideline (C criteria). A small downturn in FY '16 earnings was previously noted as a flaw in its annual earnings (A criteria) history.
SPSC went through a choppy consolidation and rebounded impressively since last shown in this FSU section on 8/08/19 with an annotated graph under the headline, "Found Support at 50-Day Average". The high-ranked Computer Software firm's current Up/Down Volume Ratio of 1.6 is an unbiased indication its shares have been under accumulation over the past 50 days.
It completed new Public Offerings on 11/20/13 and 9/06/12. The number of top-rated funds owning its shares rose from 238 in Mar '18 to 483 in Sep '19, a reassuring sign concerning the I criteria. It has a Timeliness Rating of B and Sponsorship Rating of D. The small supply of 34.8 million shares outstanding (S criteria) can contribute to greater price volatility in the even of institutional buying or selling.
Charts courtes 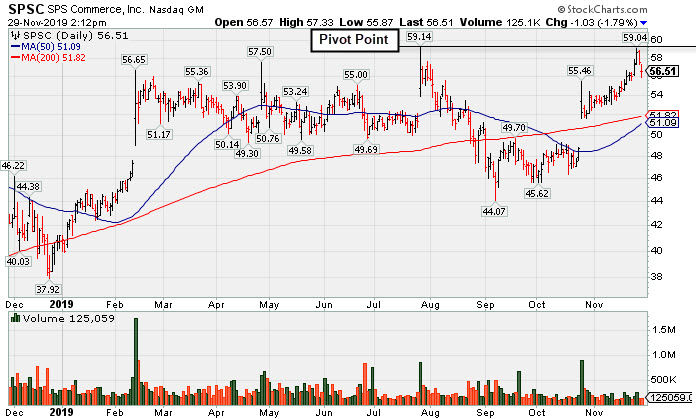 |
|
|
Color Codes Explained :
Y - Better candidates highlighted by our
staff of experts.
G - Previously featured
in past reports as yellow but may no longer be buyable under the
guidelines.
***Last / Change / Volume data in this table is the closing quote data***
Symbol/Exchange
Company Name
Industry Group |
PRICE |
CHANGE
(%Change) |
Day High |
Volume
(% DAV)
(% 50 day avg vol) |
52 Wk Hi
% From Hi |
Featured
Date |
Price
Featured |
Pivot Featured |
|
Max Buy |
 MLR
-
NYSE
MLR
-
NYSE
Miller Industries Inc
AUTOMOTIVE - Auto Parts
|
$36.65
|
-0.22
-0.60% |
$37.31
|
20,563
44.70% of 50 DAV
50 DAV is 46,000
|
$37.70
-2.79%
|
9/24/2019
|
$34.00
|
PP = $35.36
|
|
MB = $37.13
|
Most Recent Note - 11/26/2019 5:13:53 PM
Y - Perched near its 52-week high. Prior highs in the $35 area define initial support above its 50 DMA line ($34.20). Showed resilience after recently reporting earnings which were below the fundamental guidelines of the fact-based investment system.
>>> FEATURED STOCK ARTICLE : Showing Resilience After Latest Quarter Missed Minimum Guidelines - 11/15/2019 |
View all notes |
Set NEW NOTE alert |
Company Profile |
SEC
News |
Chart |
Request a new note
C
A
S
I |
CCBG
-
NASDAQ
Capital City Bk Gp
BANKING - Regional - Mid-Atlantic Banks
|
$28.93
|
-0.30
-1.03% |
$29.42
|
11,453
26.63% of 50 DAV
50 DAV is 43,000
|
$30.85
-6.22%
|
9/13/2019
|
$27.03
|
PP = $27.05
|
|
MB = $28.40
|
Most Recent Note - 11/26/2019 5:09:49 PM
G - Endured distributional pressure with a loss today on heavier volume. Still extended from the prior base. Prior highs define important support to watch along with its 50 DMA line ($28.12).
>>> FEATURED STOCK ARTICLE : Consolidating After Volume-Driven Gains for New Highs - 11/19/2019 |
View all notes |
Set NEW NOTE alert |
Company Profile |
SEC
News |
Chart |
Request a new note
C
A
S
I |
FTNT
-
NASDAQ
Fortinet Inc
Computer Sftwr-Security
|
$105.11
|
-0.12
-0.11% |
$105.50
|
438,010
31.44% of 50 DAV
50 DAV is 1,393,000
|
$106.00
-0.84%
|
11/11/2019
|
$97.14
|
PP = $97.06
|
|
MB = $101.91
|
Most Recent Note - 11/25/2019 6:21:00 PM
G - Extended from any sound base and it posted a gain today with light volume for a best-ever close. Prior high in the $97 area defines initial support to watch on pullbacks.
>>> FEATURED STOCK ARTICLE : Reversed Into Red Today After Touching New High - 11/11/2019 |
View all notes |
Set NEW NOTE alert |
Company Profile |
SEC
News |
Chart |
Request a new note
C
A
S
I |
SPSC
-
NASDAQ
S P S Commerce Inc
COMPUTER SOFTWARE and SERVICES - Application Software
|
$56.33
|
-1.21
-2.10% |
$57.34
|
161,286
81.05% of 50 DAV
50 DAV is 199,000
|
$59.14
-4.75%
|
11/29/2019
|
$56.59
|
PP = $59.24
|
|
MB = $62.20
|
 Most Recent Note - 11/29/2019 2:25:43 PM
Y - Finished lower with today's 2nd consecutive session marked by below average volume. Highlighted in yellow with new pivot point cited based on its 7/26/19 high plus 10 cents. Consolidating near its all-time high. Subsequent gains above its pivot point backed by at least +40% above average volume are needed to trigger a new technical buy signal. Went through a choppy consolidation and rebounded impressively since a 2:1 split impacted share price on 8/23/19 when it was dropped from the Featured Stocks list. Reported earnings +27% on +13% sales revenues for the Sep '19 quarter, and 3 of the past 4 quarterly comparisons were above the +25% minimum earnings guideline (C criteria). See the latest FSU analysis for more details and a new annotated graph.
>>> FEATURED STOCK ARTICLE : Rebound Leaves Supply Chain Management Software Firm Near High - 11/29/2019 |
View all notes |
Set NEW NOTE alert |
Company Profile |
SEC
News |
Chart |
Request a new note
C
A
S
I |
AUDC
-
NASDAQ
Audiocodes Ltd
ELECTRONICS - Scientific and Technical Instrum
|
$23.97
|
-0.03
-0.13% |
$24.09
|
90,741
31.95% of 50 DAV
50 DAV is 284,000
|
$24.35
-1.56%
|
9/13/2019
|
$19.68
|
PP = $19.84
|
|
MB = $20.83
|
Most Recent Note - 11/27/2019 5:23:55 PM
G - Closed one cent off its best ever close with today's 3rd consecutive gain. Prior highs in the $22 area define initial support above Its 50 DMA line ($20.40). Fundamentals remain strong.
>>> FEATURED STOCK ARTICLE : Volume Totals Cooling After Gains for New Highs - 11/22/2019 |
View all notes |
Set NEW NOTE alert |
Company Profile |
SEC
News |
Chart |
Request a new note
C
A
S
I |
Symbol/Exchange
Company Name
Industry Group |
PRICE |
CHANGE
(%Change) |
Day High |
Volume
(% DAV)
(% 50 day avg vol) |
52 Wk Hi
% From Hi |
Featured
Date |
Price
Featured |
Pivot Featured |
|
Max Buy |
CHDN
-
NASDAQ
Churchill Downs Inc
LEISURE - Gaming Activities
|
$130.01
|
-2.38
-1.80% |
$132.45
|
93,956
30.91% of 50 DAV
50 DAV is 304,000
|
$135.32
-3.92%
|
10/8/2019
|
$129.77
|
PP = $132.83
|
|
MB = $139.47
|
Most Recent Note - 11/25/2019 6:14:00 PM
G - Rallied near its 52-week high with today's 2nd consecutive volume-driven gain. Its 50 DMA line ($127) defines near-term support above the prior low ($121.81 on 11/07/19) The Jun and Sep '19 quarterly earnings versus the year ago periods were both below the +25% minimum guideline (C criteria) and raised fundamental concerns.
>>> FEATURED STOCK ARTICLE : Resilience Shown Despite Another Sub Par Earnings Report - 11/18/2019 |
View all notes |
Set NEW NOTE alert |
Company Profile |
SEC
News |
Chart |
Request a new note
C
A
S
I |
LULU
-
NASDAQ
Lululemon Athletica
MANUFACTURING - Textile Manufacturing
|
$225.69
|
-3.14
-1.37% |
$228.84
|
772,090
47.84% of 50 DAV
50 DAV is 1,614,000
|
$229.65
-1.72%
|
9/6/2019
|
$201.25
|
PP = $194.35
|
|
MB = $204.07
|
Most Recent Note - 11/27/2019 5:25:48 PM
G - Extended from any sound base and it hit another new all-time high with today's 4th consecutive gain. Its 50 DMA line ($203.40) defines important near-term support. See the latest FSU analysis for more details and an annotated graph.
>>> FEATURED STOCK ARTICLE : New High Close Stretches Already Extended Leader - 11/26/2019 |
View all notes |
Set NEW NOTE alert |
Company Profile |
SEC
News |
Chart |
Request a new note
C
A
S
I |
CPRT
-
NASDAQ
Copart Inc
SPECIALTY RETAIL - Auto Dealerships
|
$89.00
|
-1.23
-1.36% |
$90.19
|
1,003,056
61.12% of 50 DAV
50 DAV is 1,641,000
|
$92.41
-3.69%
|
9/5/2019
|
$79.13
|
PP = $79.84
|
|
MB = $83.83
|
Most Recent Note - 11/25/2019 12:41:49 PM
G - Hitting another new all-time high with today's 3rd consecutive volume-driven gain, getting extended from any sound base. Reported earnings +38% on +20% sales revenues for the Oct '19 quarter, continuing its strong earnings track record. The 50 DMA line ($82.70) defines near-term support above the prior low ($80.71 on 11/06/19).
>>> FEATURED STOCK ARTICLE : Gapped Up Following Another Strong Earnings Report - 11/21/2019 |
View all notes |
Set NEW NOTE alert |
Company Profile |
SEC
News |
Chart |
Request a new note
C
A
S
I |
NMIH
-
NASDAQ
N M I Holdings Inc Cl A
Finance-MrtgandRel Svc
|
$33.57
|
-0.49
-1.44% |
$34.00
|
127,722
29.57% of 50 DAV
50 DAV is 432,000
|
$34.50
-2.70%
|
11/8/2019
|
$32.89
|
PP = $31.44
|
|
MB = $33.01
|
Most Recent Note - 11/27/2019 5:16:28 PM
G - Posted a 5th consecutive small gain with below average volume. Volume totals have been cooling while holding its ground stubbornly after rising above its "max buy" level with gains backed by above average volume. See the latest FSU analysis for more details and a new annotated graph.
>>> FEATURED STOCK ARTICLE : Holding Ground Stubbornly Near All-Time High - 11/27/2019 |
View all notes |
Set NEW NOTE alert |
Company Profile |
SEC
News |
Chart |
Request a new note
C
A
S
I |
SPLK
-
NASDAQ
Splunk Inc
Computer Sftwr-Database
|
$149.22
|
-1.78
-1.18% |
$150.89
|
1,131,606
59.00% of 50 DAV
50 DAV is 1,918,000
|
$151.26
-1.35%
|
11/25/2019
|
$147.79
|
PP = $142.16
|
|
MB = $149.27
|
Most Recent Note - 11/27/2019 5:21:44 PM
G - Color code is changed to green after rallying above its "max buy" level. Prior highs in the $142-143 area define initial support to watch on pullbacks.
>>> FEATURED STOCK ARTICLE : Spurt of Volume-Driven Gains Reaches New All-Time High - 11/25/2019 |
View all notes |
Set NEW NOTE alert |
Company Profile |
SEC
News |
Chart |
Request a new note
C
A
S
I |
Symbol/Exchange
Company Name
Industry Group |
PRICE |
CHANGE
(%Change) |
Day High |
Volume
(% DAV)
(% 50 day avg vol) |
52 Wk Hi
% From Hi |
Featured
Date |
Price
Featured |
Pivot Featured |
|
Max Buy |
PAYC
-
NYSE
Paycom Software Inc
COMPUTER SOFTWARE and SERVICES - Application Software
|
$276.81
|
-2.85
-1.02% |
$279.16
|
220,523
36.82% of 50 DAV
50 DAV is 599,000
|
$279.95
-1.12%
|
11/20/2019
|
$252.97
|
PP = $259.81
|
|
MB = $272.80
|
Most Recent Note - 11/27/2019 5:19:24 PM
G - Today's 14th consecutive gain leaves it extended from the prior base. Prior high ($259) defines initial support to watch on pullbacks. It reported earnings +35% on +31% sales revenues for the Sep '19 quarter.
>>> FEATURED STOCK ARTICLE : Powerful Gain for New High Backed by Heavy Volume - 11/20/2019 |
View all notes |
Set NEW NOTE alert |
Company Profile |
SEC
News |
Chart |
Request a new note
C
A
S
I |
BLD
-
NYSE
Topbuild Corp
Bldg-Constr Prds/Misc
|
$110.28
|
-1.98
-1.76% |
$112.69
|
75,102
26.73% of 50 DAV
50 DAV is 281,000
|
$113.74
-3.04%
|
5/17/2019
|
$82.19
|
PP = $87.31
|
|
MB = $91.68
|
Most Recent Note - 11/25/2019 6:18:53 PM
G - Extended from any sound base. Touched a new high today but erased most of its early gain. Reported earnings +24% on +5% sales revenues for the Sep '19 quarter versus the year ago period, just below the +25% minimum guideline (C criteria). Its 50 DMA line ($101) acted as support during its ongoing ascent.
>>> FEATURED STOCK ARTICLE : Perched Near High Following Recent Volume-Driven Gains - 11/12/2019 |
View all notes |
Set NEW NOTE alert |
Company Profile |
SEC
News |
Chart |
Request a new note
C
A
S
I |
GLOB
-
NYSE
Globant SA
Computer-Tech Services
|
$107.00
|
-0.79
-0.73% |
$107.92
|
173,489
65.97% of 50 DAV
50 DAV is 263,000
|
$112.33
-4.74%
|
11/14/2019
|
$106.87
|
PP = $112.43
|
|
MB = $118.05
|
Most Recent Note - 11/26/2019 12:57:17 PM
Y - Color code is changed to yellow while rebounding impressively with 6 consecutive gains after finding prompt support near its 50 DMA line ($96.12). Pulled back abruptly after it reported earnings +35% on +27% sales revenues for the Sep '19 quarter.
>>> FEATURED STOCK ARTICLE : Rallying Near High With 12th Consecutive Gain - 11/14/2019 |
View all notes |
Set NEW NOTE alert |
Company Profile |
SEC
News |
Chart |
Request a new note
C
A
S
I |
|
|
|
THESE ARE NOT BUY RECOMMENDATIONS!
Comments contained in the body of this report are technical
opinions only. The material herein has been obtained
from sources believed to be reliable and accurate, however,
its accuracy and completeness cannot be guaranteed.
This site is not an investment advisor, hence it does
not endorse or recommend any securities or other investments.
Any recommendation contained in this report may not
be suitable for all investors and it is not to be deemed
an offer or solicitation on our part with respect to
the purchase or sale of any securities. All trademarks,
service marks and trade names appearing in this report
are the property of their respective owners, and are
likewise used for identification purposes only.
This report is a service available
only to active Paid Premium Members.
You may opt-out of receiving report notifications
at any time. Questions or comments may be submitted
by writing to Premium Membership Services 665 S.E. 10 Street, Suite 201 Deerfield Beach, FL 33441-5634 or by calling 1-800-965-8307
or 954-785-1121.
|
|
|