Help Lines 954-785-1121


You are not logged in. Upgrade Here
 <<<Previous Mid Day Report     Next Mid Day Report >>> 
 <<<Previous After Market Report Next After Market Report >>> 
You are not logged in.
This means you CAN ONLY VIEW reports that were published prior to Monday, February 19, 2024.
You MUST UPGRADE YOUR MEMBERSHIP if you want to see any current reports.

AFTER MARKET UPDATE - TUESDAY, NOVEMBER 26TH, 2019
Previous After Market Report Next After Market Report >>>
Indices NYSE Nasdaq
DOW  +55.21 28,121.68 +0.20% Volume 1,560,484,860 +90% Volume 2,395,710,760 +6%
NASDAQ +15.44 8,647.93 +0.18% Advancers 1,565 55% Advancers 1,520 49%
S&P 500 +6.88 3,140.52 +0.22% Decliners 1,302 45% Decliners 1,596 51%
Russell 2000 +2.33 1,624.23 +0.14% 52 Wk Highs 147   52 Wk Highs 198  
S&P 600 +0.29 995.57 +0.03% 52 Wk Lows 27   52 Wk Lows 69  

Major Indices Rose With Improved Leadership

The Dow rose 55 points, while the S&P 500 and Nasdaq Composite both added 0.2%. The major averages each rose to another all-time high, with the S&P 500 notching its 12th record closing level in less than a month. Advancers led decliners by an 8-7 margin on the NYSE but decliners narrowly outnumbered advancers on the Nasdaq exchange. Volume totals reported were higher than the prior session on both major exchanges, indicative of increasing institutional buying demand. Leadership improved as there were 77 high-ranked companies from the Leaders List that hit a new 52-week high and were listed on the BreakOuts Page, versus the total of 71 on the prior session. New 52-week highs outnumbered new 52-week lows on the NYSE and on the Nasdaq exchange. The major indices (M criteria) are in a "confirmed uptrend" after enduring distributional pressure in recent weeks. The Featured Stocks Page provides the most timely analysis on high-ranked leaders.

Charts used courtesy of www.stockcharts.com

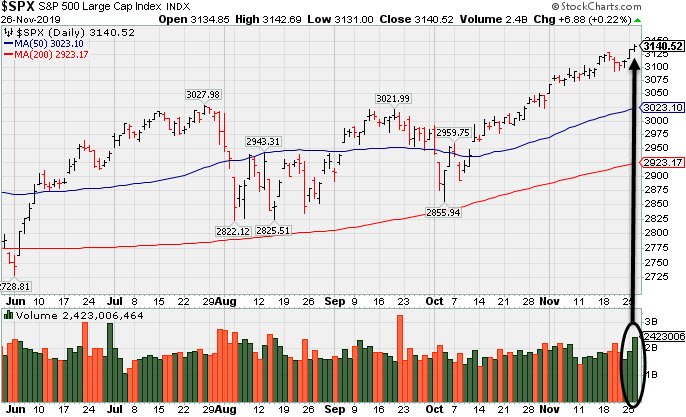
PICTURED: The S&P 500 Index  rallied for a new record high close with a gain backed by higher volume. 

US Stocks finished higher on Tuesday, as investors assessed developments on the trade front. Overnight, China’s Ministry of Commerce revealed Washington and Beijing “reached consensus on properly resolving relevant issues” during a phone conversation with top officials. Comments from President Trump that the U.S. was nearing a preliminary trade deal further boosted investor sentiment. 

On the data front, an update from the Conference Board showed consumer confidence unexpectedly fell in November, sending the gauge lower for a fourth straight month. Wholesale inventories rebounded 0.2% in October from the prior month’s downwardly revised 0.7% decline. A separate release showed advance goods trade deficit narrowed in October. Another report showed new home sales dipped 0.7% in October, but the prior month’s reading was upwardly revised to a 4.5% increase, marking the best two-month pace in more than 12 years. Treasuries advanced with the yield on the 10-year note off two basis point to 1.74%.

Eight of 11 S&P 500 sectors finished in positive territory. Retail earnings remained in focus, with Best Buy (BBY +9.86%) rose following its quarterly results that included a top and bottom line beat and a boost to its full-year outlook. Dick’s Sporting Goods (DKS +18.62%) rose after its comparable-store sales jumped more than double analyst’s forecasts. Dollar Tree (DLTR -15.24%) after reporting that tariffs are expected to pressure fourth-quarter profit margins.

Kenneth J. Gruneisen started out as a licensed stockbroker in August 1987, a couple of months prior to the historic stock market crash that took the Dow Jones Industrial Average down -22.6% in a single day. He has published daily fact-based fundamental and technical analysis on high-ranked stocks online for two decades. Through FACTBASEDINVESTING.COM, Kenneth provides educational articles, news, market commentary, and other information regarding proven investment systems that work in good times and bad.

Comments contained in the body of this report are technical opinions only and are not necessarily those of Gruneisen Growth Corp. The material herein has been obtained from sources believed to be reliable and accurate, however, its accuracy and completeness cannot be guaranteed. Our firm, employees, and customers may effect transactions, including transactions contrary to any recommendation herein, or have positions in the securities mentioned herein or options with respect thereto. Any recommendation contained in this report may not be suitable for all investors and it is not to be deemed an offer or solicitation on our part with respect to the purchase or sale of any securities.


Gold & Silver Index and Retail Index Led Group Gainers

The Retail Index ($RLX +0.81%) posted a solid gain while the Broker/Dealer Index ($XBD -0.38%) and Bank Index ($BKX -0.54%) both ended slightly lower on Tuesday. The tech sector had a negative bias as the Semiconductor Index ($SOX -0.50%) and the Networking Index ($NWX -1.24%) both lost ground and the Biotech Index ($BTK +0.10%) eked out a small gain. Commodity-linked ground were mixed, with the Oil Services Index ($OSX -2.53%) outpacing the Integrated Oil Index ($XOI -1.08%) to the downside, meanwhile, the Gold & Silver Index ($XAU +1.99%) was a standout gainer on the session.
Charts courtesy of www.stockcharts.com

PICTURED: The Oil Services Index ($OSX -2.53%)  is consolidating near its 50 DMA line.

Industry Index Symbol Close Change % Change YTD % Change
Oil Services $OSX  67.49 -1.75 -2.53% -16.27%
Integrated Oil $XOI  1,212.92 -13.21 -1.08% +4.64%
Semiconductor $SOX  1,723.26 -8.69 -0.50% +49.18%
Networking $NWX  576.63 -7.23 -1.24% +18.00%
Broker/Dealer $XBD  288.11 -1.11 -0.38% +21.39%
Retail $RLX  2,402.61 +19.40 +0.81% +23.12%
Gold & Silver $XAU  94.74 +1.85 +1.99% +34.08%
Bank $BKX  109.42 -0.60 -0.55% +27.54%
Biotech $BTK  4,955.39 +5.15 +0.10% +17.40%


New High Close Stretches Already Extended Leader

Lululemon Athletica (LULU +$0.68 or +0.31% to $222.84) is extended from any sound base and managed a new all-time high close with today's gain. It found prompt support near its 50-day moving average (DMA) line ($202.73) on pullbacks during its ongoing ascent. The prior low ($191.21 on 11/05/19) defines the next important near-term support.

It was last shown in this FSU section was on 11/04/19 with an annotated graph under the headline, "Testing 50-Day Moving Average With Loss on Above Average Volume". LULU reported earnings +35% on +22% sales revenues for the Jul '19 quarter, marking its 7th consecutive quarterly comparison above the +25% minimum guideline (C criteria). Recent quarterly comparisons showed stronger sales revenues and earnings improvement helping it match with the fact-based investment system's fundamental guidelines. It has a new CEO as of 8/20/18. It currently has a 96 Earnings Per Share Rating. Its Timeliness rating is A and Sponsorship rating is C.

The number of top-rated funds owning its shares rose from 1,041 in Jun '18 to 1,421 in Sep '19, a good sign concerning the I criteria. LULU was first featured in yellow at $23.83 (split adjusted after 2:1 split effective 7/21/11) in the October 8, 2010 mid-day report (read here) and it traded up as much as +163.7% in a little more than 9 months. As previously noted - "In a bullish market, many high-ranked leaders offer multiple opportunities to accumulate their shares under the fact-based system's strict guidelines. Patience may often allow another ideal base or secondary buy point to possibly develop and be noted."  

Charts courtesy of www.stockcharts.com


Color Codes Explained :
Y - Better candidates highlighted by our staff of experts.
G - Previously featured in past reports as yellow but may no longer be buyable under the guidelines.

***Last / Change / Volume data in this table is the closing quote data***
Symbol/Exchange
Company Name
Industry Group
PRICE CHANGE
(%Change)
Day High Volume
(% DAV)
(% 50 day avg vol)
52 Wk Hi
% From Hi
Featured
Date
Price
Featured
Pivot Featured
Max Buy
StockCharts.com Latest Chart for MLR MLR - NYSE
Miller Industries Inc
AUTOMOTIVE - Auto Parts  
$36.82 +0.67
1.85%

$37.19

45,867
101.93% of 50 DAV
50 DAV is 45,000
$37.70
-2.33%
9/24/2019 $34.00 PP = $35.36
MB = $37.13
Most Recent Note - 11/26/2019 5:13:53 PM
Y - Perched near its 52-week high. Prior highs in the $35 area define initial support above its 50 DMA line ($34.20). Showed resilience after recently reporting earnings which were below the fundamental guidelines of the fact-based investment system.

>>> FEATURED STOCK ARTICLE : Showing Resilience After Latest Quarter Missed Minimum Guidelines - 11/15/2019
 |  View all notes | Set NEW NOTE alert | Company Profile | SEC News | Chart | Request a new note C A  S  I 
StockCharts.com Latest Chart for CCBG CCBG - NASDAQ
Capital City Bk Gp
BANKING - Regional - Mid-Atlantic Banks  
$28.88 -0.47
-1.60%

$29.44

197,787
494.47% of 50 DAV
50 DAV is 40,000
$30.85
-6.39%
9/13/2019 $27.03 PP = $27.05
MB = $28.40
Most Recent Note - 11/26/2019 5:09:49 PM
G - Endured distributional pressure with a loss today on heavier volume. Still extended from the prior base. Prior highs define important support to watch along with its 50 DMA line ($28.12).
>>> FEATURED STOCK ARTICLE : Consolidating After Volume-Driven Gains for New Highs - 11/19/2019
 |  View all notes | Set NEW NOTE alert | Company Profile | SEC News | Chart | Request a new note C A  S  I 
StockCharts.com Latest Chart for FTNT FTNT - NASDAQ
Fortinet Inc
Computer Sftwr-Security  
$104.37 -0.77
-0.73%

$105.38

1,750,314
126.38% of 50 DAV
50 DAV is 1,385,000
$106.00
-1.54%
11/11/2019 $97.14 PP = $97.06
MB = $101.91
Most Recent Note - 11/25/2019 6:21:00 PM
G - Extended from any sound base and it posted a gain today with light volume for a best-ever close. Prior high in the $97 area defines initial support to watch on pullbacks.
>>> FEATURED STOCK ARTICLE : Reversed Into Red Today After Touching New High - 11/11/2019
 |  View all notes | Set NEW NOTE alert | Company Profile | SEC News | Chart | Request a new note C A  S  I 
StockCharts.com Latest Chart for AUDC AUDC - NASDAQ
Audiocodes Ltd
ELECTRONICS - Scientific and Technical Instrum  
$23.45 +0.49
2.13%

$23.50

198,641
68.97% of 50 DAV
50 DAV is 288,000
$24.35
-3.70%
9/13/2019 $19.68 PP = $19.84
MB = $20.83
Most Recent Note - 11/26/2019 5:15:18 PM
G - Volume totals have generally been cooling while still hovering near its all-time high following gains marked by heavy volume. Prior highs in the $22 area define initial support above Its 50 DMA line ($20.34). Bullish action came after it reported earnings +26% on +15% sales revenues for the Sep '19 quarter, continuing its strong earnings track record.
>>> FEATURED STOCK ARTICLE : Volume Totals Cooling After Gains for New Highs - 11/22/2019
 |  View all notes | Set NEW NOTE alert | Company Profile | SEC News | Chart | Request a new note C A  S  I 
StockCharts.com Latest Chart for CHDN CHDN - NASDAQ
Churchill Downs Inc
LEISURE - Gaming Activities  
$131.04 -0.60
-0.46%

$132.96

422,218
143.61% of 50 DAV
50 DAV is 294,000
$135.32
-3.16%
10/8/2019 $129.77 PP = $132.83
MB = $139.47
Most Recent Note - 11/25/2019 6:14:00 PM
G - Rallied near its 52-week high with today's 2nd consecutive volume-driven gain. Its 50 DMA line ($127) defines near-term support above the prior low ($121.81 on 11/07/19) The Jun and Sep '19 quarterly earnings versus the year ago periods were both below the +25% minimum guideline (C criteria) and raised fundamental concerns.
>>> FEATURED STOCK ARTICLE : Resilience Shown Despite Another Sub Par Earnings Report - 11/18/2019
 |  View all notes | Set NEW NOTE alert | Company Profile | SEC News | Chart | Request a new note C A  S  I 
Symbol/Exchange
Company Name
Industry Group
PRICE CHANGE
(%Change)
Day High Volume
(% DAV)
(% 50 day avg vol)
52 Wk Hi
% From Hi
Featured
Date
Price
Featured
Pivot Featured
Max Buy
StockCharts.com Latest Chart for LULU LULU - NASDAQ
Lululemon Athletica
MANUFACTURING - Textile Manufacturing  
$222.84 +0.68
0.31%

$225.01

1,494,562
93.35% of 50 DAV
50 DAV is 1,601,000
$226.66
-1.69%
9/6/2019 $201.25 PP = $194.35
MB = $204.07
Most Recent Note - 11/26/2019 5:08:09 PM
G - Extended from any sound base and managed another new all-time high close with today's gain. Found prompt support near its 50 DMA line ($202) on pullbacks during its ongoing ascent. The prior low ($191.21 on 11/05/19) defines the next important near-term support. See the latest FSU analysis for more details and a new annotated graph.
>>> FEATURED STOCK ARTICLE : New High Close Stretches Already Extended Leader - 11/26/2019
 |  View all notes | Set NEW NOTE alert | Company Profile | SEC News | Chart | Request a new note C A  S  I 
StockCharts.com Latest Chart for CPRT CPRT - NASDAQ
Copart Inc
SPECIALTY RETAIL - Auto Dealerships  
$90.80 +0.86
0.96%

$90.95

2,199,495
136.53% of 50 DAV
50 DAV is 1,611,000
$92.41
-1.74%
9/5/2019 $79.13 PP = $79.84
MB = $83.83
Most Recent Note - 11/25/2019 12:41:49 PM
G - Hitting another new all-time high with today's 3rd consecutive volume-driven gain, getting extended from any sound base. Reported earnings +38% on +20% sales revenues for the Oct '19 quarter, continuing its strong earnings track record. The 50 DMA line ($82.70) defines near-term support above the prior low ($80.71 on 11/06/19).
>>> FEATURED STOCK ARTICLE : Gapped Up Following Another Strong Earnings Report - 11/21/2019
 |  View all notes | Set NEW NOTE alert | Company Profile | SEC News | Chart | Request a new note C A  S  I 
StockCharts.com Latest Chart for NMIH NMIH - NASDAQ
N M I Holdings Inc Cl A
Finance-MrtgandRel Svc  
$33.58 +0.22
0.66%

$33.85

276,860
64.24% of 50 DAV
50 DAV is 431,000
$34.50
-2.67%
11/8/2019 $32.89 PP = $31.44
MB = $33.01
Most Recent Note - 11/25/2019 6:17:09 PM
G - Volume totals have been cooling while holding its ground stubbornly after rising above its "max buy" level with gains backed by above average volume. Reported earnings +54% on +42% sales revenues for the Sep '19 quarter, and prior quarterly comparisons were also well above the +25% minimum guideline (C criteria). After years of losses it had profitable years for FY '16, '17, and '18.
>>> FEATURED STOCK ARTICLE : Hit New High With Volume-Driven Gains - 11/8/2019
 |  View all notes | Set NEW NOTE alert | Company Profile | SEC News | Chart | Request a new note C A  S  I 
StockCharts.com Latest Chart for SPLK SPLK - NASDAQ
Splunk Inc
Computer Sftwr-Database  
$147.52 -0.12
-0.08%

$149.70

3,158,235
167.10% of 50 DAV
50 DAV is 1,890,000
$148.18
-0.45%
11/25/2019 $147.79 PP = $142.16
MB = $149.27
Most Recent Note - 11/26/2019 1:15:43 PM
Y - Trading up today, hitting new all-time highs near its "max buy" level and on track for an 8th consecutive gain. Finished strong after highlighted in yellow with pivot point cited based on its 7/26/19 high plus 10 cents in the prior mid-day report. The big gain and strong close above the pivot point was backed by +349% above average volume clinching a convincing new technical buy signal. Fundamentals remain strong. Bullish action came last week as it gapped up on 11/22/19 after reporting earnings +53% on +30% sales revenues versus the year ago period ended October 31st. See the latest FSU analysis for more details and an annotated graph.
>>> FEATURED STOCK ARTICLE : Spurt of Volume-Driven Gains Reaches New All-Time High - 11/25/2019
 |  View all notes | Set NEW NOTE alert | Company Profile | SEC News | Chart | Request a new note C A  S  I 
StockCharts.com Latest Chart for PAYC PAYC - NYSE
Paycom Software Inc
COMPUTER SOFTWARE and SERVICES - Application Software  
$274.10 +6.86
2.57%

$275.33

894,227
149.54% of 50 DAV
50 DAV is 598,000
$269.18
1.83%
11/20/2019 $252.97 PP = $259.81
MB = $272.80
Most Recent Note - 11/26/2019 5:12:42 PM
G - Color code is changed to green after today's 13th consecutive gain as it closed above its "max buy" level. Prior high ($259) defines initial support to watch on pullbacks. It reported earnings +35% on +31% sales revenues for the Sep '19 quarter.
>>> FEATURED STOCK ARTICLE : Powerful Gain for New High Backed by Heavy Volume - 11/20/2019
 |  View all notes | Set NEW NOTE alert | Company Profile | SEC News | Chart | Request a new note C A  S  I 
Symbol/Exchange
Company Name
Industry Group
PRICE CHANGE
(%Change)
Day High Volume
(% DAV)
(% 50 day avg vol)
52 Wk Hi
% From Hi
Featured
Date
Price
Featured
Pivot Featured
Max Buy
StockCharts.com Latest Chart for BLD BLD - NYSE
Topbuild Corp
Bldg-Constr Prds/Misc  
$112.21 +2.23
2.03%

$112.24

286,915
101.38% of 50 DAV
50 DAV is 283,000
$112.71
-0.44%
5/17/2019 $82.19 PP = $87.31
MB = $91.68
Most Recent Note - 11/25/2019 6:18:53 PM
G - Extended from any sound base. Touched a new high today but erased most of its early gain. Reported earnings +24% on +5% sales revenues for the Sep '19 quarter versus the year ago period, just below the +25% minimum guideline (C criteria). Its 50 DMA line ($101) acted as support during its ongoing ascent.
>>> FEATURED STOCK ARTICLE : Perched Near High Following Recent Volume-Driven Gains - 11/12/2019
 |  View all notes | Set NEW NOTE alert | Company Profile | SEC News | Chart | Request a new note C A  S  I 
StockCharts.com Latest Chart for GLOB GLOB - NYSE
Globant SA
Computer-Tech Services  
$107.83 +2.73
2.60%

$108.12

762,634
302.63% of 50 DAV
50 DAV is 252,000
$112.33
-4.01%
11/14/2019 $106.87 PP = $112.43
MB = $118.05
Most Recent Note - 11/26/2019 12:57:17 PM
Y - Color code is changed to yellow while rebounding impressively with 6 consecutive gains after finding prompt support near its 50 DMA line ($96.12). Pulled back abruptly after it reported earnings +35% on +27% sales revenues for the Sep '19 quarter.
>>> FEATURED STOCK ARTICLE : Rallying Near High With 12th Consecutive Gain - 11/14/2019
 |  View all notes | Set NEW NOTE alert | Company Profile | SEC News | Chart | Request a new note C A  S  I 

THESE ARE NOT BUY RECOMMENDATIONS!  Comments contained in the body of this report are technical opinions only. The material herein has been obtained from sources believed to be reliable and accurate, however, its accuracy and completeness cannot be guaranteed. This site is not an investment advisor, hence it does not endorse or recommend any securities or other investments. Any recommendation contained in this report may not be suitable for all investors and it is not to be deemed an offer or solicitation on our part with respect to the purchase or sale of any securities. All trademarks, service marks and trade names appearing in this report are the property of their respective owners, and are likewise used for identification purposes only.

This report is a service available only to active Paid Premium Members. You may opt-out of receiving report notifications at any time.  Questions or comments may be submitted by writing to Premium Membership Services 665 S.E. 10 Street, Suite 201 Deerfield Beach, FL 33441-5634 or by calling 1-800-965-8307 or 954-785-1121.

Kenneth J. Gruneisen founded Gruneisen Growth Corp. (2003), which prior to May 11, 2015, operated CANSLIM.net and CANSLIM.com both under license from Data Analysis Inc. / Investor's Business Daily. Kenneth has passed the CAN SLIM® Master's Exam. Gruneisen Growth Corp. now continues over two decades of fact based market analysis via FactBasedInvesting.com.

Copyright © 1996-2024 Gruneisen Growth Corp. All rights reserved. Protected by the copyright laws of the United States and Canada and by international treaties

Privacy Policy | Terms of Use | Contact Us