You are not logged in.
This means you
CAN ONLY VIEW reports that were published prior to Sunday, February 25, 2024.
You
MUST UPGRADE YOUR MEMBERSHIP if you want to see any current reports.
AFTER MARKET UPDATE - MONDAY, NOVEMBER 26TH, 2018
Previous After Market Report Next After Market Report >>>
|
|
|
|
DOW |
+354.29 |
24,640.24 |
+1.46% |
|
Volume |
853,728,640 |
+94% |
|
Volume |
1,995,231,310 |
+109% |
|
NASDAQ |
+142.87 |
7,081.85 |
+2.06% |
|
Advancers |
1,900 |
63% |
|
Advancers |
1,852 |
60% |
|
S&P 500 |
+40.89 |
2,673.45 |
+1.55% |
|
Decliners |
1,092 |
36% |
|
Decliners |
1,238 |
40% |
|
Russell 2000 |
+17.28 |
1,505.96 |
+1.16% |
|
52 Wk Highs |
14 |
|
|
52 Wk Highs |
19 |
|
|
S&P 600 |
+8.84 |
946.40 |
+0.94% |
|
52 Wk Lows |
146 |
|
|
52 Wk Lows |
122 |
|
|
 |
Major Indices Rose With Leadership Remaining Thin
Kenneth J. Gruneisen - Passed the CAN SLIM® Master's Exam
Stocks finished higher Monday. The Dow climbed 354 points to 24,640, while the S&P 500 added 40 points to 2,673. The Nasdaq Composite was up 142 points to 7,081. The volume totals session were clearly higher than the prior shortened session totals on the NYSE and on the Nasdaq exchange. Breadth was positive as advancers led decliners by a 9-5 margin on the NYSE and 3-2 on the Nasdaq exchange. There were 6 high-ranked companies from the Leaders List that made new 52-week highs and were listed on the BreakOuts Page, versus the 4 on the prior session. New 52-week lows totals again solidly outnumbered new 52-week highs totals on the NYSE and on the Nasdaq exchange. Technically, the last rally failed and the major indices (M criteria) are again in a correction. The Featured Stocks Page provides the most timely analysis on high-ranked leaders. Strict buying and selling rules should always be followed on a case by case basis. Charts used courtesy of www.stockcharts.com
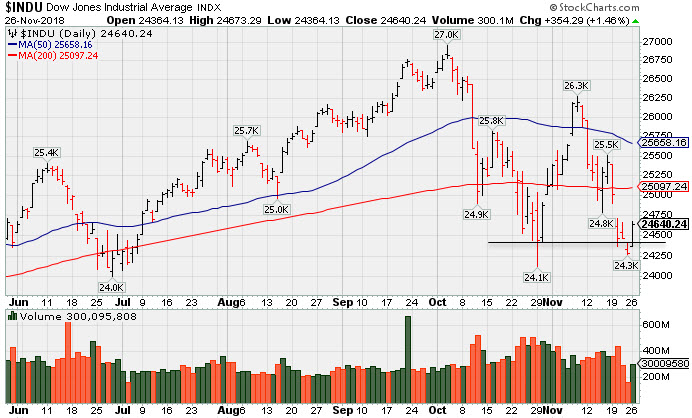
PICTURED: The Dow Jones Industrial Average posted a gain on Monday. Recently it undercut the prior rally's Day 1 low while sputtering below its 200-day moving average (DMA) line near the October low.
The major averages rebounded as broad strength in retailers and Tech-related stocks lifted investor sentiment. On the data front, an update revealed business activity increased more than expected during the month of October in the Chicago Fed District. A separate survey showed manufacturing activity in the Dallas Fed Region decreased more than projected in November.
All 11 S&P 500 sectors closed in positive territory with Consumer Discretionary shares pacing gains, up 2.6%. Amazon (AMZN +5.28%) rose as “Black-Friday” and “Cyber-Monday” sales figures provided a tailwind to online retailers. Tech and Financials also outperformed, with each group advancing more than 2.1%. The oft-cited “FAANG” group bounced back from last week’s decline, climbing 2.7% on the session. In other news, General Motors (GM +4.79%) rose after the automaker announced a corporate restructuring which included a 15% reduction in its workforce, as well as new investments in electric vehicles.
Treasuries were weaker with the yield on the benchmark 10-year note up two basis points to 3.07%. In commodities, WTI crude rebounded 2.4% to $51.63/barrel after posting its worst week since January 2016. COMEX gold was off 0.1% to $1,222.60/ounce amid a stronger dollar. |
 Kenneth J. Gruneisen started out as a licensed stockbroker in August 1987, a couple of months prior to the historic stock market crash that took the Dow Jones Industrial Average down -22.6% in a single day. He has published daily fact-based fundamental and technical analysis on high-ranked stocks online for two decades. Through FACTBASEDINVESTING.COM, Kenneth provides educational articles, news, market commentary, and other information regarding proven investment systems that work in good times and bad.
Comments contained in the body of this report are technical opinions only and are not necessarily those of Gruneisen Growth Corp. The material herein has been obtained from sources believed to be reliable and accurate, however, its accuracy and completeness cannot be guaranteed. Our firm, employees, and customers may effect transactions, including transactions contrary to any recommendation herein, or have positions in the securities mentioned herein or options with respect thereto. Any recommendation contained in this report may not be suitable for all investors and it is not to be deemed an offer or solicitation on our part with respect to the purchase or sale of any securities. |
|
 |
Retail, Tech, Financial, and Energy-Linked Groups Rose
Kenneth J. Gruneisen - Passed the CAN SLIM® Master's Exam
The Retail Index ($RLX +3.06%), Broker/Dealer Index ($XBD +1.61%), and the Bank Index ($BKX +2.26%) each finished solidly higher. The Biotech Index ($BTK +2.33%), Semiconductor Index ($SOX +1.91%), and the Networking Index ($NWX +1.59%) posted unanimous gains. Commodity-linked groups were mixed as the Oil Services Index ($OSX +1.70%) and Integrated Oil Index ($XOI +1.73%) rose while the Gold & Silver Index ($XAU -0.83%) suffered a modest loss.
Charts courtesy of www.stockcharts.com
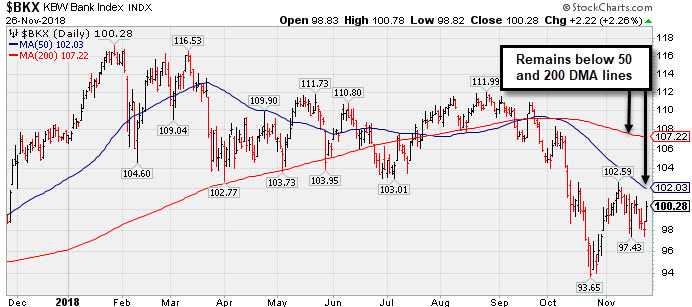 PICTURED: The Bank Index ($BKX +2.26%) is still sputtering below its 50-day and 200-day moving average (DMA) lines after slumping to new 2018 low in October.
| Oil Services |
$OSX |
105.57 |
+1.76 |
+1.70% |
-29.41% |
| Integrated Oil |
$XOI |
1,284.67 |
+21.85 |
+1.73% |
-3.81% |
| Semiconductor |
$SOX |
1,201.72 |
+22.48 |
+1.91% |
-4.10% |
| Networking |
$NWX |
508.79 |
+7.97 |
+1.59% |
+3.72% |
| Broker/Dealer |
$XBD |
261.09 |
+4.13 |
+1.61% |
-1.56% |
| Retail |
$RLX |
2,022.52 |
+60.08 |
+3.06% |
+16.65% |
| Gold & Silver |
$XAU |
64.73 |
-0.54 |
-0.83% |
-24.09% |
| Bank |
$BKX |
100.28 |
+2.21 |
+2.25% |
-6.03% |
| Biotech |
$BTK |
4,650.22 |
+105.98 |
+2.33% |
+10.14% |
|
|
|
 |
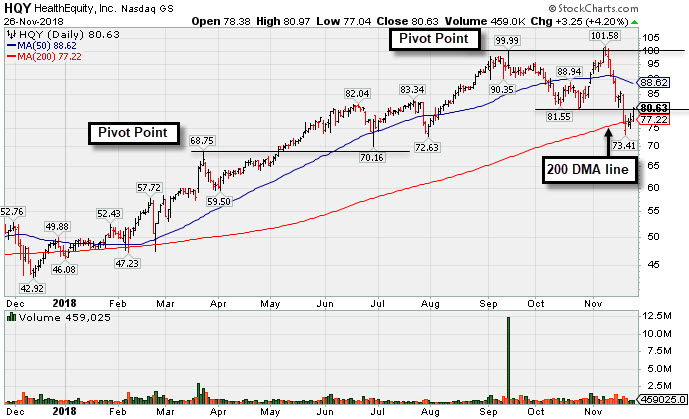
Found Support at 200-Day Average But Faces Overhead Supply
Kenneth J. Gruneisen - Passed the CAN SLIM® Master's Exam
Healthequity Inc (HQY +$3.25 or +4.20% to $80.63) found support while recently sputtering near its 200-day moving average (DMA) line ($77.22) after damaging losses violated the prior low ($80.56 on 10/24/18) triggering a technical sell signal. A subsequent rebound above the 50 DMA line ($88.62) is needed for its outlook to improve. It now faces resistance due to overhead supply up to the $99 level.
HQY was last shown in this FSU section on 11/01/18 with an annotated graph under the headline, "Rebound Above 50-Day Average Helped Outlook Improve". It reported earnings +62% on +25% sales revenues for the Jul '18 quarter versus the year ago period, continuing its strong earnings track record. Fundamentals remain strong, as the past 7 quarterly comparisons were above the +25% minimum earnings guideline (C criteria) and underpinned by strong sales revenues increases.
It has managed a bumpy climb that may have shaken out many investors since triggering a technical buy signal with a gain above the new pivot point with +90% above average volume when highlighted in the 2/20/18 mid-day report (read here).
The number of top-rated funds owning its shares rose from 369 in Dec '16 to 547 in Sep '18, a reassuring sign concerning the I criteria. Its current Up/Down Volume Ratio of 1.4 is also an unbiased indication its shares have been under accumulation over the past 50 days. It has a fairly small supply of only 62.3 million shares (S criteria) outstanding, which can contribute to greater price volatility in the event of institutional buying or selling. It currently has a Timeliness Rating of B and a Sponsorship Rating of B.
The Commercial Services - Outsourcing industry group currently has a Group Relative Strength Rating of 49, however there are other strong leaders in the group, a reassuring sign concerning the L criteria. It completed its $14 IPO on 7/31/14 followed by an additional Public Offering on 5/05/15 and Secondary Offerings on both 10/20/16 and 9/23/15. |
|
|
Color Codes Explained :
Y - Better candidates highlighted by our
staff of experts.
G - Previously featured
in past reports as yellow but may no longer be buyable under the
guidelines.
***Last / Change / Volume data in this table is the closing quote data***
Symbol/Exchange
Company Name
Industry Group |
PRICE |
CHANGE
(%Change) |
Day High |
Volume
(% DAV)
(% 50 day avg vol) |
52 Wk Hi
% From Hi |
Featured
Date |
Price
Featured |
Pivot Featured |
|
Max Buy |
MPX
-
NYSE
Marine Products Corp
AUTOMOTIVE - Recreational Vehicles
|
$21.67
|
+0.37
1.74% |
$21.85
|
78,950
179.43% of 50 DAV
50 DAV is 44,000
|
$24.82
-12.69%
|
10/24/2018
|
$23.00
|
PP = $24.92
|
|
MB = $26.17
|
 Most Recent Note - 11/26/2018 1:09:42 PM
G - Sputtering above the recent low ($20.25 on 10/26/18) previously noted as important near-term support. A rebound above the 50 DMA line ($22.10) is needed for its outlook to improve. Subsequent gains above the pivot point backed by at least +40% above average volume may trigger a technical buy signal.
>>> FEATURED STOCK ARTICLE : Perched Within Striking Distance of Pivot Point - 11/13/2018 |
View all notes |
Set NEW NOTE alert |
Company Profile |
SEC
News |
Chart |
Request a new note
C
A
S
I |
GMED
-
NYSE
Globus Medical Inc Cl A
CHEMICALS - Specialty Chemicals
|
$50.81
|
-0.66
-1.28% |
$51.95
|
388,840
51.03% of 50 DAV
50 DAV is 762,000
|
$57.83
-12.14%
|
9/26/2018
|
$56.11
|
PP = $57.65
|
|
MB = $60.53
|
Most Recent Note - 11/20/2018 1:08:55 PM
G - The longer it lingers below its 200 DMA line ($51.78) and its 50 DMA line ($53.03) the worse its outlook gets. Remains only -12.4% off its all-time high, but more damaging losses would raise serious concerns.
>>> FEATURED STOCK ARTICLE : Consolidating -5.2% Off 52-Week High Ahead of Earnings News - 11/5/2018 |
View all notes |
Set NEW NOTE alert |
Company Profile |
SEC
News |
Chart |
Request a new note
C
A
S
I |
ZBRA
-
NASDAQ
Zebra Tech Corp Cl A
COMPUTER HARDWARE - Computer Peripherals
|
$169.04
|
+4.04
2.45% |
$169.28
|
194,744
41.61% of 50 DAV
50 DAV is 468,000
|
$184.75
-8.50%
|
11/6/2018
|
$170.41
|
PP = $179.57
|
|
MB = $188.55
|
Most Recent Note - 11/26/2018 7:19:52 PM
G - Consolidating near its 50 DMA line ($169). The prior lows and 200 DMA line ($153) define important near-term support to watch.
>>> FEATURED STOCK ARTICLE : Hit New High Following Another Strong Earnings Increase - 11/6/2018 |
View all notes |
Set NEW NOTE alert |
Company Profile |
SEC
News |
Chart |
Request a new note
C
A
S
I |
CME
-
NASDAQ
C M E Group Inc
DIVERSIFIED SERVICES - Business/Management Services
|
$191.52
|
+2.21
1.17% |
$192.14
|
1,393,954
71.85% of 50 DAV
50 DAV is 1,940,000
|
$197.08
-2.82%
|
10/4/2018
|
$179.29
|
PP = $177.45
|
|
MB = $186.32
|
Most Recent Note - 11/20/2018 1:05:31 PM
G - Pulling back from its all-time high with a loss today, it tallied 16 gains in the prior 17 sessions. Its 50 DMA line ($180) defines near-term support. Strength continued after reporting earnings +22% on +2% sales revenues for the Sep '18 quarter, below the +25% minimum earnings guideline (C criteria), raising fundamental concerns.
>>> FEATURED STOCK ARTICLE : Extended From Base After More Gain With Above Average Volume - 11/15/2018 |
View all notes |
Set NEW NOTE alert |
Company Profile |
SEC
News |
Chart |
Request a new note
C
A
S
I |
GDOT
-
NYSE
Green Dot Corp Cl A
FINANCIAL SERVICES - Credit Services
|
$79.54
|
+2.66
3.46% |
$79.58
|
291,555
62.17% of 50 DAV
50 DAV is 469,000
|
$93.00
-14.47%
|
11/8/2018
|
$90.35
|
PP = $91.61
|
|
MB = $96.19
|
Most Recent Note - 11/26/2018 7:07:41 PM
G - Posted a gain with light volume. Its 200 DMA line ($74.82) and prior low ($71.50 on 10/29/18) define important near-term support.
>>> FEATURED STOCK ARTICLE : Volume Heavy Behind Rally to New High - 11/8/2018 |
View all notes |
Set NEW NOTE alert |
Company Profile |
SEC
News |
Chart |
Request a new note
C
A
S
I |
Symbol/Exchange
Company Name
Industry Group |
PRICE |
CHANGE
(%Change) |
Day High |
Volume
(% DAV)
(% 50 day avg vol) |
52 Wk Hi
% From Hi |
Featured
Date |
Price
Featured |
Pivot Featured |
|
Max Buy |
ULTA
-
NASDAQ
Ulta Beauty Inc
SPECIALTY RETAIL - Specialty Retail, Other
|
$301.11
|
-2.21
-0.73% |
$309.22
|
1,135,530
124.51% of 50 DAV
50 DAV is 912,000
|
$322.49
-6.63%
|
11/8/2018
|
$296.36
|
PP = $290.40
|
|
MB = $304.92
|
Most Recent Note - 11/26/2018 7:18:02 PM
G - Encountering distributional pressure while churning near its all-time high. Prior high ($290) defines initial support to watch above its 50 DMA line ($285).
>>> FEATURED STOCK ARTICLE : Volume Driven Gains Indicate Institutional Buying Demand - 11/9/2018 |
View all notes |
Set NEW NOTE alert |
Company Profile |
SEC
News |
Chart |
Request a new note
C
A
S
I |
UBNT
-
NASDAQ
Ubiquiti Networks Inc
TELECOMMUNICATIONS - Diversified Communication Serv
|
$110.22
|
+1.69
1.56% |
$111.63
|
233,969
46.24% of 50 DAV
50 DAV is 506,000
|
$112.45
-1.98%
|
11/9/2018
|
$108.20
|
PP = $101.43
|
|
MB = $106.50
|
Most Recent Note - 11/20/2018 1:12:16 PM
G - After intra-day lows today briefly undercut its "max buy" level it is still stubbornly holding its ground near its all-time high. Disciplined investors avoid chasing stocks more than +5% above the pivot point. Prior high ($101.33 on 9/25/18) defines initial support to watch on pullbacks.
>>> FEATURED STOCK ARTICLE : Pullback Following Breakout Gain on After Latest Earnings Report - 11/12/2018 |
View all notes |
Set NEW NOTE alert |
Company Profile |
SEC
News |
Chart |
Request a new note
C
A
S
I |
FIVE
-
NASDAQ
Five Below Inc
Retail-DiscountandVariety
|
$104.50
|
+1.67
1.62% |
$105.13
|
1,212,555
137.32% of 50 DAV
50 DAV is 883,000
|
$136.13
-23.24%
|
7/6/2018
|
$98.90
|
PP = $104.09
|
|
MB = $109.29
|
Most Recent Note - 11/20/2018 1:00:06 PM
G - Gapped down today and undercut the prior low ($108.76 on 10/26/18) triggering a technical sell signal amid broader market weakness (M criteria). A rebound above the 50 DMA line ($120.47) is needed for its outlook to improve.
>>> FEATURED STOCK ARTICLE : Consolidating Near 50-Day Moving Average After Finding Support - 11/14/2018 |
View all notes |
Set NEW NOTE alert |
Company Profile |
SEC
News |
Chart |
Request a new note
C
A
S
I |
HQY
-
NASDAQ
Healthequity Inc
COMPUTER SOFTWARE and SERVICES - Healthcare Information Service
|
$80.63
|
+3.25
4.20% |
$80.97
|
450,587
48.92% of 50 DAV
50 DAV is 921,000
|
$101.58
-20.62%
|
11/2/2018
|
$95.56
|
PP = $100.09
|
|
MB = $105.09
|
Most Recent Note - 11/26/2018 7:04:13 PM
G - Tallied another gain today with very light volume. Sputtering near its 200 DMA line after a damaging loss violated the prior low ($80.56 on 10/24/18) triggering a technical sell signal. A rebound above the 50 DMA line ($88.62) is needed for its outlook to improve. See the latest FSU analysis for more details and a new annotated graph.
>>> FEATURED STOCK ARTICLE : Found Support at 200-Day Average But Faces Overhead Supply - 11/26/2018 |
View all notes |
Set NEW NOTE alert |
Company Profile |
SEC
News |
Chart |
Request a new note
C
A
S
I |
OLLI
-
NASDAQ
Ollie's Bargain Outlet
Retail-DiscountandVariety
|
$87.11
|
+3.24
3.86% |
$87.20
|
546,219
84.69% of 50 DAV
50 DAV is 645,000
|
$97.61
-10.76%
|
11/16/2018
|
$90.70
|
PP = $97.71
|
|
MB = $102.60
|
Most Recent Note - 11/26/2018 7:10:18 PM
G - Posted a gain today with below average volume. A rebound above the 50 DMA line ($90.43) is needed for its outlook to improve.
>>> FEATURED STOCK ARTICLE : Consolidating Near 50-Day Average Forming New Base - 11/16/2018 |
View all notes |
Set NEW NOTE alert |
Company Profile |
SEC
News |
Chart |
Request a new note
C
A
S
I |
Symbol/Exchange
Company Name
Industry Group |
PRICE |
CHANGE
(%Change) |
Day High |
Volume
(% DAV)
(% 50 day avg vol) |
52 Wk Hi
% From Hi |
Featured
Date |
Price
Featured |
Pivot Featured |
|
Max Buy |
PLNT
-
NYSE
Planet Fitness Inc Cl A
Leisure-Services
|
$54.37
|
+1.47
2.78% |
$54.57
|
874,211
65.78% of 50 DAV
50 DAV is 1,329,000
|
$57.66
-5.71%
|
11/7/2018
|
$57.10
|
PP = $55.45
|
|
MB = $58.22
|
Most Recent Note - 11/26/2018 7:15:51 PM
Y - Posted another gain today with below average volume. Its 50 DMA line ($50.15) and recent low ($48.02 on 11/20/18) define important near-term support to watch on pullbacks. Following a recent breakout it slumped back into the prior base with a damaging loss on 11/12/18 raising concerns.
>>> FEATURED STOCK ARTICLE : Big Gain for New High With Nearly 4 Times Average Volume - 11/7/2018 |
View all notes |
Set NEW NOTE alert |
Company Profile |
SEC
News |
Chart |
Request a new note
C
A
S
I |
INVA
-
NASDAQ
Innoviva Inc
Medical-Biomed/Biotech
|
$17.27
|
-0.71
-3.95% |
$18.36
|
2,218,373
210.87% of 50 DAV
50 DAV is 1,052,000
|
$18.12
-4.69%
|
11/23/2018
|
$17.74
|
PP = $18.09
|
|
MB = $18.99
|
Most Recent Note - 11/26/2018 1:03:12 PM
Y - Hit a new high today but reversed into the red, encountering distributional pressure. Highlighted in yellow with pivot point cited based on its 4/12/18 high plus 10 cents in the prior mid-day report (read here). A gain and strong close above the pivot point backed by at least +40% above average volume may clinch a technical buy signal. However, new buying efforts in all stocks are discouraged under the fact-based investment system until a new confirmed market rally (M criteria) is noted. Earnings increases in quarterly comparisons through Sep '18 have been above the +25% minimum guideline (C criteria). Annual earnings (A criteria) growth has been good after turning a profitable FY '15. See the latest FSU analysis for more details and an annotated graph.
>>> FEATURED STOCK ARTICLE : Bullish Action in Biotech Firm With Strong Earnings History - 11/23/2018 |
View all notes |
Set NEW NOTE alert |
Company Profile |
SEC
News |
Chart |
Request a new note
C
A
S
I |
|
|
|
THESE ARE NOT BUY RECOMMENDATIONS!
Comments contained in the body of this report are technical
opinions only. The material herein has been obtained
from sources believed to be reliable and accurate, however,
its accuracy and completeness cannot be guaranteed.
This site is not an investment advisor, hence it does
not endorse or recommend any securities or other investments.
Any recommendation contained in this report may not
be suitable for all investors and it is not to be deemed
an offer or solicitation on our part with respect to
the purchase or sale of any securities. All trademarks,
service marks and trade names appearing in this report
are the property of their respective owners, and are
likewise used for identification purposes only.
This report is a service available
only to active Paid Premium Members.
You may opt-out of receiving report notifications
at any time. Questions or comments may be submitted
by writing to Premium Membership Services 665 S.E. 10 Street, Suite 201 Deerfield Beach, FL 33441-5634 or by calling 1-800-965-8307
or 954-785-1121.
|
|
|