You are not logged in.
This means you
CAN ONLY VIEW reports that were published prior to Sunday, February 25, 2024.
You
MUST UPGRADE YOUR MEMBERSHIP if you want to see any current reports.
AFTER MARKET UPDATE - MONDAY, NOVEMBER 23RD, 2020
Previous After Market Report Next After Market Report >>>
|
|
|
|
DOW |
+327.79 |
29,591.27 |
+1.12% |
|
Volume |
986,816,416 |
+4% |
|
Volume |
5,317,852,600 |
-1% |
|
NASDAQ |
+24.39 |
11,879.36 |
+0.21% |
|
Advancers |
2,363 |
76% |
|
Advancers |
2,345 |
66% |
|
S&P 500 |
+20.05 |
3,577.59 |
+0.56% |
|
Decliners |
726 |
23% |
|
Decliners |
1,210 |
34% |
|
Russell 2000 |
+32.96 |
1,818.30 |
+1.85% |
|
52 Wk Highs |
202 |
|
|
52 Wk Highs |
292 |
|
|
S&P 600 |
+22.80 |
1,043.03 |
+2.23% |
|
52 Wk Lows |
3 |
|
|
52 Wk Lows |
12 |
|
|
 |
Breadth Positive as Major Indices Rose With More Leadership
Kenneth J. Gruneisen - Passed the CAN SLIM® Master's Exam
The Dow rallied 327 points, while the S&P 500 advanced 0.6%. The Nasdaq Composite reversed early session losses to add 0.2%. Small caps outperformed, with the Russell 2000 jumping 2%. The reported volume totals were mixed, higher than the prior session on the NYSE and lighter on the Nasdaq exchange. Breadth was positive as advancers led decliners by more than a 3-1 margin on the NYSE and by nearly 2-1 on the Nasdaq exchange. There were 69 high-ranked companies from the Leaders List that hit new 52-week highs and were listed on the BreakOuts Page, versus the total of 41 on the prior session. New 52-week highs totals expanded and easily outnumbered new 52-week lows totals. The major indices confirmed a new uptrend (M criteria) with recent follow-through gains backed by higher volume and more leadership. Investors are reminded to always make buying and selling decisions based based on the strict criteria and rules of the fact-based investment system. 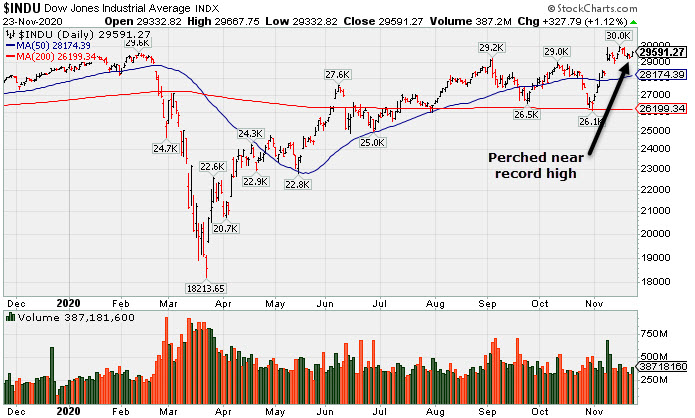 PICTURED: The Dow Jones Industrial Average is perched near its record high.
U.S. equities finished firmly higher on Monday, as investors focused on COVID-19 vaccine optimism. Earlier, AstraZeneca (AZN -1.08%) became the third major pharmaceutical company to report efficacy of 90% or above for its coronavirus vaccine candidate, raising the probability that widespread inoculation could begin as early as December. Equities also extended their gains following news that U.S. President-elect Joe Biden plans to nominate former Fed Chair Janet Yellen to be Treasury Secretary.
Seven of 11 S&P 500 sectors ended in positive territory with stocks that would benefit from reopening activity pacing the gains. Energy stocks jumped 7.1%, with WTI crude hitting its highest level since early September. Industrials also outperformed, with Boeing (BA +6.0%) rising after the European Union said it would lift the jet maker’s grounded 737 MAX planes in January. Information Technology and Communication Services lagged on a relative basis, with the oft-cited FAANG group declining 1.2%.
Economic releases were also in focus, as investors anticipated a jammed packed data calendar before the Thanksgiving holiday on Thursday. Today, a flash reading from research firm IHS Markit showed overall business activity grew at the fastest clip since March 2015 as the pace of expansion in both the manufacturing and services sector unexpectedly improved. Amid the perceived risk-on mood, Treasuries declined, with the yield on the 10-year note adding two basis points to 0.85%. COMEX Gold slipped 2.1% to $1833.40/ounce. |
 Kenneth J. Gruneisen started out as a licensed stockbroker in August 1987, a couple of months prior to the historic stock market crash that took the Dow Jones Industrial Average down -22.6% in a single day. He has published daily fact-based fundamental and technical analysis on high-ranked stocks online for two decades. Through FACTBASEDINVESTING.COM, Kenneth provides educational articles, news, market commentary, and other information regarding proven investment systems that work in good times and bad.
Comments contained in the body of this report are technical opinions only and are not necessarily those of Gruneisen Growth Corp. The material herein has been obtained from sources believed to be reliable and accurate, however, its accuracy and completeness cannot be guaranteed. Our firm, employees, and customers may effect transactions, including transactions contrary to any recommendation herein, or have positions in the securities mentioned herein or options with respect thereto. Any recommendation contained in this report may not be suitable for all investors and it is not to be deemed an offer or solicitation on our part with respect to the purchase or sale of any securities. |
|
 |
Energy-Linked Groups Posted Standout Gains
Kenneth J. Gruneisen - Passed the CAN SLIM® Master's Exam
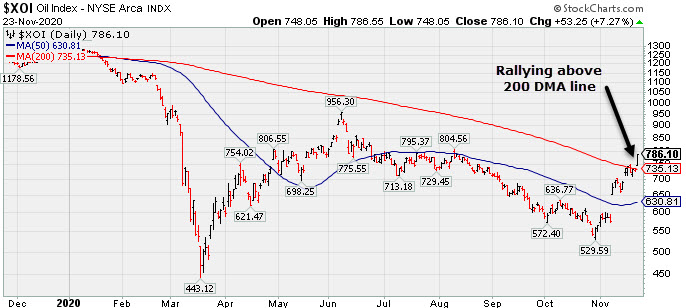
The Bank Index ($BKX +2.25%) and Broker/Dealer Index ($XBD +1.45%) posted influential gains and the Retail Index ($RLX +0.54%) also edged higher. The Networking Index ($NWX +2.16%) and Semiconductor Index ($SOX +1.54%) both led the tech sector while the Biotech Index ($BTK +0.34%) edged higher. The Energy-linked groups posted standout gains as the Oil Services Index ($OSX +9.47%) and Integrated Oil Index ($XOI +7.27%) both rallied considerably for the session. Meanwhile, the Gold & Silver Index ($XAU -3.39%) was a standout decliner
PICTURED: The Integrated Oil Index ($XOI +7.27%) rebounded well above its 200-day moving average (DMA) line with a considerable gain.
| Oil Services |
$OSX |
41.26 |
+3.57 |
+9.47% |
-47.30% |
| Integrated Oil |
$XOI |
786.10 |
+53.25 |
+7.27% |
-38.13% |
| Semiconductor |
$SOX |
2,594.78 |
+39.28 |
+1.54% |
+40.29% |
| Networking |
$NWX |
638.61 |
+13.52 |
+2.16% |
+9.46% |
| Broker/Dealer |
$XBD |
341.72 |
+4.88 |
+1.45% |
+17.68% |
| Retail |
$RLX |
3,426.10 |
+18.56 |
+0.54% |
+39.88% |
| Gold & Silver |
$XAU |
132.55 |
-4.65 |
-3.39% |
+23.97% |
| Bank |
$BKX |
90.26 |
+1.98 |
+2.25% |
-20.37% |
| Biotech |
$BTK |
5,414.20 |
+18.54 |
+0.34% |
+6.84% |
|
|
|
 |
Consolidating Near Important Support Levels
Kenneth J. Gruneisen - Passed the CAN SLIM® Master's Exam
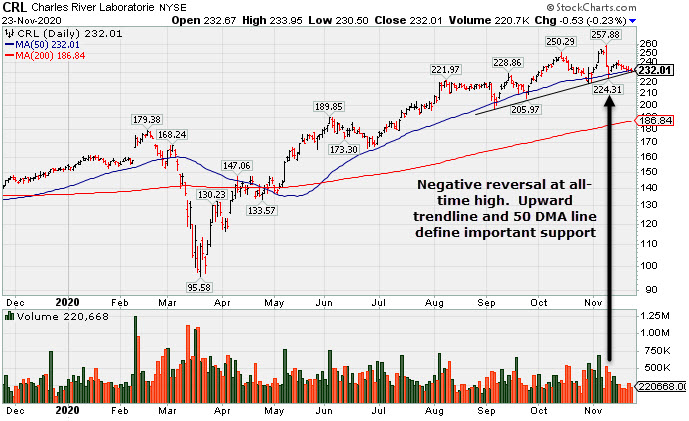
Charles River Labs Intl (CRL -$0.53 or -0.23% to $232.01) has edged lower with volume totals below average behind 6 consecutive losses. There was a noted "negative reversal" at its all-time high on 11/09/20. Near-term support is defined by an upward trendline and its 50-day moving average (DMA) line ($232). More damaging losses would raise greater concerns and may trigger worrisome technical sell signals.
CRL reported Sep '20 quarterly earnings +38% on +11% sales revenues versus the year ago period, above the +25% minimum earnings guideline (C criteria). Fundamental concerns had been raised when it reported Jun '20 quarterly earnings -3% on +4% sales revenues, below the +25% minimum guideline (C criteria), but the results were better than expected and the company also raised its guidance. It now has a 91 Earnings Per Share Rating, down from 96 prior to the report. The 2 prior quarterly earnings increases were above the +25% minimum guideline (C criteria) of the fact-based investment system. Annual earnings (A criteria) history has been strong and steady.
It hails from the Medical - Research Equipment/Services industry group which has an 48 Group Relative Strength Rating (L criteria). The number of top-rated funds owning its shares rose from 681 in Dec '19 to 797 in Sep '20, and its Up/Down Volume Ratio is 0.9 is an unbiased indication its shares have been under slight distributional pressure over the past 50 days. There is a small number of only 49.7 million shares (S criteria) outstanding, which can contribute to greater price volatility in the event of institutional buying or selling.
|
|
|
Color Codes Explained :
Y - Better candidates highlighted by our
staff of experts.
G - Previously featured
in past reports as yellow but may no longer be buyable under the
guidelines.
***Last / Change / Volume data in this table is the closing quote data***
Symbol/Exchange
Company Name
Industry Group |
PRICE |
CHANGE
(%Change) |
Day High |
Volume
(% DAV)
(% 50 day avg vol) |
52 Wk Hi
% From Hi |
Featured
Date |
Price
Featured |
Pivot Featured |
|
Max Buy |
 CRL
-
NYSE
CRL
-
NYSE
Charles River Labs Intl
DRUGS - Biotechnology
|
$232.01
|
-0.53
-0.23% |
$233.95
|
220,668
64.71% of 50 DAV
50 DAV is 341,000
|
$257.88
-10.03%
|
7/15/2020
|
$192.66
|
PP = $189.95
|
|
MB = $199.45
|
 Most Recent Note - 11/23/2020 5:27:32 PM
G - Suffered a 6th consecutive loss today with below average volume. A "negative reversal" was noted at its all-time high on 11/09/20. Support is defined by an upward trendline and its 50 DMA line ($232). More damaging losses would raise greater concerns and may trigger a worrisome technical sell signal. Reported Sep '20 quarterly earnings +38% on +11% sales revenues versus the year ago period, above the +25% minimum earnings guideline (C criteria). See the latest FSU analysis for more details and a new annotated graph.
>>> FEATURED STOCK ARTICLE : Consolidating Near Important Support Levels - 11/23/2020 |
View all notes |
Set NEW NOTE alert |
Company Profile |
SEC
News |
Chart |
Request a new note
C
A
S
I |
AMD
-
NASDAQ
Advanced Micro Devices
ELECTRONICS - Semiconductor - Broad Line
|
$85.31
|
+0.67
0.79% |
$87.54
|
46,067,874
90.21% of 50 DAV
50 DAV is 51,066,000
|
$94.28
-9.51%
|
11/18/2020
|
$82.54
|
PP = $88.72
|
|
MB = $93.16
|
Most Recent Note - 11/18/2020 5:35:54 PM
Y - Color code is changed to yellow with new pivot point cited based on its 10/08/20 high while still building on a "double bottom" base. Volume totals are cooling while consolidating above its 50 DMA line ($80.66). Prior lows in the $73 area define important near term support. Subsequent gains above the pivot point backed by at least +40% above average volume are needed to trigger trigger a technical buy signal.
>>> FEATURED STOCK ARTICLE : Weak Action Raised Concern While Testing Recent Low - 11/3/2020 |
View all notes |
Set NEW NOTE alert |
Company Profile |
SEC
News |
Chart |
Request a new note
C
A
S
I |
TER
-
NASDAQ
Teradyne Inc
ELECTRONICS - Semiconductor Equipment and Mate
|
$108.32
|
+1.99
1.87% |
$108.65
|
1,191,731
54.54% of 50 DAV
50 DAV is 2,185,000
|
$107.24
1.01%
|
10/21/2020
|
$92.22
|
PP = $93.54
|
|
MB = $98.22
|
Most Recent Note - 11/23/2020 5:24:15 PM
G - Posted another gain today with below average volume for new all-time high. Reported earnings +53% on +41% sales revenues for the Sep '20 quarter versus the year ago period, its 4th consecutive quarterly comparison with earnings above the +25% minimum earnings guideline (C criteria). Sequential comparisons show encouraging acceleration in its sales revenues growth rate. Its annual earnings (A criteria) history has been strong.
>>> FEATURED STOCK ARTICLE : Recent Gains for New Highs Lacked Great Volume Conviction - 11/11/2020 |
View all notes |
Set NEW NOTE alert |
Company Profile |
SEC
News |
Chart |
Request a new note
C
A
S
I |
TREX
-
NYSE
Trex Company Inc
MATERIALS and CONSTRUCTION - General Building Materials
|
$76.18
|
+1.46
1.95% |
$77.03
|
523,084
65.30% of 50 DAV
50 DAV is 801,000
|
$81.23
-6.22%
|
6/26/2020
|
$54.53
|
PP = $66.47
|
|
MB = $69.79
|
Most Recent Note - 11/19/2020 12:00:39 PM
G - Rebounding above its 50 DMA line ($72.84) with today's gain backed by light volume. Found support when testing the prior low ($63.32 on 9/21/20). Recently noted that it reported Sep '20 quarterly earnings +14% on +19% sales revenues versus the year ago period, below the +25% minimum guideline (C criteria) raising fundamental concerns.
>>> FEATURED STOCK ARTICLE : Rebound Above 50-Day Moving Average Helped Technical Stance - 11/4/2020 |
View all notes |
Set NEW NOTE alert |
Company Profile |
SEC
News |
Chart |
Request a new note
C
A
S
I |
CLFD
-
NASDAQ
Clearfield Inc
TELECOMMUNICATIONS - Cables / Satalite Equipment
|
$23.34
|
+0.00
0.00% |
$24.00
|
70,642
73.59% of 50 DAV
50 DAV is 96,000
|
$25.97
-10.13%
|
11/17/2020
|
$22.06
|
PP = $26.07
|
|
MB = $27.37
|
Most Recent Note - 11/23/2020 5:25:48 PM
Y - Recently found support at its 50 DMA line ($21.88). More damaging losses would raise concerns. It was highlighted in yellow with pivot point cited based on its 11/09/20 high plus 10 cents in the earlier mid-day report. It has formed an advanced "ascending base" marked by 3 pullbacks of 10-20% after a big breakaway gap on 7/24/20. Subsequent gains above the pivot point marked by +40% above average volume are needed to trigger a proper technical buy signal. Reported earnings +57% on +14% sales revenues for the Sep '20 quarter versus the year ago period, its 3rd consecutive quarterly earnings comparison above the +25% minimum guideline (C criteria). Annual earnings (A criteria) history has improved after a downturn in FY '17.
>>> FEATURED STOCK ARTICLE : Formed Ascending Base Following Earlier Breakway Gap - 11/17/2020 |
View all notes |
Set NEW NOTE alert |
Company Profile |
SEC
News |
Chart |
Request a new note
C
A
S
I |
Symbol/Exchange
Company Name
Industry Group |
PRICE |
CHANGE
(%Change) |
Day High |
Volume
(% DAV)
(% 50 day avg vol) |
52 Wk Hi
% From Hi |
Featured
Date |
Price
Featured |
Pivot Featured |
|
Max Buy |
LGIH
-
NASDAQ
L G I Homes Inc
Bldg-Resident/Comml
|
$113.80
|
+3.74
3.40% |
$115.20
|
284,915
107.92% of 50 DAV
50 DAV is 264,000
|
$132.98
-14.42%
|
10/1/2020
|
$123.17
|
PP = $124.04
|
|
MB = $130.24
|
Most Recent Note - 11/23/2020 5:23:01 PM
G - Posted a big gain today with average volume but remains below its 50 DMA line ($116) which may act as resistance after damaging volume-driven losses. A rebound above the 50 DMA line is needed for its outlook to improve. Reported Sep '20 quarterly earnings +27% on +11% sales revenues versus the year ago period.
>>> FEATURED STOCK ARTICLE : Rebound Toward 50-Day Average Which May Act as Resistance - 11/10/2020 |
View all notes |
Set NEW NOTE alert |
Company Profile |
SEC
News |
Chart |
Request a new note
C
A
S
I |
NOW
-
NYSE
Servicenow Inc
Computer Sftwr-Enterprse
|
$522.11
|
+4.05
0.78% |
$524.87
|
1,286,386
99.49% of 50 DAV
50 DAV is 1,293,000
|
$537.53
-2.87%
|
8/20/2020
|
$453.34
|
PP = $454.79
|
|
MB = $477.53
|
Most Recent Note - 11/23/2020 12:46:27 PM
G - Consolidating above its 50 DMA line ($497) while still hovering near its all-time high. Tested the prior low ($472 on 11/03/20) noted as important support where a damaging violation raises greater concerns. Recently reported Sep '20 quarterly earnings +22% on +30% sales revenues versus the year ago period, below the +25% minimum guideline (C criteria) of the fact-based investment system.
>>> FEATURED STOCK ARTICLE : Found Prompt Support at 50 DMA Line After Earnings News - 10/29/2020 |
View all notes |
Set NEW NOTE alert |
Company Profile |
SEC
News |
Chart |
Request a new note
C
A
S
I |
VEEV
-
NYSE
Veeva Systems Inc Cl A
Computer Sftwr-Medical
|
$272.24
|
-2.01
-0.73% |
$277.70
|
1,159,012
141.52% of 50 DAV
50 DAV is 819,000
|
$313.99
-13.30%
|
10/6/2020
|
$287.71
|
PP = $298.86
|
|
MB = $313.80
|
Most Recent Note - 11/23/2020 1:05:34 PM
G - Faces resistance due to overhead supply up to the $314 area. Damaging volume-driven losses violated its 50 DMA line and briefly undercut the prior low ($263). A rebound above the 50 DMA line ($282) is needed to help its outlook improve.
>>> FEATURED STOCK ARTICLE : Weak Technical Action Raised Recent Concerns - 11/16/2020 |
View all notes |
Set NEW NOTE alert |
Company Profile |
SEC
News |
Chart |
Request a new note
C
A
S
I |
ALRM
-
NASDAQ
Alarm.com Holdings Inc
Security/Sfty
|
$68.23
|
-1.23
-1.77% |
$70.34
|
362,678
104.82% of 50 DAV
50 DAV is 346,000
|
$79.38
-14.05%
|
11/6/2020
|
$71.88
|
PP = $74.76
|
|
MB = $78.50
|
Most Recent Note - 11/18/2020 12:11:32 PM
Y - It stalled after reaching a new all-time high. Previously noted - "Subsequent gains above the pivot point may help clinch a convincing technical buy signal. Reported earnings +32% on +24% sales revenues for the Sep '20 quarter versus the year ago period, an improvement after +3% earnings in the Jun quarter. Prior quarterly comparisons were near or above the +25% minimum earnings guideline (C criteria). Annual earnings (A criteria) growth has been strong, a good match with the fact-based investment system."
>>> FEATURED STOCK ARTICLE : Encountered Distributional Pressure as it Hit a New High - 11/9/2020 |
View all notes |
Set NEW NOTE alert |
Company Profile |
SEC
News |
Chart |
Request a new note
C
A
S
I |
TEAM
-
NASDAQ
Atlassian Corp Plc Cl A
Comp Sftwr-Spec Enterprs
|
$211.05
|
+2.62
1.26% |
$212.06
|
2,872,741
160.85% of 50 DAV
50 DAV is 1,786,000
|
$216.30
-2.43%
|
10/12/2020
|
$193.77
|
PP = $199.60
|
|
MB = $209.58
|
Most Recent Note - 11/19/2020 1:16:56 PM
G - Consolidating above its 50 DMA line ($190) in recent weeks, perched not far off its all-time high. Found prompt support after undercutting the prior low ($180) but it has not formed a sound new base of sufficient length. Reported earnings +7% on +26% sales revenues for the Sep '20 quarter versus the year ago period, well below the +25% minimum earnings guideline (C criteria), raising concerns.
>>> FEATURED STOCK ARTICLE : Weak Technical Action Followed Disappointing Fundamental News - 11/2/2020 |
View all notes |
Set NEW NOTE alert |
Company Profile |
SEC
News |
Chart |
Request a new note
C
A
S
I |
Symbol/Exchange
Company Name
Industry Group |
PRICE |
CHANGE
(%Change) |
Day High |
Volume
(% DAV)
(% 50 day avg vol) |
52 Wk Hi
% From Hi |
Featured
Date |
Price
Featured |
Pivot Featured |
|
Max Buy |
YETI
-
NYSE
Yeti Holdings Inc
Leisure-Products
|
$61.63
|
-0.15
-0.24% |
$63.12
|
1,422,940
110.56% of 50 DAV
50 DAV is 1,287,000
|
$62.72
-1.74%
|
11/5/2020
|
$57.25
|
PP = $55.14
|
|
MB = $57.90
|
Most Recent Note - 11/19/2020 12:08:13 PM
G - Rebounding impressively and its color code is changed to green after rising above its "max buy" level again challenging its all-time high after an abrupt pullback. Its 50 DMA line ($50.72) defines near-term support above prior lows
>>> FEATURED STOCK ARTICLE : Finished Strong After Breakout Gain Was Noted in Mid-Day Report - 11/5/2020 |
View all notes |
Set NEW NOTE alert |
Company Profile |
SEC
News |
Chart |
Request a new note
C
A
S
I |
BJ
-
NYSE
B J S Whlsl Club Hldgs
Retail-DiscountandVariety
|
$43.60
|
+1.60
3.81% |
$43.68
|
3,076,962
135.85% of 50 DAV
50 DAV is 2,265,000
|
$47.46
-8.13%
|
11/19/2020
|
$42.97
|
PP = $47.56
|
|
MB = $49.94
|
Most Recent Note - 11/23/2020 12:23:01 PM
Y - It was highlighted in yellow in the 11/19/20 mid-day report with pivot point cited based on its 8/26/20 high plus 10 cents while consolidating above its 50 DMA line ($40.69). Subsequent volume-driven gains above the pivot point may trigger a technical buy signal. Reported Oct '20 quarterly results +124% on +16% sales revenues versus the year ago period, its 3rd consecutive strong quarterly comparison above the +25% minimum guideline (C criteria), helping it better match with the fundamental guidelines of the fact-based investment system. Annual earnings growth (A criteria) has been strong. Completed its new IPO at $17 on 6/28/19. Has a new CEO as of 2/03/20. See the latest FSU analysis for more details and an annotated graph.
>>> FEATURED STOCK ARTICLE : Rebounding Near High With 3rd Strong Quarterly Report - 11/19/2020 |
View all notes |
Set NEW NOTE alert |
Company Profile |
SEC
News |
Chart |
Request a new note
C
A
S
I |
AAXN
-
NASDAQ
Axon Enterprise Inc
Security/Sfty
|
$126.50
|
+1.69
1.35% |
$127.22
|
402,529
72.14% of 50 DAV
50 DAV is 558,000
|
$128.39
-1.47%
|
11/6/2020
|
$122.75
|
PP = $113.00
|
|
MB = $118.65
|
Most Recent Note - 11/19/2020 4:19:57 PM
G - Posted a gain today with average volume for its 2nd best ever close. Recently reported Sep '20 quarterly earnings +43% on +27% sales revenues versus the year ago period. It broke out of a cup-with-high-handle base with volume drying up during the handle.
>>> FEATURED STOCK ARTICLE : Breakaway Gap From Cup-With-High-Handle Pattern - 11/6/2020 |
View all notes |
Set NEW NOTE alert |
Company Profile |
SEC
News |
Chart |
Request a new note
C
A
S
I |
QTWO
-
NYSE
Q2 Holdings Inc
Computer Sftwr-Financial
|
$115.22
|
+1.79
1.58% |
$116.95
|
362,403
91.52% of 50 DAV
50 DAV is 396,000
|
$112.38
2.53%
|
11/12/2020
|
$105.14
|
PP = $106.54
|
|
MB = $111.87
|
Most Recent Note - 11/19/2020 4:18:29 PM
G - Hit a new all-time high while it rallied above the "max buy" level and its color code is changed to green after today's 4th consecutive gain backed by near average volume. Showed great earning increases with strong underlying sales revenues growth for the Jun and Sep '20 quarters versus the year ago periods. Annual earnings growth has been strong. Completed new Public Offerings on 6/06/19 and 5/13/20.
>>> FEATURED STOCK ARTICLE : Churning Action Near Prior High Indicative of Distributional Pressure - 11/12/2020 |
View all notes |
Set NEW NOTE alert |
Company Profile |
SEC
News |
Chart |
Request a new note
C
A
S
I |
|
|
|
THESE ARE NOT BUY RECOMMENDATIONS!
Comments contained in the body of this report are technical
opinions only. The material herein has been obtained
from sources believed to be reliable and accurate, however,
its accuracy and completeness cannot be guaranteed.
This site is not an investment advisor, hence it does
not endorse or recommend any securities or other investments.
Any recommendation contained in this report may not
be suitable for all investors and it is not to be deemed
an offer or solicitation on our part with respect to
the purchase or sale of any securities. All trademarks,
service marks and trade names appearing in this report
are the property of their respective owners, and are
likewise used for identification purposes only.
This report is a service available
only to active Paid Premium Members.
You may opt-out of receiving report notifications
at any time. Questions or comments may be submitted
by writing to Premium Membership Services 665 S.E. 10 Street, Suite 201 Deerfield Beach, FL 33441-5634 or by calling 1-800-965-8307
or 954-785-1121.
|
|
|