You are not logged in.
This means you
CAN ONLY VIEW reports that were published prior to Tuesday, February 20, 2024.
You
MUST UPGRADE YOUR MEMBERSHIP if you want to see any current reports.
AFTER MARKET UPDATE - FRIDAY, NOVEMBER 23RD, 2018
Previous After Market Report Next After Market Report >>>
|
|
|
|
DOW |
-178.74 |
24,285.95 |
-0.73% |
|
Volume |
440,439,020 |
-43% |
|
Volume |
955,657,702 |
-49% |
|
NASDAQ |
-33.27 |
6,938.98 |
-0.48% |
|
Advancers |
1,301 |
45% |
|
Advancers |
1,594 |
54% |
|
S&P 500 |
-17.37 |
2,632.56 |
-0.66% |
|
Decliners |
1,613 |
55% |
|
Decliners |
1,356 |
46% |
|
Russell 2000 |
+0.40 |
1,488.68 |
+0.03% |
|
52 Wk Highs |
4 |
|
|
52 Wk Highs |
20 |
|
|
S&P 600 |
+0.15 |
937.56 |
+0.02% |
|
52 Wk Lows |
172 |
|
|
52 Wk Lows |
82 |
|
|
 |
Major Indices Slump Again as Leadership Remains Thin
Kenneth J. Gruneisen - Passed the CAN SLIM® Master's Exam
For the week, the S&P 500 declined 3.8%, the Dow lost 4.4%, and the Nasdaq Composite was down 4.3%. Stocks declined on Friday. The Dow was off 178 points to 24285 while the S&P 500 lost 17 points to 2632. The Nasdaq Composite fell 33 points to 6938. The volume totals on the shortened session were lower on the NYSE and on the Nasdaq exchange versus the prior session. Breadth was mixed as decliners led advancers by n 8-7 margin on the NYSE while advancers led decliners by 8-7 on the Nasdaq exchange. There were 4 high-ranked companies from the Leaders List that made new 52-week highs and were listed on the BreakOuts Page, down from the 6 on the prior session. New 52-week lows totals again solidly outnumbered new 52-week highs totals on the NYSE and on the Nasdaq exchange. Technically, the last rally failed and the major indices (M criteria) are again in a correction. The Featured Stocks Page provides the most timely analysis on high-ranked leaders. Strict buying and selling rules should always be followed on a case by case basis. Charts used courtesy of www.stockcharts.com
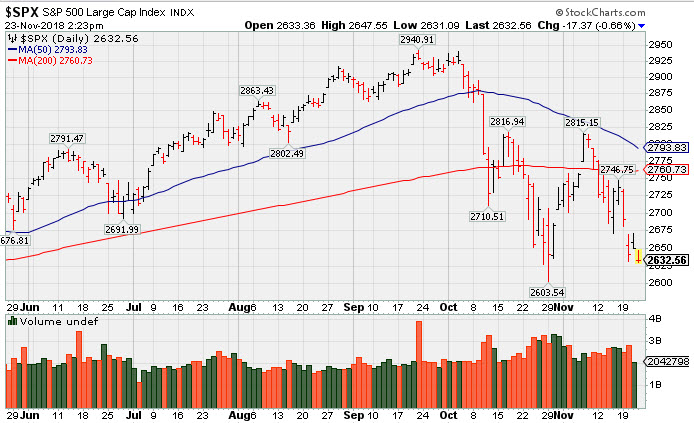
PICTURED: The S&P 500 Index ended -10.5% off its record high. It is sputtering below its 200-day moving average (DMA) line near the October low.
The major averages continued their recent slide as oil prices retreated once again. Energy stocks in the S&P 500 fell 3.3% on the session amid a 6.1% drop for NYMEX WTI crude, which closed at $51.31 to cap a seventh straight weekly decline. Retail sales were also in focus amid the “Black Friday” shopping event. Through 5pm Thanksgiving Day, “top” online retailers saw a 28.6% increase in sales from the same time period last year, per Adobe Analytics.
Eight of 11 S&P 500 sectors finished lower with Utilities, Health Care, and Consumer Staples representing the only positive performers. Tech shares continued their recent slump with Apple (AAPL -2.65%) amid reports the company lowered prices for new iPhones in Japan. In M&A news, shares of Rockwell Collins (COL +8.88%) rose after Chinese regulators gave conditional approval for United Technologies (UTX +2.70%) to purchase the aviation systems company.
On the data front, preliminary readings on both the manufacturing and services sectors showed activity cooled more than anticipated in November. Treasuries strengthened with the yield on the benchmark 10-year note declining one basis point to 3.05%. In commodities, COMEX gold lost 0.4% to $1,223.20/ounce amid a stronger dollar. |
 Kenneth J. Gruneisen started out as a licensed stockbroker in August 1987, a couple of months prior to the historic stock market crash that took the Dow Jones Industrial Average down -22.6% in a single day. He has published daily fact-based fundamental and technical analysis on high-ranked stocks online for two decades. Through FACTBASEDINVESTING.COM, Kenneth provides educational articles, news, market commentary, and other information regarding proven investment systems that work in good times and bad.
Comments contained in the body of this report are technical opinions only and are not necessarily those of Gruneisen Growth Corp. The material herein has been obtained from sources believed to be reliable and accurate, however, its accuracy and completeness cannot be guaranteed. Our firm, employees, and customers may effect transactions, including transactions contrary to any recommendation herein, or have positions in the securities mentioned herein or options with respect thereto. Any recommendation contained in this report may not be suitable for all investors and it is not to be deemed an offer or solicitation on our part with respect to the purchase or sale of any securities. |
|
 |
Commodity-Linked Groups Led Retreat
Kenneth J. Gruneisen - Passed the CAN SLIM® Master's Exam
Commodity-linked groups had a negative bias as the Oil Services Index ($OSX -3.62%), Integrated Oil Index ($XOI -3.70%), and the Gold & Silver Index ($XAU -2.87%) each suffered a big loss. The Retail Index ($RLX -0.57%), Broker/Dealer Index ($XBD -0.33%), and the Bank Index ($BKX -0.57%) each finished modestly lower. The Biotech Index ($BTK +0.72%) rose, meanwhile the Semiconductor Index ($SOX -0.04%) finished flat and the Networking Index ($NWX -0.27%) edged lower.
Charts courtesy of www.stockcharts.com
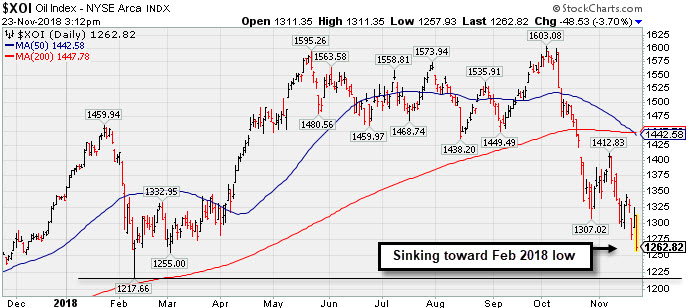 PICTURED: The Integrated Oil Index ($XOI -3.70%) is sputtering below its 50-day and 200-day moving average (DMA) lines, slumping near the February 2018 low.
| Oil Services |
$OSX |
103.81 |
-3.89 |
-3.61% |
-30.59% |
| Integrated Oil |
$XOI |
1,262.82 |
-48.53 |
-3.70% |
-5.45% |
| Semiconductor |
$SOX |
1,179.24 |
-0.49 |
-0.04% |
-5.89% |
| Networking |
$NWX |
500.83 |
-1.37 |
-0.27% |
+2.10% |
| Broker/Dealer |
$XBD |
256.96 |
-0.85 |
-0.33% |
-3.12% |
| Retail |
$RLX |
1,962.44 |
-11.16 |
-0.57% |
+13.19% |
| Gold & Silver |
$XAU |
65.27 |
-1.93 |
-2.87% |
-23.45% |
| Bank |
$BKX |
98.07 |
-0.56 |
-0.57% |
-8.10% |
| Biotech |
$BTK |
4,544.24 |
+32.36 |
+0.72% |
+7.63% |
|
|
|
 |
Bullish Action in Biotech Firm With Strong Earnings History
Kenneth J. Gruneisen - Passed the CAN SLIM® Master's Exam
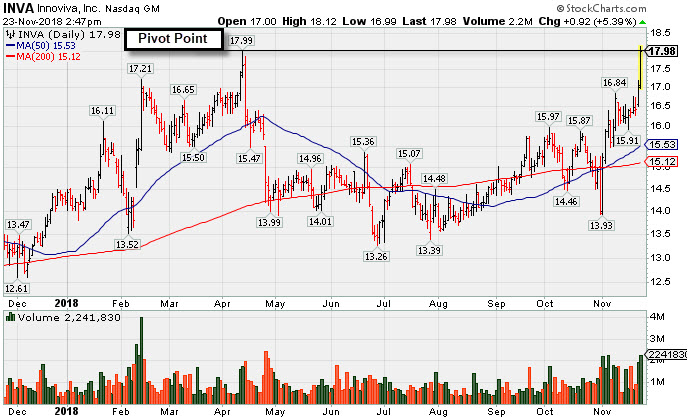
Innoviva Inc (INVA +$0.92 or +5.39% or $17.98) was highlighted in yellow with pivot point cited based on its 4/12/18 high plus 10 cents in the earlier mid-day report (read here). It touched a new 52-week high. A gain above the pivot point backed by at least +40% above average volume may trigger a technical buy signal. However, new buying efforts are discouraged under the fact-based investment system until a new confirmed market rally (M criteria) is noted.
Earnings increases in quarterly comparisons through Sep '18 have been above the +25% minimum guideline (C criteria). Annual earnings (A criteria) growth has been good after turning a profitable FY '15. It has earned a 94 Earnings Per Share Rating, well above the 80+ minimum for buy candidates.
The number of top-rated funds owning its shares rose from 351 in Dec '17 to 382 in Sep '18, a reassuring sign concerning the I criteria. The current Up/Down Volume Ratio of 1.3 is an unbiased indication its shares have been under accumulation over the past 50 days. There are only 66.7 million shares in the public float (S criteria). It has earned an A Timeliness Rating and C Sponsorship Rating.
Charts courtesy of www.stockcharts.com
 |
|
|
Color Codes Explained :
Y - Better candidates highlighted by our
staff of experts.
G - Previously featured
in past reports as yellow but may no longer be buyable under the
guidelines.
***Last / Change / Volume data in this table is the closing quote data***
Symbol/Exchange
Company Name
Industry Group |
PRICE |
CHANGE
(%Change) |
Day High |
Volume
(% DAV)
(% 50 day avg vol) |
52 Wk Hi
% From Hi |
Featured
Date |
Price
Featured |
Pivot Featured |
|
Max Buy |
MPX
-
NYSE
Marine Products Corp
AUTOMOTIVE - Recreational Vehicles
|
$21.30
|
+0.02
0.09% |
$21.50
|
14,180
32.23% of 50 DAV
50 DAV is 44,000
|
$24.82
-14.18%
|
10/24/2018
|
$23.00
|
PP = $24.92
|
|
MB = $26.17
|
Most Recent Note - 11/19/2018 5:14:54 PM
G - Slumped below its 50 DMA line ($22.22) again and its color code is changed to green. Recent low ($20.25 on 10/26/18) defines the next important support. A rebound above the 50 DMA line is needed for its outlook to improve. Subsequent gains above the pivot point backed by at least +40% above average volume may trigger a technical buy signal.
>>> FEATURED STOCK ARTICLE : Perched Within Striking Distance of Pivot Point - 11/13/2018 |
View all notes |
Set NEW NOTE alert |
Company Profile |
SEC
News |
Chart |
Request a new note
C
A
S
I |
GMED
-
NYSE
Globus Medical Inc Cl A
CHEMICALS - Specialty Chemicals
|
$51.47
|
+0.91
1.80% |
$51.71
|
318,858
41.90% of 50 DAV
50 DAV is 761,000
|
$57.83
-11.00%
|
9/26/2018
|
$56.11
|
PP = $57.65
|
|
MB = $60.53
|
Most Recent Note - 11/20/2018 1:08:55 PM
G - The longer it lingers below its 200 DMA line ($51.78) and its 50 DMA line ($53.03) the worse its outlook gets. Remains only -12.4% off its all-time high, but more damaging losses would raise serious concerns.
>>> FEATURED STOCK ARTICLE : Consolidating -5.2% Off 52-Week High Ahead of Earnings News - 11/5/2018 |
View all notes |
Set NEW NOTE alert |
Company Profile |
SEC
News |
Chart |
Request a new note
C
A
S
I |
ZBRA
-
NASDAQ
Zebra Tech Corp Cl A
COMPUTER HARDWARE - Computer Peripherals
|
$165.00
|
+0.66
0.40% |
$167.30
|
80,959
17.15% of 50 DAV
50 DAV is 472,000
|
$184.75
-10.69%
|
11/6/2018
|
$170.41
|
PP = $179.57
|
|
MB = $188.55
|
Most Recent Note - 11/20/2018 5:30:50 PM
G - Loss on higher volume today violated its 50 DMA line ($169.60) and its color code is changed to green. The prior lows and 200 DMA line ($152) define the next important support to watch. Disciplined investors are reminded to always follow strict buy and sell rules.
>>> FEATURED STOCK ARTICLE : Hit New High Following Another Strong Earnings Increase - 11/6/2018 |
View all notes |
Set NEW NOTE alert |
Company Profile |
SEC
News |
Chart |
Request a new note
C
A
S
I |
CME
-
NASDAQ
C M E Group Inc
DIVERSIFIED SERVICES - Business/Management Services
|
$189.31
|
-0.70
-0.37% |
$189.86
|
1,079,676
55.65% of 50 DAV
50 DAV is 1,940,000
|
$197.08
-3.94%
|
10/4/2018
|
$179.29
|
PP = $177.45
|
|
MB = $186.32
|
Most Recent Note - 11/20/2018 1:05:31 PM
G - Pulling back from its all-time high with a loss today, it tallied 16 gains in the prior 17 sessions. Its 50 DMA line ($180) defines near-term support. Strength continued after reporting earnings +22% on +2% sales revenues for the Sep '18 quarter, below the +25% minimum earnings guideline (C criteria), raising fundamental concerns.
>>> FEATURED STOCK ARTICLE : Extended From Base After More Gain With Above Average Volume - 11/15/2018 |
View all notes |
Set NEW NOTE alert |
Company Profile |
SEC
News |
Chart |
Request a new note
C
A
S
I |
GDOT
-
NYSE
Green Dot Corp Cl A
FINANCIAL SERVICES - Credit Services
|
$76.88
|
-0.70
-0.90% |
$78.58
|
156,731
33.21% of 50 DAV
50 DAV is 472,000
|
$93.00
-17.33%
|
11/8/2018
|
$90.35
|
PP = $91.61
|
|
MB = $96.19
|
Most Recent Note - 11/20/2018 5:32:49 PM
G - Slumped below its 200 DMA line ($74.50) today. The prior low ($71.50 on 10/29/18) defines important near-term support.
>>> FEATURED STOCK ARTICLE : Volume Heavy Behind Rally to New High - 11/8/2018 |
View all notes |
Set NEW NOTE alert |
Company Profile |
SEC
News |
Chart |
Request a new note
C
A
S
I |
Symbol/Exchange
Company Name
Industry Group |
PRICE |
CHANGE
(%Change) |
Day High |
Volume
(% DAV)
(% 50 day avg vol) |
52 Wk Hi
% From Hi |
Featured
Date |
Price
Featured |
Pivot Featured |
|
Max Buy |
ULTA
-
NASDAQ
Ulta Beauty Inc
SPECIALTY RETAIL - Specialty Retail, Other
|
$303.32
|
-0.44
-0.14% |
$307.38
|
333,832
36.09% of 50 DAV
50 DAV is 925,000
|
$322.49
-5.94%
|
11/8/2018
|
$296.36
|
PP = $290.40
|
|
MB = $304.92
|
Most Recent Note - 11/19/2018 12:44:13 PM
G - Hit another new all-time high today. Prior high ($290) defines initial support to watch above its 50 DMA line ($283).
>>> FEATURED STOCK ARTICLE : Volume Driven Gains Indicate Institutional Buying Demand - 11/9/2018 |
View all notes |
Set NEW NOTE alert |
Company Profile |
SEC
News |
Chart |
Request a new note
C
A
S
I |
UBNT
-
NASDAQ
Ubiquiti Networks Inc
TELECOMMUNICATIONS - Diversified Communication Serv
|
$108.53
|
-0.20
-0.18% |
$109.65
|
151,931
29.11% of 50 DAV
50 DAV is 522,000
|
$112.45
-3.49%
|
11/9/2018
|
$108.20
|
PP = $101.43
|
|
MB = $106.50
|
Most Recent Note - 11/20/2018 1:12:16 PM
G - After intra-day lows today briefly undercut its "max buy" level it is still stubbornly holding its ground near its all-time high. Disciplined investors avoid chasing stocks more than +5% above the pivot point. Prior high ($101.33 on 9/25/18) defines initial support to watch on pullbacks.
>>> FEATURED STOCK ARTICLE : Pullback Following Breakout Gain on After Latest Earnings Report - 11/12/2018 |
View all notes |
Set NEW NOTE alert |
Company Profile |
SEC
News |
Chart |
Request a new note
C
A
S
I |
FIVE
-
NASDAQ
Five Below Inc
Retail-DiscountandVariety
|
$102.83
|
-0.16
-0.16% |
$103.89
|
591,482
66.68% of 50 DAV
50 DAV is 887,000
|
$136.13
-24.46%
|
7/6/2018
|
$98.90
|
PP = $104.09
|
|
MB = $109.29
|
Most Recent Note - 11/20/2018 1:00:06 PM
G - Gapped down today and undercut the prior low ($108.76 on 10/26/18) triggering a technical sell signal amid broader market weakness (M criteria). A rebound above the 50 DMA line ($120.47) is needed for its outlook to improve.
>>> FEATURED STOCK ARTICLE : Consolidating Near 50-Day Moving Average After Finding Support - 11/14/2018 |
View all notes |
Set NEW NOTE alert |
Company Profile |
SEC
News |
Chart |
Request a new note
C
A
S
I |
HQY
-
NASDAQ
Healthequity Inc
COMPUTER SOFTWARE and SERVICES - Healthcare Information Service
|
$77.38
|
+0.70
0.91% |
$79.33
|
526,931
56.97% of 50 DAV
50 DAV is 925,000
|
$101.58
-23.82%
|
11/2/2018
|
$95.56
|
PP = $100.09
|
|
MB = $105.09
|
Most Recent Note - 11/20/2018 5:28:16 PM
G - Sputtering near its 200 DMA line ($76.81) after a loss on the prior session violated the prior low ($80.56 on 10/24/18) triggering a technical sell signal. A rebound above the 50 DMA line ($89.59) is needed for its outlook to improve. See the latest FSU analysis for more details and a new annotated graph.
>>> FEATURED STOCK ARTICLE : Rebound Above 50-Day Average Helped Outlook Improve - 11/1/2018 |
View all notes |
Set NEW NOTE alert |
Company Profile |
SEC
News |
Chart |
Request a new note
C
A
S
I |
OLLI
-
NASDAQ
Ollie's Bargain Outlet
Retail-DiscountandVariety
|
$83.87
|
+0.20
0.24% |
$84.13
|
195,239
29.99% of 50 DAV
50 DAV is 651,000
|
$97.61
-14.08%
|
11/16/2018
|
$90.70
|
PP = $97.71
|
|
MB = $102.60
|
Most Recent Note - 11/20/2018 12:40:32 PM
G - Color code is changed to green after a gap down today and losses undercutting the prior low ($84.66 on 10/11/18) triggering a technical sell signal. A rebound above the 50 DMA line ($90.79) is needed for its outlook to improve.
>>> FEATURED STOCK ARTICLE : Consolidating Near 50-Day Average Forming New Base - 11/16/2018 |
View all notes |
Set NEW NOTE alert |
Company Profile |
SEC
News |
Chart |
Request a new note
C
A
S
I |
Symbol/Exchange
Company Name
Industry Group |
PRICE |
CHANGE
(%Change) |
Day High |
Volume
(% DAV)
(% 50 day avg vol) |
52 Wk Hi
% From Hi |
Featured
Date |
Price
Featured |
Pivot Featured |
|
Max Buy |
PLNT
-
NYSE
Planet Fitness Inc Cl A
Leisure-Services
|
$52.90
|
+0.55
1.05% |
$53.49
|
355,356
26.66% of 50 DAV
50 DAV is 1,333,000
|
$57.66
-8.26%
|
11/7/2018
|
$57.10
|
PP = $55.45
|
|
MB = $58.22
|
Most Recent Note - 11/19/2018 5:20:41 PM
Y - Suffered a big loss on higher (near average) volume today. Its 50 DMA line ($50.01) defines important support. Following a recent breakout it slumped back into the prior base with a damaging loss on 11/12/18 raising concerns.
>>> FEATURED STOCK ARTICLE : Big Gain for New High With Nearly 4 Times Average Volume - 11/7/2018 |
View all notes |
Set NEW NOTE alert |
Company Profile |
SEC
News |
Chart |
Request a new note
C
A
S
I |
INVA
-
NASDAQ
Innoviva Inc
Medical-Biomed/Biotech
|
$17.98
|
+0.92
5.39% |
$18.12
|
2,241,481
220.84% of 50 DAV
50 DAV is 1,015,000
|
$17.99
-0.06%
|
11/23/2018
|
$17.74
|
PP = $18.09
|
|
MB = $18.99
|
 Most Recent Note - 11/23/2018 3:10:32 PM
Y - Color code was changed to yellow with pivot point cited based on its 4/12/18 high plus 10 cents. Touched a new 52-week high today. A gain above the pivot point backed by at least +40% above average volume may trigger a technical buy signal. However, new buying efforts are discouraged under the fact-based investment system until a new confirmed market rally (M criteria) is noted. Earnings increases in quarterly comparisons through Sep '18 have been above the +25% minimum guideline (C criteria). Annual earnings (A criteria) growth has been good after turning a profitable FY '15. See the latest FSU analysis for more details and a new annotated graph.
>>> FEATURED STOCK ARTICLE : Bullish Action in Biotech Firm With Strong Earnings History - 11/23/2018 |
View all notes |
Set NEW NOTE alert |
Company Profile |
SEC
News |
Chart |
Request a new note
C
A
S
I |
|
|
|
THESE ARE NOT BUY RECOMMENDATIONS!
Comments contained in the body of this report are technical
opinions only. The material herein has been obtained
from sources believed to be reliable and accurate, however,
its accuracy and completeness cannot be guaranteed.
This site is not an investment advisor, hence it does
not endorse or recommend any securities or other investments.
Any recommendation contained in this report may not
be suitable for all investors and it is not to be deemed
an offer or solicitation on our part with respect to
the purchase or sale of any securities. All trademarks,
service marks and trade names appearing in this report
are the property of their respective owners, and are
likewise used for identification purposes only.
This report is a service available
only to active Paid Premium Members.
You may opt-out of receiving report notifications
at any time. Questions or comments may be submitted
by writing to Premium Membership Services 665 S.E. 10 Street, Suite 201 Deerfield Beach, FL 33441-5634 or by calling 1-800-965-8307
or 954-785-1121.
|
|
|

