You are not logged in.
This means you
CAN ONLY VIEW reports that were published prior to Sunday, February 18, 2024.
You
MUST UPGRADE YOUR MEMBERSHIP if you want to see any current reports.
AFTER MARKET UPDATE - FRIDAY, NOVEMBER 22ND, 2019
Previous After Market Report Next After Market Report >>>
|
|
|
|
DOW |
+109.33 |
27,875.62 |
+0.39% |
|
Volume |
717,697,310 |
-13% |
|
Volume |
1,863,253,688 |
-9% |
|
NASDAQ |
+13.67 |
8,519.88 |
+0.16% |
|
Advancers |
1,717 |
60% |
|
Advancers |
1,786 |
58% |
|
S&P 500 |
+6.75 |
3,110.29 |
+0.22% |
|
Decliners |
1,152 |
40% |
|
Decliners |
1,297 |
42% |
|
Russell 2000 |
+4.98 |
1,588.94 |
+0.31% |
|
52 Wk Highs |
59 |
|
|
52 Wk Highs |
67 |
|
|
S&P 600 |
+2.67 |
972.13 |
+0.28% |
|
52 Wk Lows |
36 |
|
|
52 Wk Lows |
81 |
|
|
 |
Major Indices Rose With Breadth Showing a Positive Bias
Kenneth J. Gruneisen - Passed the CAN SLIM® Master's Exam
The Dow added 109 points, while the S&P 500 and Nasdaq Composite both ticked up 0.2%. For the week, the Dow lost 0.5% while the S&P 500 and Nasdaq Composite were each lower by 0.3%. All three major averages recorded their first weekly loss in more than month. Advancers led decliners by a 3-2 margin on the NYSE and on the Nasdaq exchange. Volume totals reported were lighter than the prior session on both major exchanges. There were 25 high-ranked companies from the Leaders List that hit a new 52-week high and were listed on the BreakOuts Page, versus the total of 26 on the prior session. New 52-week highs outnumbered new 52-week lows on the NYSE but new lows outnumbered new highs on the Nasdaq exchange. The major indices (M criteria) are in a "confirmed uptrend" after enduring distributional pressure in recent weeks. The Featured Stocks Page provides the most timely analysis on high-ranked leaders. Charts used courtesy of www.stockcharts.com
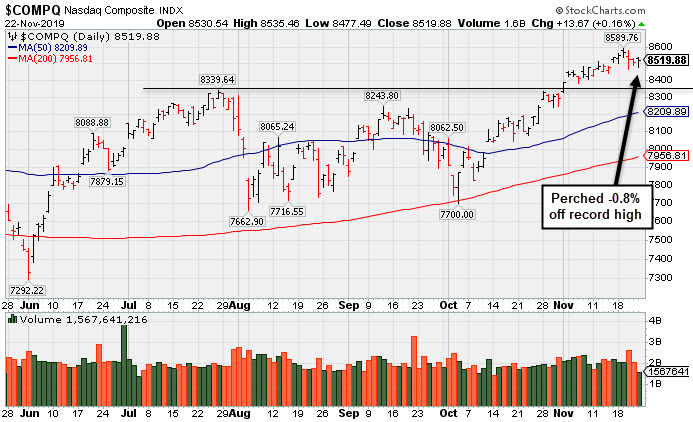
PICTURED: The Nasdaq Composite Index quietly ended the week perched only -0.8% off its record high.
The Stocks finished higher Friday, as investors digested the latest developments on the trade front. The major averages rise was attributed to improved market sentiment after Chinese President Xi said he wants to figure out a way to solidify an initial trade agreement, but stressed the importance of mutual respect and warned of retaliation, if necessary. Furthermore, President Trump noted that a trade deal was “very close.” Concerns still linger, however, as U.S. legislation backing anti-government protestors in Hong Kong could undermine progress of a trade pact.
Seven of 11 S&P 500 sectors closed in positive territory with Financials leading the advance. In earnings, Nordstrom (JWN +10.58%) rallied after the department store easily topped estimates on both the top and bottom line, bucking the downward trend seen earlier in the week by Macy’s (M +5.18%) and Kohl’s (KSS -0.19%). Packaged food company JM Smucker (SJM +4.08%) despite lowering its full-year earnings outlook.
On the data front, flash readings on the U.S. economy from research firm Markit showed manufacturing activity climbed to a seven month high, while the service sector expanded at a faster-than-anticipated pace in November. A final update from the University of Michigan revealed consumer sentiment improved this month. Treasuries ended mixed, with the yield on the benchmark 10-year note unchanged at 1.77%.
|
 Kenneth J. Gruneisen started out as a licensed stockbroker in August 1987, a couple of months prior to the historic stock market crash that took the Dow Jones Industrial Average down -22.6% in a single day. He has published daily fact-based fundamental and technical analysis on high-ranked stocks online for two decades. Through FACTBASEDINVESTING.COM, Kenneth provides educational articles, news, market commentary, and other information regarding proven investment systems that work in good times and bad.
Comments contained in the body of this report are technical opinions only and are not necessarily those of Gruneisen Growth Corp. The material herein has been obtained from sources believed to be reliable and accurate, however, its accuracy and completeness cannot be guaranteed. Our firm, employees, and customers may effect transactions, including transactions contrary to any recommendation herein, or have positions in the securities mentioned herein or options with respect thereto. Any recommendation contained in this report may not be suitable for all investors and it is not to be deemed an offer or solicitation on our part with respect to the purchase or sale of any securities. |
|
 |
Financial, Retail, Biotech, and Oil Services Indexes Rose
Kenneth J. Gruneisen - Passed the CAN SLIM® Master's Exam
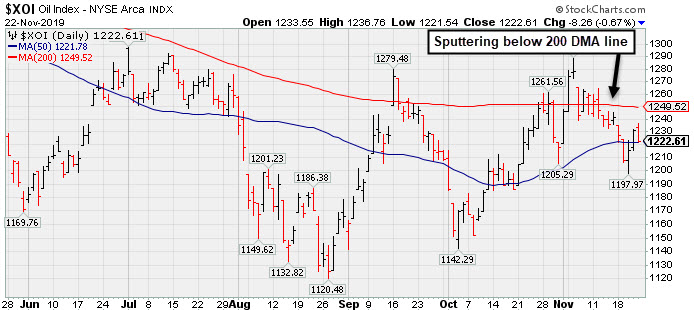
The Broker/Dealer Index ($XBD +0.69%) and the Bank Index ($BKX +0.99%) both outpaced the Retail Index ($RLX +0.41%). The tech sector was quiet as the Biotech Index ($BTK +0.71%) posted a modest gain while the Networking Index ($NWX +0.18%) inched higher and the Semiconductor Index ($SOX +0.00%) finished flat. Commodity-linked ground were mixed, with the Oil Services Index ($OSX +0.45%) edging higher while the Integrated Oil Index ($XOI -0.66%) and the Gold & Silver Index ($XAU -0.20%) each lost a little bit of ground.
PICTURED: The Integrated Oil Index ($XOI -0.66%) is sputtering below its 200 DMA line.
| Oil Services |
$OSX |
67.58 |
+0.30 |
+0.45% |
-16.15% |
| Integrated Oil |
$XOI |
1,222.69 |
-8.18 |
-0.66% |
+5.49% |
| Semiconductor |
$SOX |
1,690.79 |
-0.04 |
-0.00% |
+46.37% |
| Networking |
$NWX |
575.88 |
+1.06 |
+0.18% |
+17.85% |
| Broker/Dealer |
$XBD |
282.87 |
+1.94 |
+0.69% |
+19.18% |
| Retail |
$RLX |
2,360.17 |
+9.56 |
+0.41% |
+20.95% |
| Gold & Silver |
$XAU |
93.66 |
-0.18 |
-0.19% |
+32.55% |
| Bank |
$BKX |
109.26 |
+1.07 |
+0.99% |
+27.36% |
| Biotech |
$BTK |
4,829.87 |
+33.92 |
+0.71% |
+14.43% |
|
|
|
 |
Volume Totals Cooling After Gains for New Highs
Kenneth J. Gruneisen - Passed the CAN SLIM® Master's Exam
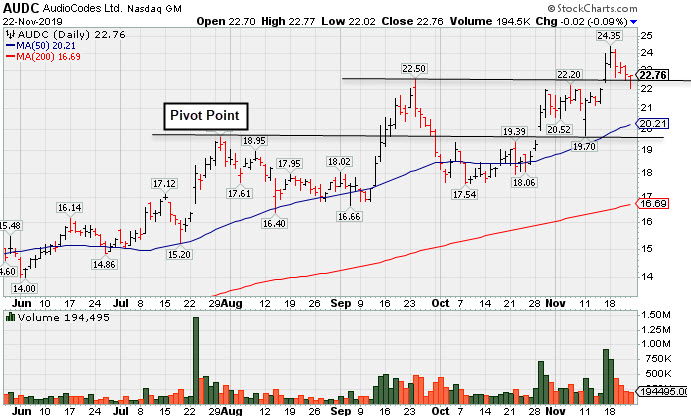
Audiocodes Ltd (AUDC -$0.02 or -0.09% to $22.76) remains perched near its all-time high with volume totals cooling after gains for new highs backed by heavy volume. It had not formed a sound new base of sufficient length, however, no resistance remains due to overhead supply. Its prior highs in the $22 area define initial support to watch above its 50-day moving average (DMA) line ($20.21).
Bullish action came after it reported earnings +26% on +15% sales revenues for the Sep '19 quarter, continuing its strong earnings track record for a 11th consecutive quarterly comparison above the +25% minimum guideline (C criteria). Annual earnings growth has been strong and it has a 99 Earnings Per Share Rating.
This Israel-based designer of advanced voice-over-IP products was last shown in this FSU section on 11/07/19 with an annotated graph under the headline, "Audiocodes is Quietly Perched Near its All-Time High". The number of top-rated funds owning its shares rose from 33 in Mar '18 to 84 in Sep '19, a reassuring sign concerning the I criteria. Its current Up/Down Volume Ratio of 1.4 is an unbiased indication its shares have been under very slight distributional pressure over the past 50 days. It has a Timeliness Rating of A and Sponsorship Rating of B. The small supply of 22.8 million shares (S criteria) in the public float can contribute to greater price volatility in the event of institutional buying or selling.
Charts courtesy of www.stockcharts.com
 |
|
|
Color Codes Explained :
Y - Better candidates highlighted by our
staff of experts.
G - Previously featured
in past reports as yellow but may no longer be buyable under the
guidelines.
***Last / Change / Volume data in this table is the closing quote data***
Symbol/Exchange
Company Name
Industry Group |
PRICE |
CHANGE
(%Change) |
Day High |
Volume
(% DAV)
(% 50 day avg vol) |
52 Wk Hi
% From Hi |
Featured
Date |
Price
Featured |
Pivot Featured |
|
Max Buy |
 MLR
-
NYSE
MLR
-
NYSE
Miller Industries Inc
AUTOMOTIVE - Auto Parts
|
$36.73
|
+0.94
2.63% |
$36.79
|
52,674
119.71% of 50 DAV
50 DAV is 44,000
|
$37.70
-2.57%
|
9/24/2019
|
$34.00
|
PP = $35.36
|
|
MB = $37.13
|
Most Recent Note - 11/21/2019 12:09:10 PM
Y - Prior highs in the $35 area define initial support above its 50 DMA line ($34.06). Showed resilience after recently reporting earnings which were below the fundamental guidelines of the fact-based investment system.
>>> FEATURED STOCK ARTICLE : Showing Resilience After Latest Quarter Missed Minimum Guidelines - 11/15/2019 |
View all notes |
Set NEW NOTE alert |
Company Profile |
SEC
News |
Chart |
Request a new note
C
A
S
I |
CCBG
-
NASDAQ
Capital City Bk Gp
BANKING - Regional - Mid-Atlantic Banks
|
$29.17
|
-0.13
-0.44% |
$29.49
|
35,749
91.66% of 50 DAV
50 DAV is 39,000
|
$30.85
-5.45%
|
9/13/2019
|
$27.03
|
PP = $27.05
|
|
MB = $28.40
|
Most Recent Note - 11/20/2019 12:26:05 PM
G - Consolidating after getting extended from the prior base. Prior highs define important support to watch along with its 50 DMA line ($27.93).
>>> FEATURED STOCK ARTICLE : Consolidating After Volume-Driven Gains for New Highs - 11/19/2019 |
View all notes |
Set NEW NOTE alert |
Company Profile |
SEC
News |
Chart |
Request a new note
C
A
S
I |
FTNT
-
NASDAQ
Fortinet Inc
Computer Sftwr-Security
|
$103.81
|
+0.79
0.77% |
$104.33
|
1,447,677
105.29% of 50 DAV
50 DAV is 1,375,000
|
$106.00
-2.07%
|
11/11/2019
|
$97.14
|
PP = $97.06
|
|
MB = $101.91
|
Most Recent Note - 11/20/2019 5:30:48 PM
G - There was a "negative reversal" after hitting a new all-time high today as it abruptly retreated for a loss with higher volume. Prior highs in the $97 area define initial support to watch on pullbacks.
>>> FEATURED STOCK ARTICLE : Reversed Into Red Today After Touching New High - 11/11/2019 |
View all notes |
Set NEW NOTE alert |
Company Profile |
SEC
News |
Chart |
Request a new note
C
A
S
I |
AUDC
-
NASDAQ
Audiocodes Ltd
ELECTRONICS - Scientific and Technical Instrum
|
$22.76
|
-0.02
-0.09% |
$22.77
|
194,318
65.43% of 50 DAV
50 DAV is 297,000
|
$24.35
-6.53%
|
9/13/2019
|
$19.68
|
PP = $19.84
|
|
MB = $20.83
|
 Most Recent Note - 11/22/2019 5:32:14 PM
G - Volume totals are cooling while hovering near its all-time high following gains marked by heavy volume. Prior highs in the $22 area define initial support above Its 50 DMA line ($20.21). Bullish action came after it reported earnings +26% on +15% sales revenues for the Sep '19 quarter, continuing its strong earnings track record. See the latest FSU analysis for more details and a new annotated graph.
>>> FEATURED STOCK ARTICLE : Volume Totals Cooling After Gains for New Highs - 11/22/2019 |
View all notes |
Set NEW NOTE alert |
Company Profile |
SEC
News |
Chart |
Request a new note
C
A
S
I |
CHDN
-
NASDAQ
Churchill Downs Inc
LEISURE - Gaming Activities
|
$128.53
|
+0.28
0.22% |
$129.28
|
481,270
171.88% of 50 DAV
50 DAV is 280,000
|
$135.32
-5.02%
|
10/8/2019
|
$129.77
|
PP = $132.83
|
|
MB = $139.47
|
Most Recent Note - 11/18/2019 6:26:29 PM
G - Rebounded above its 50 DMA line ($126.87) with today's gain backed by lighter than average volume. Reported Sep '19 earnings +4% on +38% sales revenues versus the year ago period, its 2nd consecutive quarterly comparison below the +25% minimum earnings guideline (C criteria), raising greater fundamental concerns. See the latest FSU analysis for more details and a new annotated graph.
>>> FEATURED STOCK ARTICLE : Resilience Shown Despite Another Sub Par Earnings Report - 11/18/2019 |
View all notes |
Set NEW NOTE alert |
Company Profile |
SEC
News |
Chart |
Request a new note
C
A
S
I |
Symbol/Exchange
Company Name
Industry Group |
PRICE |
CHANGE
(%Change) |
Day High |
Volume
(% DAV)
(% 50 day avg vol) |
52 Wk Hi
% From Hi |
Featured
Date |
Price
Featured |
Pivot Featured |
|
Max Buy |
LULU
-
NASDAQ
Lululemon Athletica
MANUFACTURING - Textile Manufacturing
|
$219.90
|
+3.16
1.46% |
$220.00
|
1,933,951
122.32% of 50 DAV
50 DAV is 1,581,000
|
$219.97
-0.03%
|
9/6/2019
|
$201.25
|
PP = $194.35
|
|
MB = $204.07
|
Most Recent Note - 11/18/2019 6:30:17 PM
G - Hit yet another new all-time high with today's 9th consecutive gain. Found prompt support again near its 50 DMA line ($199.87). The prior low ($191.21 on 11/05/19) defines the next important near-term support.
>>> FEATURED STOCK ARTICLE : Testing 50-Day Moving Average With Loss on Above Average Volume - 11/4/2019 |
View all notes |
Set NEW NOTE alert |
Company Profile |
SEC
News |
Chart |
Request a new note
C
A
S
I |
CPRT
-
NASDAQ
Copart Inc
SPECIALTY RETAIL - Auto Dealerships
|
$89.26
|
+1.41
1.61% |
$89.36
|
2,424,081
154.60% of 50 DAV
50 DAV is 1,568,000
|
$91.73
-2.69%
|
9/5/2019
|
$79.13
|
PP = $79.84
|
|
MB = $83.83
|
Most Recent Note - 11/22/2019 11:57:49 AM
G - Gapped up on the prior session and hit a new all-time high with a volume-driven gain. Reported earnings +38% on +20% sales revenues for the Oct '19 quarter, continuing its strong earnings track record. The 50 DMA line ($82.51) defines near-term support above the prior low ($80.71 on 11/06/19).
>>> FEATURED STOCK ARTICLE : Gapped Up Following Another Strong Earnings Report - 11/21/2019 |
View all notes |
Set NEW NOTE alert |
Company Profile |
SEC
News |
Chart |
Request a new note
C
A
S
I |
NMIH
-
NASDAQ
N M I Holdings Inc Cl A
Finance-MrtgandRel Svc
|
$33.11
|
+0.14
0.42% |
$33.85
|
347,358
78.95% of 50 DAV
50 DAV is 440,000
|
$34.50
-4.03%
|
11/8/2019
|
$32.89
|
PP = $31.44
|
|
MB = $33.01
|
Most Recent Note - 11/19/2019 6:39:31 PM
G - Holding its ground after rising above its "max buy" level with gains backed by above average volume. Reported earnings +54% on +42% sales revenues for the Sep '19 quarter, and prior quarterly comparisons were also well above the +25% minimum guideline (C criteria). After years of losses it had profitable years for FY '16, '17, and '18.
>>> FEATURED STOCK ARTICLE : Hit New High With Volume-Driven Gains - 11/8/2019 |
View all notes |
Set NEW NOTE alert |
Company Profile |
SEC
News |
Chart |
Request a new note
C
A
S
I |
PAYC
-
NYSE
Paycom Software Inc
COMPUTER SOFTWARE and SERVICES - Application Software
|
$263.31
|
+1.85
0.71% |
$263.33
|
611,378
102.24% of 50 DAV
50 DAV is 598,000
|
$263.67
-0.14%
|
11/20/2019
|
$252.97
|
PP = $259.81
|
|
MB = $272.80
|
Most Recent Note - 11/21/2019 12:18:37 PM
Y - Finished strong on the prior session after highlighted in yellow with new pivot point cited based on its 8/29/19 high plus 10 cents. The big gain for a new high triggered a technical buy signal. Found support after undercutting its 200 DMA line since dropped from the Featured Stocks list on 9/12/19. Fundamentals remain strong. It reported earnings +35% on +31% sales revenues for the Sep '19 quarter. See the latest FSU analysis for more details and an annotated graph.
>>> FEATURED STOCK ARTICLE : Powerful Gain for New High Backed by Heavy Volume - 11/20/2019 |
View all notes |
Set NEW NOTE alert |
Company Profile |
SEC
News |
Chart |
Request a new note
C
A
S
I |
BLD
-
NYSE
Topbuild Corp
Bldg-Constr Prds/Misc
|
$109.16
|
-0.53
-0.48% |
$110.61
|
147,955
52.28% of 50 DAV
50 DAV is 283,000
|
$112.41
-2.89%
|
5/17/2019
|
$82.19
|
PP = $87.31
|
|
MB = $91.68
|
Most Recent Note - 11/19/2019 6:29:24 PM
G - Extended from any sound base and consolidating after volume-driven gains for new all-time highs. Reported earnings +24% on +5% sales revenues for the Sep '19 quarter versus the year ago period, just below the +25% minimum guideline (C criteria). Found prompt support near its 50 DMA line ($99.84) during its ongoing ascent.
>>> FEATURED STOCK ARTICLE : Perched Near High Following Recent Volume-Driven Gains - 11/12/2019 |
View all notes |
Set NEW NOTE alert |
Company Profile |
SEC
News |
Chart |
Request a new note
C
A
S
I |
Symbol/Exchange
Company Name
Industry Group |
PRICE |
CHANGE
(%Change) |
Day High |
Volume
(% DAV)
(% 50 day avg vol) |
52 Wk Hi
% From Hi |
Featured
Date |
Price
Featured |
Pivot Featured |
|
Max Buy |
GLOB
-
NYSE
Globant SA
Computer-Tech Services
|
$102.07
|
+2.08
2.08% |
$102.68
|
286,303
115.44% of 50 DAV
50 DAV is 248,000
|
$112.33
-9.13%
|
11/14/2019
|
$106.87
|
PP = $112.43
|
|
MB = $118.05
|
Most Recent Note - 11/20/2019 5:32:33 PM
G - Rebounding following 2 damaging volume-driven losses after recently featured, finding prompt support near its 50 DMA line ($94.92). Reported earnings +35% on +27% sales revenues for the Sep '19 quarter.
>>> FEATURED STOCK ARTICLE : Rallying Near High With 12th Consecutive Gain - 11/14/2019 |
View all notes |
Set NEW NOTE alert |
Company Profile |
SEC
News |
Chart |
Request a new note
C
A
S
I |
|
|
|
THESE ARE NOT BUY RECOMMENDATIONS!
Comments contained in the body of this report are technical
opinions only. The material herein has been obtained
from sources believed to be reliable and accurate, however,
its accuracy and completeness cannot be guaranteed.
This site is not an investment advisor, hence it does
not endorse or recommend any securities or other investments.
Any recommendation contained in this report may not
be suitable for all investors and it is not to be deemed
an offer or solicitation on our part with respect to
the purchase or sale of any securities. All trademarks,
service marks and trade names appearing in this report
are the property of their respective owners, and are
likewise used for identification purposes only.
This report is a service available
only to active Paid Premium Members.
You may opt-out of receiving report notifications
at any time. Questions or comments may be submitted
by writing to Premium Membership Services 665 S.E. 10 Street, Suite 201 Deerfield Beach, FL 33441-5634 or by calling 1-800-965-8307
or 954-785-1121.
|
|
|