You are not logged in.
This means you
CAN ONLY VIEW reports that were published prior to Sunday, February 18, 2024.
You
MUST UPGRADE YOUR MEMBERSHIP if you want to see any current reports.
AFTER MARKET UPDATE - THURSDAY, NOVEMBER 21ST, 2019
Previous After Market Report Next After Market Report >>>
|
|
|
|
DOW |
-54.80 |
27,766.29 |
-0.20% |
|
Volume |
827,822,210 |
-19% |
|
Volume |
2,058,164,180 |
-20% |
|
NASDAQ |
-20.52 |
8,506.21 |
-0.24% |
|
Advancers |
1,127 |
40% |
|
Advancers |
1,322 |
43% |
|
S&P 500 |
-4.92 |
3,103.54 |
-0.16% |
|
Decliners |
1,718 |
60% |
|
Decliners |
1,769 |
57% |
|
Russell 2000 |
-7.65 |
1,583.96 |
-0.48% |
|
52 Wk Highs |
50 |
|
|
52 Wk Highs |
72 |
|
|
S&P 600 |
-4.57 |
969.46 |
-0.47% |
|
52 Wk Lows |
67 |
|
|
52 Wk Lows |
91 |
|
|
 |
Leadership Wanes as Major Indices Edge LOwer
Kenneth J. Gruneisen - Passed the CAN SLIM® Master's Exam
The Dow fell 54 points, while the S&P 500 lost 0.2%, with both benchmark indexes declining for a third straight session. The Nasdaq Composite slipped 0.2%. Decliners led advancers by a 3-2 margin on the NYSE and on the Nasdaq exchange. Volume totals reported were lighter than the prior session on both major exchanges. There were 26 high-ranked companies from the Leaders List that hit a new 52-week high and were listed on the BreakOuts Page, versus the total of 42 on the prior session. New 52-week lows totals outnumbered new 52-week highs totals on the NYSE and on the Nasdaq exchange. The major indices (M criteria) are in a "confirmed uptrend" after enduring distributional pressure in recent weeks. The Featured Stocks Page provides the most timely analysis on high-ranked leaders. Charts used courtesy of www.stockcharts.com
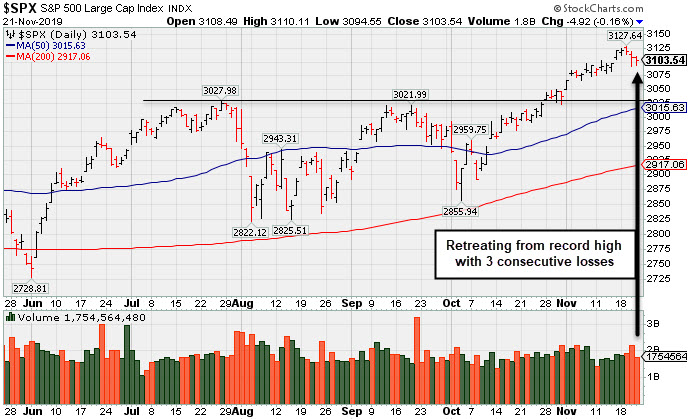
PICTURED: The S&P 500 Index retreated from its record high with 3 consecutive losses.
The major averages extended their recent retreat from their respective all-time highs notched earlier this week, as investors digested the latest developments on the trade front. A report showed Chinese Vice Premier Liu He invited the U.S. to Beijing to further negotiations and said he is “cautiously optimistic” about a phase one deal. Meanwhile, U.S. political intervention tempered investor sentiment after the House passed legislation that supports Hong Kong anti-government protesters.
On the data front, the leading economic index decreased 0.1% in October, in-line with projections. A separate report showed existing home sales rose 1.9% in October, rebounding from the prior month’s downwardly revised 2.5% decline. Treasuries weakened, with the yield on the 10-year note rising four basis points to 1.77%. In commodities, WTI crude jumped 2.5% to $58.43/barrel, near a nine-week high. COMEX gold fell 0.6% to $1,464.80/ounce.
Eight of 11 S&P 500 sectors ended in negative territory with Real Estate group lagging the most. Consumer Discretionary shares also underperformed with Macy’s (M -2.33%) falling after posting its first same store sales decline in two-years and cutting full-year guidance. L Brands (LB +8.06%) bucked the sector’s downward trend after issuing solid third quarter earnings results. In M&A news, TD Ameritrade (AMTD +16.92%) rose following reports that Charles Schwab (SCHW +7.33%) is interested in acquiring the online brokerage firm. PayPal (PYPL -1.48%) fell after announcing an acquisition of privately held Honey Science for $4 billion.
|
 Kenneth J. Gruneisen started out as a licensed stockbroker in August 1987, a couple of months prior to the historic stock market crash that took the Dow Jones Industrial Average down -22.6% in a single day. He has published daily fact-based fundamental and technical analysis on high-ranked stocks online for two decades. Through FACTBASEDINVESTING.COM, Kenneth provides educational articles, news, market commentary, and other information regarding proven investment systems that work in good times and bad.
Comments contained in the body of this report are technical opinions only and are not necessarily those of Gruneisen Growth Corp. The material herein has been obtained from sources believed to be reliable and accurate, however, its accuracy and completeness cannot be guaranteed. Our firm, employees, and customers may effect transactions, including transactions contrary to any recommendation herein, or have positions in the securities mentioned herein or options with respect thereto. Any recommendation contained in this report may not be suitable for all investors and it is not to be deemed an offer or solicitation on our part with respect to the purchase or sale of any securities. |
|
 |
Broker/Dealer, Biotech, and Energy-Linked Groups Rose
Kenneth J. Gruneisen - Passed the CAN SLIM® Master's Exam
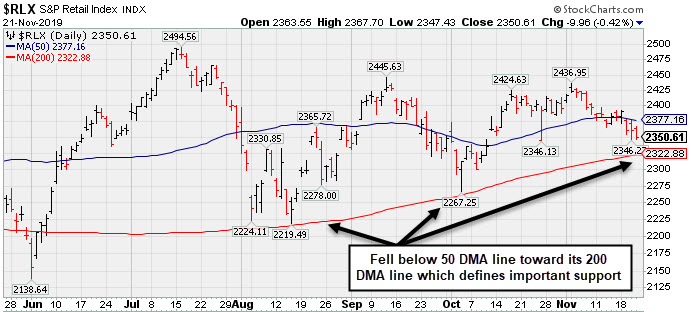
The Broker/Dealer Index ($XBD +0.50%) posted a modest gain and the Bank Index ($BKX +0.08%) held its ground. The tech sector was mixed as the Biotech Index ($BTK +0.41%) posted a modest gain while the Semiconductor Index ($SOX -1.13%) and the Networking Index ($NWX -0.81%) both ended the session lower. Commodity-linked ground were mixed, with energy groups showing a positive bias as the Oil Services Index ($OSX +2.29%) and Integrated Oil Index ($XOI +1.26%) rose, meanwhile, the Gold & Silver Index ($XAU -1.91%) lost ground.
PICTURED: The Retail Index ($RLX -0.42%) is slumping below its 50 DMA line toward its 200 DMA line which defines important support.
| Oil Services |
$OSX |
67.28 |
+1.50 |
+2.28% |
-16.53% |
| Integrated Oil |
$XOI |
1,230.87 |
+15.33 |
+1.26% |
+6.19% |
| Semiconductor |
$SOX |
1,690.83 |
-19.31 |
-1.13% |
+46.37% |
| Networking |
$NWX |
574.82 |
-4.72 |
-0.81% |
+17.63% |
| Broker/Dealer |
$XBD |
280.93 |
+1.40 |
+0.50% |
+18.37% |
| Retail |
$RLX |
2,350.61 |
-9.96 |
-0.42% |
+20.46% |
| Gold & Silver |
$XAU |
93.84 |
-1.83 |
-1.91% |
+32.80% |
| Bank |
$BKX |
108.19 |
+0.08 |
+0.07% |
+26.11% |
| Biotech |
$BTK |
4,795.95 |
+19.69 |
+0.41% |
+13.63% |
|
|
|
 |
Gapped Up Following Another Strong Earnings Report
Kenneth J. Gruneisen - Passed the CAN SLIM® Master's Exam
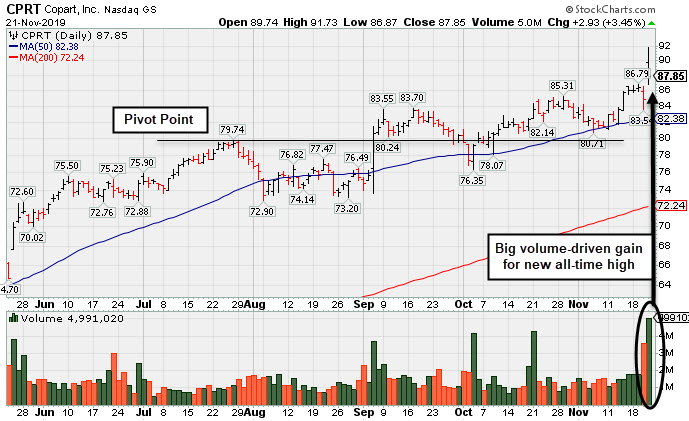
Copart Inc (CPRT +$2.93 or +3.45% to $87.85) gapped up today hitting a new all-time high. It is extended from any sound base. The 50-day moving average (DMA) line ($82.41) defines near-term support above the prior low ($80.71 on 11/06/19).
Bullish action came after it reported earnings +38% on +20% sales revenues for the Oct '19 quarter, continuing its strong earnings track record. The past 3 quarterly earnings increases were above the +25% minimum guideline (C criteria) and its sales revenues growth rate has accelerated. Annual earnings (A criteria) history has been strong and steady since a downturn in FY '13.
CPRT was last shown in this FSU session on 11/06/19 with an annotated graph under the headline, "Testing Support at 50-Day Moving Average". A volume-driven gain above the pivot point on 9/05/19 clinched a technical buy signal when CPRT was highlighted in yellow with pivot point cited based on its 7/26/19 high plus 10 cents (read here).
The number of top-rated funds owning its shares rose from 1,120 in Sep '18 to 1,353 in Sep '19, a reassuring sign concerning the I criteria. It has a Timeliness Rating of A and Sponsorship Rating of B.
|
|
|
Color Codes Explained :
Y - Better candidates highlighted by our
staff of experts.
G - Previously featured
in past reports as yellow but may no longer be buyable under the
guidelines.
***Last / Change / Volume data in this table is the closing quote data***
Symbol/Exchange
Company Name
Industry Group |
PRICE |
CHANGE
(%Change) |
Day High |
Volume
(% DAV)
(% 50 day avg vol) |
52 Wk Hi
% From Hi |
Featured
Date |
Price
Featured |
Pivot Featured |
|
Max Buy |
 MLR
-
NYSE
MLR
-
NYSE
Miller Industries Inc
AUTOMOTIVE - Auto Parts
|
$35.79
|
+0.39
1.10% |
$36.09
|
52,020
118.23% of 50 DAV
50 DAV is 44,000
|
$37.70
-5.07%
|
9/24/2019
|
$34.00
|
PP = $35.36
|
|
MB = $37.13
|
 Most Recent Note - 11/21/2019 12:09:10 PM
Y - Prior highs in the $35 area define initial support above its 50 DMA line ($34.06). Showed resilience after recently reporting earnings which were below the fundamental guidelines of the fact-based investment system.
>>> FEATURED STOCK ARTICLE : Showing Resilience After Latest Quarter Missed Minimum Guidelines - 11/15/2019 |
View all notes |
Set NEW NOTE alert |
Company Profile |
SEC
News |
Chart |
Request a new note
C
A
S
I |
CCBG
-
NASDAQ
Capital City Bk Gp
BANKING - Regional - Mid-Atlantic Banks
|
$29.30
|
-0.16
-0.54% |
$29.62
|
34,851
89.36% of 50 DAV
50 DAV is 39,000
|
$30.85
-5.02%
|
9/13/2019
|
$27.03
|
PP = $27.05
|
|
MB = $28.40
|
Most Recent Note - 11/20/2019 12:26:05 PM
G - Consolidating after getting extended from the prior base. Prior highs define important support to watch along with its 50 DMA line ($27.93).
>>> FEATURED STOCK ARTICLE : Consolidating After Volume-Driven Gains for New Highs - 11/19/2019 |
View all notes |
Set NEW NOTE alert |
Company Profile |
SEC
News |
Chart |
Request a new note
C
A
S
I |
FTNT
-
NASDAQ
Fortinet Inc
Computer Sftwr-Security
|
$103.02
|
+0.57
0.56% |
$103.52
|
1,334,224
96.89% of 50 DAV
50 DAV is 1,377,000
|
$106.00
-2.81%
|
11/11/2019
|
$97.14
|
PP = $97.06
|
|
MB = $101.91
|
Most Recent Note - 11/20/2019 5:30:48 PM
G - There was a "negative reversal" after hitting a new all-time high today as it abruptly retreated for a loss with higher volume. Prior highs in the $97 area define initial support to watch on pullbacks.
>>> FEATURED STOCK ARTICLE : Reversed Into Red Today After Touching New High - 11/11/2019 |
View all notes |
Set NEW NOTE alert |
Company Profile |
SEC
News |
Chart |
Request a new note
C
A
S
I |
AUDC
-
NASDAQ
Audiocodes Ltd
ELECTRONICS - Scientific and Technical Instrum
|
$22.78
|
-0.40
-1.73% |
$23.28
|
215,318
72.25% of 50 DAV
50 DAV is 298,000
|
$24.35
-6.45%
|
9/13/2019
|
$19.68
|
PP = $19.84
|
|
MB = $20.83
|
Most Recent Note - 11/19/2019 1:51:05 PM
G - Retreating from its all-time high today following 3 consecutive gains marked by volume. Its 50 DMA line ($19.94) and recent low ($17.54 on 10/08/19) define important near-term support levels to watch. Bullish action came after it reported earnings +26% on +15% sales revenues for the Sep '19 quarter, continuing its strong earnings track record.
>>> FEATURED STOCK ARTICLE : Audiocodes is Quietly Perched Near its All-Time High - 11/7/2019 |
View all notes |
Set NEW NOTE alert |
Company Profile |
SEC
News |
Chart |
Request a new note
C
A
S
I |
CHDN
-
NASDAQ
Churchill Downs Inc
LEISURE - Gaming Activities
|
$128.25
|
-1.15
-0.89% |
$129.92
|
274,182
98.63% of 50 DAV
50 DAV is 278,000
|
$135.32
-5.22%
|
10/8/2019
|
$129.77
|
PP = $132.83
|
|
MB = $139.47
|
Most Recent Note - 11/18/2019 6:26:29 PM
G - Rebounded above its 50 DMA line ($126.87) with today's gain backed by lighter than average volume. Reported Sep '19 earnings +4% on +38% sales revenues versus the year ago period, its 2nd consecutive quarterly comparison below the +25% minimum earnings guideline (C criteria), raising greater fundamental concerns. See the latest FSU analysis for more details and a new annotated graph.
>>> FEATURED STOCK ARTICLE : Resilience Shown Despite Another Sub Par Earnings Report - 11/18/2019 |
View all notes |
Set NEW NOTE alert |
Company Profile |
SEC
News |
Chart |
Request a new note
C
A
S
I |
Symbol/Exchange
Company Name
Industry Group |
PRICE |
CHANGE
(%Change) |
Day High |
Volume
(% DAV)
(% 50 day avg vol) |
52 Wk Hi
% From Hi |
Featured
Date |
Price
Featured |
Pivot Featured |
|
Max Buy |
LULU
-
NASDAQ
Lululemon Athletica
MANUFACTURING - Textile Manufacturing
|
$216.74
|
-0.30
-0.14% |
$218.90
|
977,589
60.80% of 50 DAV
50 DAV is 1,608,000
|
$219.97
-1.47%
|
9/6/2019
|
$201.25
|
PP = $194.35
|
|
MB = $204.07
|
Most Recent Note - 11/18/2019 6:30:17 PM
G - Hit yet another new all-time high with today's 9th consecutive gain. Found prompt support again near its 50 DMA line ($199.87). The prior low ($191.21 on 11/05/19) defines the next important near-term support.
>>> FEATURED STOCK ARTICLE : Testing 50-Day Moving Average With Loss on Above Average Volume - 11/4/2019 |
View all notes |
Set NEW NOTE alert |
Company Profile |
SEC
News |
Chart |
Request a new note
C
A
S
I |
CPRT
-
NASDAQ
Copart Inc
SPECIALTY RETAIL - Auto Dealerships
|
$87.85
|
+2.93
3.45% |
$91.73
|
4,988,285
332.55% of 50 DAV
50 DAV is 1,500,000
|
$86.79
1.22%
|
9/5/2019
|
$79.13
|
PP = $79.84
|
|
MB = $83.83
|
Most Recent Note - 11/21/2019 5:39:29 PM
G - Gapped up today and hit a new all-time high with a volume-driven gain. Reported earnings +38% on +20% sales revenues for the Oct '19 quarter, continuing its strong earnings track record. The 50 DMA line ($82.38) defines near-term support above the prior low ($80.71 on 11/06/19). See the latest FSU analysis for more details and a new annotated graph.
>>> FEATURED STOCK ARTICLE : Gapped Up Following Another Strong Earnings Report - 11/21/2019 |
View all notes |
Set NEW NOTE alert |
Company Profile |
SEC
News |
Chart |
Request a new note
C
A
S
I |
NMIH
-
NASDAQ
N M I Holdings Inc Cl A
Finance-MrtgandRel Svc
|
$32.97
|
+0.16
0.49% |
$33.04
|
325,087
73.22% of 50 DAV
50 DAV is 444,000
|
$34.50
-4.43%
|
11/8/2019
|
$32.89
|
PP = $31.44
|
|
MB = $33.01
|
Most Recent Note - 11/19/2019 6:39:31 PM
G - Holding its ground after rising above its "max buy" level with gains backed by above average volume. Reported earnings +54% on +42% sales revenues for the Sep '19 quarter, and prior quarterly comparisons were also well above the +25% minimum guideline (C criteria). After years of losses it had profitable years for FY '16, '17, and '18.
>>> FEATURED STOCK ARTICLE : Hit New High With Volume-Driven Gains - 11/8/2019 |
View all notes |
Set NEW NOTE alert |
Company Profile |
SEC
News |
Chart |
Request a new note
C
A
S
I |
PAYC
-
NYSE
Paycom Software Inc
COMPUTER SOFTWARE and SERVICES - Application Software
|
$261.46
|
+0.53
0.20% |
$263.67
|
1,037,720
174.41% of 50 DAV
50 DAV is 595,000
|
$261.51
-0.02%
|
11/20/2019
|
$252.97
|
PP = $259.81
|
|
MB = $272.80
|
Most Recent Note - 11/21/2019 12:18:37 PM
Y - Finished strong on the prior session after highlighted in yellow with new pivot point cited based on its 8/29/19 high plus 10 cents. The big gain for a new high triggered a technical buy signal. Found support after undercutting its 200 DMA line since dropped from the Featured Stocks list on 9/12/19. Fundamentals remain strong. It reported earnings +35% on +31% sales revenues for the Sep '19 quarter. See the latest FSU analysis for more details and an annotated graph.
>>> FEATURED STOCK ARTICLE : Powerful Gain for New High Backed by Heavy Volume - 11/20/2019 |
View all notes |
Set NEW NOTE alert |
Company Profile |
SEC
News |
Chart |
Request a new note
C
A
S
I |
BLD
-
NYSE
Topbuild Corp
Bldg-Constr Prds/Misc
|
$109.69
|
-0.58
-0.53% |
$112.41
|
244,407
85.76% of 50 DAV
50 DAV is 285,000
|
$112.18
-2.22%
|
5/17/2019
|
$82.19
|
PP = $87.31
|
|
MB = $91.68
|
Most Recent Note - 11/19/2019 6:29:24 PM
G - Extended from any sound base and consolidating after volume-driven gains for new all-time highs. Reported earnings +24% on +5% sales revenues for the Sep '19 quarter versus the year ago period, just below the +25% minimum guideline (C criteria). Found prompt support near its 50 DMA line ($99.84) during its ongoing ascent.
>>> FEATURED STOCK ARTICLE : Perched Near High Following Recent Volume-Driven Gains - 11/12/2019 |
View all notes |
Set NEW NOTE alert |
Company Profile |
SEC
News |
Chart |
Request a new note
C
A
S
I |
Symbol/Exchange
Company Name
Industry Group |
PRICE |
CHANGE
(%Change) |
Day High |
Volume
(% DAV)
(% 50 day avg vol) |
52 Wk Hi
% From Hi |
Featured
Date |
Price
Featured |
Pivot Featured |
|
Max Buy |
GLOB
-
NYSE
Globant SA
Computer-Tech Services
|
$99.99
|
+0.43
0.43% |
$100.37
|
587,409
243.74% of 50 DAV
50 DAV is 241,000
|
$112.33
-10.99%
|
11/14/2019
|
$106.87
|
PP = $112.43
|
|
MB = $118.05
|
Most Recent Note - 11/20/2019 5:32:33 PM
G - Rebounding following 2 damaging volume-driven losses after recently featured, finding prompt support near its 50 DMA line ($94.92). Reported earnings +35% on +27% sales revenues for the Sep '19 quarter.
>>> FEATURED STOCK ARTICLE : Rallying Near High With 12th Consecutive Gain - 11/14/2019 |
View all notes |
Set NEW NOTE alert |
Company Profile |
SEC
News |
Chart |
Request a new note
C
A
S
I |
|
|
|
THESE ARE NOT BUY RECOMMENDATIONS!
Comments contained in the body of this report are technical
opinions only. The material herein has been obtained
from sources believed to be reliable and accurate, however,
its accuracy and completeness cannot be guaranteed.
This site is not an investment advisor, hence it does
not endorse or recommend any securities or other investments.
Any recommendation contained in this report may not
be suitable for all investors and it is not to be deemed
an offer or solicitation on our part with respect to
the purchase or sale of any securities. All trademarks,
service marks and trade names appearing in this report
are the property of their respective owners, and are
likewise used for identification purposes only.
This report is a service available
only to active Paid Premium Members.
You may opt-out of receiving report notifications
at any time. Questions or comments may be submitted
by writing to Premium Membership Services 665 S.E. 10 Street, Suite 201 Deerfield Beach, FL 33441-5634 or by calling 1-800-965-8307
or 954-785-1121.
|
|
|