You are not logged in.
This means you
CAN ONLY VIEW reports that were published prior to Monday, February 19, 2024.
You
MUST UPGRADE YOUR MEMBERSHIP if you want to see any current reports.
AFTER MARKET UPDATE - WEDNESDAY, NOVEMBER 21ST, 2018
Previous After Market Report Next After Market Report >>>
|
|
|
|
DOW |
-0.95 |
24,464.69 |
-0.00% |
|
Volume |
776,878,580 |
-22% |
|
Volume |
1,857,043,036 |
-30% |
|
NASDAQ |
+63.43 |
6,972.25 |
+0.92% |
|
Advancers |
2,202 |
74% |
|
Advancers |
2,266 |
74% |
|
S&P 500 |
+8.04 |
2,649.93 |
+0.30% |
|
Decliners |
777 |
26% |
|
Decliners |
786 |
26% |
|
Russell 2000 |
+19.27 |
1,488.28 |
+1.31% |
|
52 Wk Highs |
17 |
|
|
52 Wk Highs |
10 |
|
|
S&P 600 |
+9.08 |
937.41 |
+0.98% |
|
52 Wk Lows |
151 |
|
|
52 Wk Lows |
112 |
|
|
 |
Breadth Positive as Major Indices Rose on Lighter Volume
Kenneth J. Gruneisen - Passed the CAN SLIM® Master's Exam
Stocks finished mostly higher Wednesday. The S&P 500 gained 8 points to 2649 while the Nasdaq Composite climbed 63 points to 6972. The Dow was down less than a point to finish at 24464. The volume totals reported were lighter on the NYSE and on the Nasdaq exchange versus the prior session. Breadth was positive as advancers led decliners by 3-1 on the NYSE and on the Nasdaq exchange. There were 5 high-ranked companies from the Leaders List that made new 52-week highs and were listed on the BreakOuts Page, versus 6 on the prior session. New 52-week lows totals solidly outnumbered new 52-week highs totals on the NYSE and on the Nasdaq exchange. Technically, the last rally failed and the major indices (M criteria) are again in a correction. The Featured Stocks Page provides the most timely analysis on high-ranked leaders. Strict buying and selling rules should always be followed on a case by case basis. Charts used courtesy of www.stockcharts.com
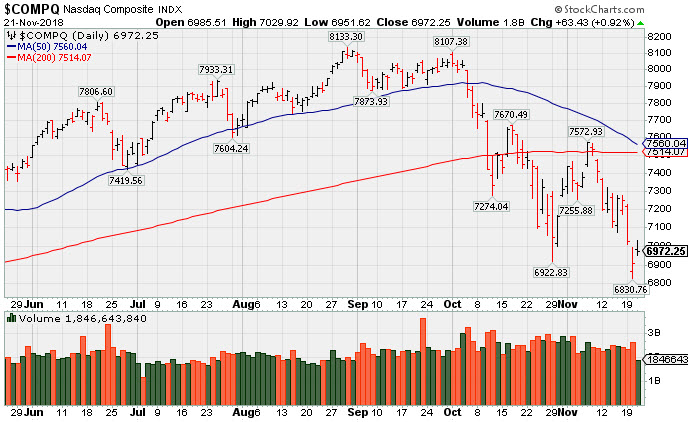
PICTURED: The Nasdaq Composite Index posted a gain with light volume. It is well below its 200-day moving average (DMA) line.
The S&P 500 and Nasdaq Composite posted solid gains as Tech stocks rebounded from recent weakness. On the data front, a report showed existing home sales rose 1.4% in October after slipping to the lowest level in three years in September. An additional survey revealed durable goods orders fell 4.4% in October, worse than the anticipated 2.6% decline. Separately, initial jobless claims came in at 224,000 in the most recent week, while the University of Michigan’s survey showed consumer sentiment eased more than expected in November.
Energy stocks boosted the major averages as WTI crude jumped 1.8% to $54.40/barrel. Meanwhile, Retailers recovered from recent weakness as Foot Locker (FL +14.9%) rose after topping analyst profit estimates. Technology stocks also outperformed as Microsoft (MSFT +1.4%) and IBM (IBM +1.2%) rose. The Consumer Staples and Healthcare sectors lagged the broader market advance as Philip Morris (PMI -3.0%) and Johnson & Johnson (JNJ -3.1%) fell. Shares of Deere (DE +2.4%) rose after offering better-than-expected forward guidance.
Treasuries were weaker along the curve as the yield on the 10-year note climbed one basis point to 3.06%. In commodities, COMEX gold added 0.4% to $1,226.50/ounce amid a weaker dollar. |
 Kenneth J. Gruneisen started out as a licensed stockbroker in August 1987, a couple of months prior to the historic stock market crash that took the Dow Jones Industrial Average down -22.6% in a single day. He has published daily fact-based fundamental and technical analysis on high-ranked stocks online for two decades. Through FACTBASEDINVESTING.COM, Kenneth provides educational articles, news, market commentary, and other information regarding proven investment systems that work in good times and bad.
Comments contained in the body of this report are technical opinions only and are not necessarily those of Gruneisen Growth Corp. The material herein has been obtained from sources believed to be reliable and accurate, however, its accuracy and completeness cannot be guaranteed. Our firm, employees, and customers may effect transactions, including transactions contrary to any recommendation herein, or have positions in the securities mentioned herein or options with respect thereto. Any recommendation contained in this report may not be suitable for all investors and it is not to be deemed an offer or solicitation on our part with respect to the purchase or sale of any securities. |
|
 |
Tech, Retail, Broker/Dealer, and Commodity-Linked Indexes Rose
Kenneth J. Gruneisen - Passed the CAN SLIM® Master's Exam
The Retail Index ($RLX +1.09%) and Broker/Dealer Index ($XBD +1.09%) rose while the Bank Index ($BKX 0%) finished flat. The Semiconductor Index ($SOX +0.42%), Biotech Index ($BTK +0.79%), and the Networking Index ($NWX +1.03%) posted unanimous gains. Commodity-linked groups led the gainers as the Oil Services Index ($OSX +2.18%), Integrated Oil Index ($XOI +2.21%), and the Gold & Silver Index ($XAU +3.12%) each posted solid gains.
Charts courtesy of www.stockcharts.com
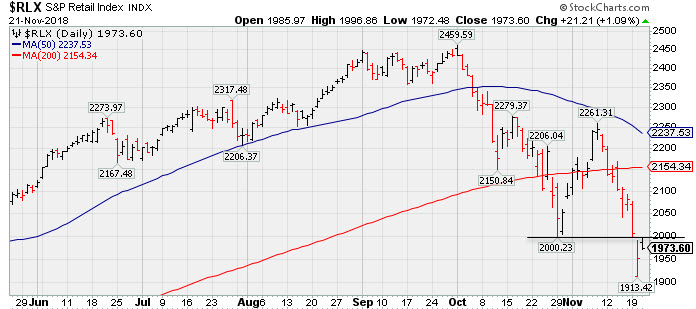 PICTURED: The Retail Index ($RLX +1.09%) is sputtering below its 50-day and 200-day moving average (DMA) lines after recently slumping below the October low.
| Oil Services |
$OSX |
107.70 |
+2.29 |
+2.17% |
-27.98% |
| Integrated Oil |
$XOI |
1,311.35 |
+28.41 |
+2.21% |
-1.81% |
| Semiconductor |
$SOX |
1,179.73 |
+4.91 |
+0.42% |
-5.85% |
| Networking |
$NWX |
502.20 |
+5.10 |
+1.03% |
+2.38% |
| Broker/Dealer |
$XBD |
257.81 |
+2.79 |
+1.09% |
-2.80% |
| Retail |
$RLX |
1,973.60 |
+21.21 |
+1.09% |
+13.83% |
| Gold & Silver |
$XAU |
67.20 |
+2.03 |
+3.11% |
-21.19% |
| Bank |
$BKX |
98.63 |
+0.00 |
+0.00% |
-7.57% |
| Biotech |
$BTK |
4,511.88 |
+35.16 |
+0.79% |
+6.86% |
|
|
|
 |
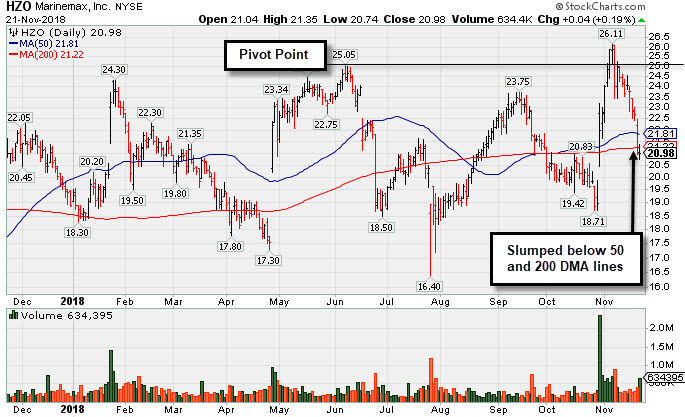
Negated Recent Breakout and Slumped Below 200 Day Average
Kenneth J. Gruneisen - Passed the CAN SLIM® Master's Exam
Marinemax Inc (HZO +$0.04 or +0.19% to $20.98) has slumped below its 50-day and 200-day moving average (DMA) lines raising concerns. Disciplined investors always limit losses by selling any stock that falls more than -7% from their purchase price. It will be dropped from the Featured Stocks list tonight. A rebound above the 50 DMA line is needed for its outlook to improve.
HZO was highlighted in yellow with pivot point cited based on its 6/07/18 high plus 10 cents in the 11/02/18 mid-day report (read here) and shown that evening with an annotated graph under the headline, "Boat Retailer Has Strong Earnings History".
Recently it reported Sep '18 earnings +105% on +23% sales revenues, its 4th consecutive quarter with a big earnings increase more than the +25% minimum (C criteria) versus the year ago period. Sales revenues growth has shown encouraging acceleration in sequential quarterly comparisons versus the year ago periods. Its annual earnings (A criteria) history has been strong and steady.
The number of top-rated funds owning its shares rose from 250 in Dec '17 to 280 in Sep '18, a reassuring sign concerning the I criteria. The current Up/Down Volume Ratio of 1.0 is an unbiased indication its shares have been neutral concerning accumulation/distribution over the past 50 days. Its Timeliness Rating is A and Sponsorship Rating is B.
|
|
|
Color Codes Explained :
Y - Better candidates highlighted by our
staff of experts.
G - Previously featured
in past reports as yellow but may no longer be buyable under the
guidelines.
***Last / Change / Volume data in this table is the closing quote data***
Symbol/Exchange
Company Name
Industry Group |
PRICE |
CHANGE
(%Change) |
Day High |
Volume
(% DAV)
(% 50 day avg vol) |
52 Wk Hi
% From Hi |
Featured
Date |
Price
Featured |
Pivot Featured |
|
Max Buy |
MPX
-
NYSE
Marine Products Corp
AUTOMOTIVE - Recreational Vehicles
|
$21.28
|
+0.41
1.96% |
$21.62
|
19,740
43.87% of 50 DAV
50 DAV is 45,000
|
$24.82
-14.26%
|
10/24/2018
|
$23.00
|
PP = $24.92
|
|
MB = $26.17
|
Most Recent Note - 11/19/2018 5:14:54 PM
G - Slumped below its 50 DMA line ($22.22) again and its color code is changed to green. Recent low ($20.25 on 10/26/18) defines the next important support. A rebound above the 50 DMA line is needed for its outlook to improve. Subsequent gains above the pivot point backed by at least +40% above average volume may trigger a technical buy signal.
>>> FEATURED STOCK ARTICLE : Perched Within Striking Distance of Pivot Point - 11/13/2018 |
View all notes |
Set NEW NOTE alert |
Company Profile |
SEC
News |
Chart |
Request a new note
C
A
S
I |
GMED
-
NYSE
Globus Medical Inc Cl A
CHEMICALS - Specialty Chemicals
|
$50.56
|
+0.30
0.60% |
$51.08
|
243,457
31.87% of 50 DAV
50 DAV is 764,000
|
$57.83
-12.57%
|
9/26/2018
|
$56.11
|
PP = $57.65
|
|
MB = $60.53
|
Most Recent Note - 11/20/2018 1:08:55 PM
G - The longer it lingers below its 200 DMA line ($51.78) and its 50 DMA line ($53.03) the worse its outlook gets. Remains only -12.4% off its all-time high, but more damaging losses would raise serious concerns.
>>> FEATURED STOCK ARTICLE : Consolidating -5.2% Off 52-Week High Ahead of Earnings News - 11/5/2018 |
View all notes |
Set NEW NOTE alert |
Company Profile |
SEC
News |
Chart |
Request a new note
C
A
S
I |
ZBRA
-
NASDAQ
Zebra Tech Corp Cl A
COMPUTER HARDWARE - Computer Peripherals
|
$164.34
|
+2.05
1.26% |
$167.77
|
328,752
69.80% of 50 DAV
50 DAV is 471,000
|
$184.75
-11.05%
|
11/6/2018
|
$170.41
|
PP = $179.57
|
|
MB = $188.55
|
Most Recent Note - 11/20/2018 5:30:50 PM
G - Loss on higher volume today violated its 50 DMA line ($169.60) and its color code is changed to green. The prior lows and 200 DMA line ($152) define the next important support to watch. Disciplined investors are reminded to always follow strict buy and sell rules.
>>> FEATURED STOCK ARTICLE : Hit New High Following Another Strong Earnings Increase - 11/6/2018 |
View all notes |
Set NEW NOTE alert |
Company Profile |
SEC
News |
Chart |
Request a new note
C
A
S
I |
CME
-
NASDAQ
C M E Group Inc
DIVERSIFIED SERVICES - Business/Management Services
|
$190.01
|
-2.15
-1.12% |
$193.09
|
1,818,098
94.50% of 50 DAV
50 DAV is 1,924,000
|
$197.08
-3.59%
|
10/4/2018
|
$179.29
|
PP = $177.45
|
|
MB = $186.32
|
Most Recent Note - 11/20/2018 1:05:31 PM
G - Pulling back from its all-time high with a loss today, it tallied 16 gains in the prior 17 sessions. Its 50 DMA line ($180) defines near-term support. Strength continued after reporting earnings +22% on +2% sales revenues for the Sep '18 quarter, below the +25% minimum earnings guideline (C criteria), raising fundamental concerns.
>>> FEATURED STOCK ARTICLE : Extended From Base After More Gain With Above Average Volume - 11/15/2018 |
View all notes |
Set NEW NOTE alert |
Company Profile |
SEC
News |
Chart |
Request a new note
C
A
S
I |
GDOT
-
NYSE
Green Dot Corp Cl A
FINANCIAL SERVICES - Credit Services
|
$77.58
|
+3.94
5.35% |
$78.57
|
546,935
116.37% of 50 DAV
50 DAV is 470,000
|
$93.00
-16.58%
|
11/8/2018
|
$90.35
|
PP = $91.61
|
|
MB = $96.19
|
Most Recent Note - 11/20/2018 5:32:49 PM
G - Slumped below its 200 DMA line ($74.50) today. The prior low ($71.50 on 10/29/18) defines important near-term support.
>>> FEATURED STOCK ARTICLE : Volume Heavy Behind Rally to New High - 11/8/2018 |
View all notes |
Set NEW NOTE alert |
Company Profile |
SEC
News |
Chart |
Request a new note
C
A
S
I |
Symbol/Exchange
Company Name
Industry Group |
PRICE |
CHANGE
(%Change) |
Day High |
Volume
(% DAV)
(% 50 day avg vol) |
52 Wk Hi
% From Hi |
Featured
Date |
Price
Featured |
Pivot Featured |
|
Max Buy |
HZO
-
NYSE
Marinemax Inc
SPECIALTY RETAIL - Specialty Retail, Other
|
$20.98
|
+0.04
0.19% |
$21.36
|
634,395
184.90% of 50 DAV
50 DAV is 343,100
|
$26.11
-19.65%
|
11/2/2018
|
$25.10
|
PP = $25.15
|
|
MB = $26.41
|
 Most Recent Note - 11/21/2018 5:35:23 PM
Recently slumped below its 50 and 200 DMA lines raising concerns. A rebound above the 50 DMA line is needed for its outlook to improve. Disciplined investors always limit losses by selling any stock that falls more than -7% from their purchase price. It will be dropped from the Featured Stocks list tonight. See the latest FSU analysis for more details and a new annotated graph.
>>> FEATURED STOCK ARTICLE : Negated Recent Breakout and Slumped Below 200 Day Average - 11/21/2018 |
View all notes |
Set NEW NOTE alert |
Company Profile |
SEC
News |
Chart |
Request a new note
C
A
S
I |
ULTA
-
NASDAQ
Ulta Beauty Inc
SPECIALTY RETAIL - Specialty Retail, Other
|
$303.76
|
+1.62
0.54% |
$305.98
|
545,271
58.07% of 50 DAV
50 DAV is 939,000
|
$322.49
-5.81%
|
11/8/2018
|
$296.36
|
PP = $290.40
|
|
MB = $304.92
|
Most Recent Note - 11/19/2018 12:44:13 PM
G - Hit another new all-time high today. Prior high ($290) defines initial support to watch above its 50 DMA line ($283).
>>> FEATURED STOCK ARTICLE : Volume Driven Gains Indicate Institutional Buying Demand - 11/9/2018 |
View all notes |
Set NEW NOTE alert |
Company Profile |
SEC
News |
Chart |
Request a new note
C
A
S
I |
UBNT
-
NASDAQ
Ubiquiti Networks Inc
TELECOMMUNICATIONS - Diversified Communication Serv
|
$108.73
|
+2.27
2.13% |
$110.30
|
295,412
55.01% of 50 DAV
50 DAV is 537,000
|
$112.45
-3.31%
|
11/9/2018
|
$108.20
|
PP = $101.43
|
|
MB = $106.50
|
Most Recent Note - 11/20/2018 1:12:16 PM
G - After intra-day lows today briefly undercut its "max buy" level it is still stubbornly holding its ground near its all-time high. Disciplined investors avoid chasing stocks more than +5% above the pivot point. Prior high ($101.33 on 9/25/18) defines initial support to watch on pullbacks.
>>> FEATURED STOCK ARTICLE : Pullback Following Breakout Gain on After Latest Earnings Report - 11/12/2018 |
View all notes |
Set NEW NOTE alert |
Company Profile |
SEC
News |
Chart |
Request a new note
C
A
S
I |
FIVE
-
NASDAQ
Five Below Inc
Retail-DiscountandVariety
|
$102.99
|
-0.89
-0.86% |
$106.75
|
866,997
97.09% of 50 DAV
50 DAV is 893,000
|
$136.13
-24.35%
|
7/6/2018
|
$98.90
|
PP = $104.09
|
|
MB = $109.29
|
Most Recent Note - 11/20/2018 1:00:06 PM
G - Gapped down today and undercut the prior low ($108.76 on 10/26/18) triggering a technical sell signal amid broader market weakness (M criteria). A rebound above the 50 DMA line ($120.47) is needed for its outlook to improve.
>>> FEATURED STOCK ARTICLE : Consolidating Near 50-Day Moving Average After Finding Support - 11/14/2018 |
View all notes |
Set NEW NOTE alert |
Company Profile |
SEC
News |
Chart |
Request a new note
C
A
S
I |
HQY
-
NASDAQ
Healthequity Inc
COMPUTER SOFTWARE and SERVICES - Healthcare Information Service
|
$76.68
|
+0.43
0.56% |
$77.85
|
350,604
37.30% of 50 DAV
50 DAV is 940,000
|
$101.58
-24.51%
|
11/2/2018
|
$95.56
|
PP = $100.09
|
|
MB = $105.09
|
Most Recent Note - 11/20/2018 5:28:16 PM
G - Sputtering near its 200 DMA line ($76.81) after a loss on the prior session violated the prior low ($80.56 on 10/24/18) triggering a technical sell signal. A rebound above the 50 DMA line ($89.59) is needed for its outlook to improve. See the latest FSU analysis for more details and a new annotated graph.
>>> FEATURED STOCK ARTICLE : Rebound Above 50-Day Average Helped Outlook Improve - 11/1/2018 |
View all notes |
Set NEW NOTE alert |
Company Profile |
SEC
News |
Chart |
Request a new note
C
A
S
I |
Symbol/Exchange
Company Name
Industry Group |
PRICE |
CHANGE
(%Change) |
Day High |
Volume
(% DAV)
(% 50 day avg vol) |
52 Wk Hi
% From Hi |
Featured
Date |
Price
Featured |
Pivot Featured |
|
Max Buy |
OLLI
-
NASDAQ
Ollie's Bargain Outlet
Retail-DiscountandVariety
|
$83.67
|
+1.21
1.47% |
$84.69
|
503,368
76.62% of 50 DAV
50 DAV is 657,000
|
$97.61
-14.28%
|
11/16/2018
|
$90.70
|
PP = $97.71
|
|
MB = $102.60
|
Most Recent Note - 11/20/2018 12:40:32 PM
G - Color code is changed to green after a gap down today and losses undercutting the prior low ($84.66 on 10/11/18) triggering a technical sell signal. A rebound above the 50 DMA line ($90.79) is needed for its outlook to improve.
>>> FEATURED STOCK ARTICLE : Consolidating Near 50-Day Average Forming New Base - 11/16/2018 |
View all notes |
Set NEW NOTE alert |
Company Profile |
SEC
News |
Chart |
Request a new note
C
A
S
I |
PLNT
-
NYSE
Planet Fitness Inc Cl A
Leisure-Services
|
$52.35
|
+1.44
2.83% |
$52.96
|
750,847
56.50% of 50 DAV
50 DAV is 1,329,000
|
$57.66
-9.21%
|
11/7/2018
|
$57.10
|
PP = $55.45
|
|
MB = $58.22
|
Most Recent Note - 11/19/2018 5:20:41 PM
Y - Suffered a big loss on higher (near average) volume today. Its 50 DMA line ($50.01) defines important support. Following a recent breakout it slumped back into the prior base with a damaging loss on 11/12/18 raising concerns.
>>> FEATURED STOCK ARTICLE : Big Gain for New High With Nearly 4 Times Average Volume - 11/7/2018 |
View all notes |
Set NEW NOTE alert |
Company Profile |
SEC
News |
Chart |
Request a new note
C
A
S
I |
|
|
|
THESE ARE NOT BUY RECOMMENDATIONS!
Comments contained in the body of this report are technical
opinions only. The material herein has been obtained
from sources believed to be reliable and accurate, however,
its accuracy and completeness cannot be guaranteed.
This site is not an investment advisor, hence it does
not endorse or recommend any securities or other investments.
Any recommendation contained in this report may not
be suitable for all investors and it is not to be deemed
an offer or solicitation on our part with respect to
the purchase or sale of any securities. All trademarks,
service marks and trade names appearing in this report
are the property of their respective owners, and are
likewise used for identification purposes only.
This report is a service available
only to active Paid Premium Members.
You may opt-out of receiving report notifications
at any time. Questions or comments may be submitted
by writing to Premium Membership Services 665 S.E. 10 Street, Suite 201 Deerfield Beach, FL 33441-5634 or by calling 1-800-965-8307
or 954-785-1121.
|
|
|