You are not logged in.
This means you
CAN ONLY VIEW reports that were published prior to Sunday, February 18, 2024.
You
MUST UPGRADE YOUR MEMBERSHIP if you want to see any current reports.
AFTER MARKET UPDATE - FRIDAY, NOVEMBER 20TH, 2020
Previous After Market Report Next After Market Report >>>
|
|
|
|
DOW |
-219.75 |
29,263.48 |
-0.75% |
|
Volume |
951,506,586 |
+7% |
|
Volume |
5,355,317,100 |
+2% |
|
NASDAQ |
-49.74 |
11,854.97 |
-0.42% |
|
Advancers |
1,420 |
47% |
|
Advancers |
1,871 |
53% |
|
S&P 500 |
-24.33 |
3,557.54 |
-0.68% |
|
Decliners |
1,602 |
53% |
|
Decliners |
1,670 |
47% |
|
Russell 2000 |
+1.21 |
1,785.34 |
+0.07% |
|
52 Wk Highs |
96 |
|
|
52 Wk Highs |
181 |
|
|
S&P 600 |
-1.60 |
1,020.23 |
-0.16% |
|
52 Wk Lows |
5 |
|
|
52 Wk Lows |
9 |
|
|
 |
Major Indices Showed More Mixed Action
Kenneth J. Gruneisen - Passed the CAN SLIM® Master's Exam
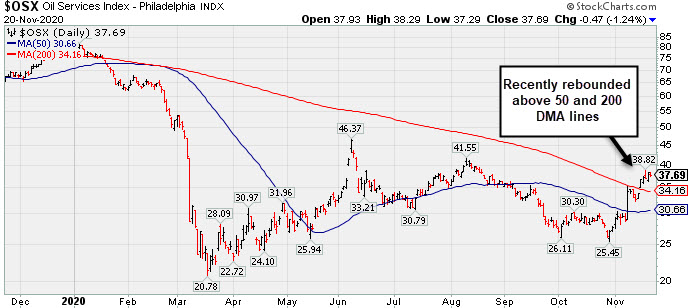
The Dow fell 219 points, while the S&P 500 lost 0.7%. Both benchmarks posted their first weekly decline in three weeks, with the Dow retreating 0.7% and the S&P 500 ticking down 0.8%. The Nasdaq Composite slipped 0.4%, paring its weekly advance to 0.2%. The reported volume totals were higher than the prior session on the NYSE and on the Nasdaq exchange. Breadth was mixed with a slightly negative bias on the NYSE and slightly positive bias on the Nasdaq exchange. There were 41 high-ranked companies from the Leaders List that hit new 52-week highs and were listed on the BreakOuts Page, versus the total of 24 on the prior session. New 52-week highs totals ex[panded and easily outnumbered new 52-week lows totals. The major indices confirmed a new uptrend (M criteria) with recent follow-through gains backed by higher volume and more leadership. Investors are reminded to always make buying and selling decisions based based on the strict criteria and rules of the fact-based investment system. 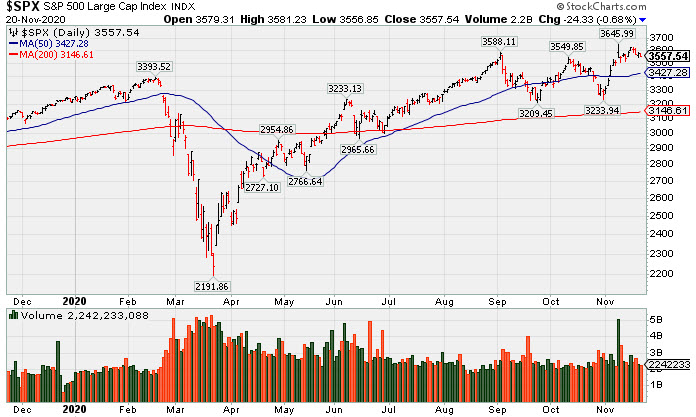 PICTURED: The S&P 500 Index is perched at its record high.
Stocks ended firmly lower on Friday, as investors continued to weigh rising COVID cases against the possibility of a near-term vaccine. Pfizer filed with the FDA for an emergency-use permit for its Covid-19 vaccine, becoming the first company to do so. Meanwhile, the U.S. reported a record number of new infections on Thursday, and logged a tenth-straight day of record-high hospitalizations.
A disagreement between the Treasury Department and the Federal Reserve also garnered attention. Treasury Secretary Steven Mnuchin told the Fed that their lending programs funded by the CARES Act would expire on December 31. The central bank pushed back on the decision, noting the programs served as an important backstop. There were no economic data releases of note on Friday. Treasuries advanced, with the yield on the 10-year note down two basis points to 0.83%. In commodities, WTI crude extended its advance, rising for a third consecutive week.
Ten of 11 S&P 500 sectors finished in negative territory, with the Utilities group narrowly bucking the downtrend. Technology shares underperformed, losing more than 1%. In corporate news, Workday (WDAY -8.8%) fell after beating Wall Street sales projections but issuing tepid forward guidance amid the lingering effects of COVID. Software maker Intuit (INTU -3.6%) fell despite topping on the top and bottom line and providing forward guidance above projections. |
 Kenneth J. Gruneisen started out as a licensed stockbroker in August 1987, a couple of months prior to the historic stock market crash that took the Dow Jones Industrial Average down -22.6% in a single day. He has published daily fact-based fundamental and technical analysis on high-ranked stocks online for two decades. Through FACTBASEDINVESTING.COM, Kenneth provides educational articles, news, market commentary, and other information regarding proven investment systems that work in good times and bad.
Comments contained in the body of this report are technical opinions only and are not necessarily those of Gruneisen Growth Corp. The material herein has been obtained from sources believed to be reliable and accurate, however, its accuracy and completeness cannot be guaranteed. Our firm, employees, and customers may effect transactions, including transactions contrary to any recommendation herein, or have positions in the securities mentioned herein or options with respect thereto. Any recommendation contained in this report may not be suitable for all investors and it is not to be deemed an offer or solicitation on our part with respect to the purchase or sale of any securities. |
|
 |
Financial, Retail, and Energy-Linked Groups Fell
Kenneth J. Gruneisen - Passed the CAN SLIM® Master's Exam
The Bank Index ($BKX -1.41%) created a drag on the major indidceas annd the Broker/Dealer Index ($XBD -0.31%) and Retail Index ($RLX -0.51%) both also edged lower. The Semiconductor Index ($SOX -0.62%) edged lower and the Biotech Index ($BTK -0.16%) finished slightly in the red, meanwhile the Networking Index ($NWX +0.20%) inched higher. The Oil Services Index ($OSX -1.25%) outpaced the Integrated Oil Index ($XOI -0.12%) to the downside while the Gold & Silver Index ($XAU +0.97%) posted a gain.
PICTURED: The Oil Services Index ($OSX -1.25%) recently rebounded above its 50-day and 200-day moving average (DMA) lines.
| Oil Services |
$OSX |
37.69 |
-0.48 |
-1.25% |
-51.86% |
| Integrated Oil |
$XOI |
732.85 |
-0.92 |
-0.12% |
-42.32% |
| Semiconductor |
$SOX |
2,554.30 |
-15.92 |
-0.62% |
+38.10% |
| Networking |
$NWX |
625.09 |
+1.26 |
+0.20% |
+7.14% |
| Broker/Dealer |
$XBD |
336.84 |
-1.04 |
-0.31% |
+16.00% |
| Retail |
$RLX |
3,407.54 |
-17.33 |
-0.51% |
+39.12% |
| Gold & Silver |
$XAU |
137.20 |
+1.32 |
+0.97% |
+28.32% |
| Bank |
$BKX |
88.28 |
-1.26 |
-1.41% |
-22.12% |
| Biotech |
$BTK |
5,395.66 |
-8.73 |
-0.16% |
+6.48% |
|
|
|
 |
Featured Stocks
Kenneth J. Gruneisen - Passed the CAN SLIM® Master's Exam
|
|
|
Color Codes Explained :
Y - Better candidates highlighted by our
staff of experts.
G - Previously featured
in past reports as yellow but may no longer be buyable under the
guidelines.
***Last / Change / Volume data in this table is the closing quote data***
Symbol/Exchange
Company Name
Industry Group |
PRICE |
CHANGE
(%Change) |
Day High |
Volume
(% DAV)
(% 50 day avg vol) |
52 Wk Hi
% From Hi |
Featured
Date |
Price
Featured |
Pivot Featured |
|
Max Buy |
 CRL
-
NYSE
CRL
-
NYSE
Charles River Labs Intl
DRUGS - Biotechnology
|
$232.54
|
-0.92
-0.39% |
$235.74
|
288,038
84.47% of 50 DAV
50 DAV is 341,000
|
$257.88
-9.83%
|
7/15/2020
|
$192.66
|
PP = $189.95
|
|
MB = $199.45
|
Most Recent Note - 11/18/2020 5:38:35 PM
G - After a "negative reversal" at its all-time high on 11/09/20 support is defined by an upward trendline and its 50 DMA line ($231). More damaging losses would raise greater concerns and may trigger a worrisome technical sell signal. Reported Sep '20 quarterly earnings +38% on +11% sales revenues versus the year ago period, above the +25% minimum earnings guideline (C criteria).
>>> FEATURED STOCK ARTICLE : Earnings Due; Consolidating Near Prior High and Above 50 DMA Line - 10/27/2020 |
View all notes |
Set NEW NOTE alert |
Company Profile |
SEC
News |
Chart |
Request a new note
C
A
S
I |
AMD
-
NASDAQ
Advanced Micro Devices
ELECTRONICS - Semiconductor - Broad Line
|
$84.64
|
-0.90
-1.05% |
$86.10
|
35,008,427
68.56% of 50 DAV
50 DAV is 51,066,000
|
$94.28
-10.22%
|
11/18/2020
|
$82.54
|
PP = $88.72
|
|
MB = $93.16
|
Most Recent Note - 11/18/2020 5:35:54 PM
Y - Color code is changed to yellow with new pivot point cited based on its 10/08/20 high while still building on a "double bottom" base. Volume totals are cooling while consolidating above its 50 DMA line ($80.66). Prior lows in the $73 area define important near term support. Subsequent gains above the pivot point backed by at least +40% above average volume are needed to trigger trigger a technical buy signal.
>>> FEATURED STOCK ARTICLE : Weak Action Raised Concern While Testing Recent Low - 11/3/2020 |
View all notes |
Set NEW NOTE alert |
Company Profile |
SEC
News |
Chart |
Request a new note
C
A
S
I |
TER
-
NASDAQ
Teradyne Inc
ELECTRONICS - Semiconductor Equipment and Mate
|
$106.33
|
-0.14
-0.13% |
$107.93
|
1,376,253
62.99% of 50 DAV
50 DAV is 2,185,000
|
$107.24
-0.85%
|
10/21/2020
|
$92.22
|
PP = $93.54
|
|
MB = $98.22
|
Most Recent Note - 11/16/2020 5:45:03 PM
G - Posted a big gain today with below average (but higher) volume for a new all-time high. Reported earnings +53% on +41% sales revenues for the Sep '20 quarter versus the year ago period, its 4th consecutive quarterly comparison with earnings above the +25% minimum earnings guideline (C criteria). Sequential comparisons show encouraging acceleration in its sales revenues growth rate. Its annual earnings (A criteria) history has been strong.
>>> FEATURED STOCK ARTICLE : Recent Gains for New Highs Lacked Great Volume Conviction - 11/11/2020 |
View all notes |
Set NEW NOTE alert |
Company Profile |
SEC
News |
Chart |
Request a new note
C
A
S
I |
TREX
-
NYSE
Trex Company Inc
MATERIALS and CONSTRUCTION - General Building Materials
|
$74.72
|
-0.62
-0.82% |
$75.70
|
561,453
70.09% of 50 DAV
50 DAV is 801,000
|
$81.23
-8.01%
|
6/26/2020
|
$54.53
|
PP = $66.47
|
|
MB = $69.79
|
Most Recent Note - 11/19/2020 12:00:39 PM
G - Rebounding above its 50 DMA line ($72.84) with today's gain backed by light volume. Found support when testing the prior low ($63.32 on 9/21/20). Recently noted that it reported Sep '20 quarterly earnings +14% on +19% sales revenues versus the year ago period, below the +25% minimum guideline (C criteria) raising fundamental concerns.
>>> FEATURED STOCK ARTICLE : Rebound Above 50-Day Moving Average Helped Technical Stance - 11/4/2020 |
View all notes |
Set NEW NOTE alert |
Company Profile |
SEC
News |
Chart |
Request a new note
C
A
S
I |
CLFD
-
NASDAQ
Clearfield Inc
TELECOMMUNICATIONS - Cables / Satalite Equipment
|
$23.34
|
+0.65
2.86% |
$23.50
|
72,120
75.13% of 50 DAV
50 DAV is 96,000
|
$25.97
-10.13%
|
11/17/2020
|
$22.06
|
PP = $26.07
|
|
MB = $27.37
|
Most Recent Note - 11/17/2020 6:23:33 PM
Y - Suffered a volume-driven loss today testing support at its 50 DMA line ($21.74). More damaging losses would raise concerns. It was highlighted in yellow with pivot point cited based on its 11/09/20 high plus 10 cents in the earlier mid-day report. It has formed an advanced "ascending base" marked by 3 pullbacks of 10-20% after a big breakaway gap on 7/24/20. Subsequent gains above the pivot point marked by +40% above average volume are needed to trigger a proper technical buy signal. Reported earnings +57% on +14% sales revenues for the Sep '20 quarter versus the year ago period, its 3rd consecutive quarterly earnings comparison above the +25% minimum guideline (C criteria). Annual earnings (A criteria) history has improved after a downturn in FY '17. See the latest FSU analysis for more details and a new annotated graph.
>>> FEATURED STOCK ARTICLE : Formed Ascending Base Following Earlier Breakway Gap - 11/17/2020 |
View all notes |
Set NEW NOTE alert |
Company Profile |
SEC
News |
Chart |
Request a new note
C
A
S
I |
Symbol/Exchange
Company Name
Industry Group |
PRICE |
CHANGE
(%Change) |
Day High |
Volume
(% DAV)
(% 50 day avg vol) |
52 Wk Hi
% From Hi |
Featured
Date |
Price
Featured |
Pivot Featured |
|
Max Buy |
LGIH
-
NASDAQ
L G I Homes Inc
Bldg-Resident/Comml
|
$110.06
|
-0.15
-0.14% |
$111.23
|
192,291
72.84% of 50 DAV
50 DAV is 264,000
|
$132.98
-17.24%
|
10/1/2020
|
$123.17
|
PP = $124.04
|
|
MB = $130.24
|
Most Recent Note - 11/16/2020 5:43:31 PM
G - Encountered more distributional pressure today while sputtering below its 50 DMA line ($116) which may act as resistance after a damaging volume-driven loss on the prior session. A rebound above the 50 DMA line is needed for its outlook to improve. Reported Sep '20 quarterly earnings +27% on +11% sales revenues versus the year ago period.
>>> FEATURED STOCK ARTICLE : Rebound Toward 50-Day Average Which May Act as Resistance - 11/10/2020 |
View all notes |
Set NEW NOTE alert |
Company Profile |
SEC
News |
Chart |
Request a new note
C
A
S
I |
NOW
-
NYSE
Servicenow Inc
Computer Sftwr-Enterprse
|
$518.06
|
+3.73
0.73% |
$526.46
|
1,184,583
91.62% of 50 DAV
50 DAV is 1,293,000
|
$537.53
-3.62%
|
8/20/2020
|
$453.34
|
PP = $454.79
|
|
MB = $477.53
|
Most Recent Note - 11/17/2020 6:25:03 PM
G - Consolidating above its 50 DMA line ($492) while still hovering near its all-time high. Tested the prior low ($472 on 11/03/20) noted as important support where a damaging violation raises greater concerns. Recently reported Sep '20 quarterly earnings +22% on +30% sales revenues versus the year ago period, below the +25% minimum guideline (C criteria) of the fact-based investment system.
>>> FEATURED STOCK ARTICLE : Found Prompt Support at 50 DMA Line After Earnings News - 10/29/2020 |
View all notes |
Set NEW NOTE alert |
Company Profile |
SEC
News |
Chart |
Request a new note
C
A
S
I |
VEEV
-
NYSE
Veeva Systems Inc Cl A
Computer Sftwr-Medical
|
$274.25
|
+1.68
0.62% |
$276.04
|
555,156
67.78% of 50 DAV
50 DAV is 819,000
|
$313.99
-12.66%
|
10/6/2020
|
$287.71
|
PP = $298.86
|
|
MB = $313.80
|
Most Recent Note - 11/19/2020 1:27:21 PM
G - Rebounding today with lighter volume, and it faces resistance due to overhead supply up to the $314 area. Damaging volume-driven losses violated its 50 DMA line and briefly undercut the prior low ($263). A rebound above the 50 DMA line ($281.80) is needed to help its outlook improve.
>>> FEATURED STOCK ARTICLE : Weak Technical Action Raised Recent Concerns - 11/16/2020 |
View all notes |
Set NEW NOTE alert |
Company Profile |
SEC
News |
Chart |
Request a new note
C
A
S
I |
ALRM
-
NASDAQ
Alarm.com Holdings Inc
Security/Sfty
|
$69.46
|
-1.05
-1.49% |
$70.80
|
424,127
122.58% of 50 DAV
50 DAV is 346,000
|
$79.38
-12.50%
|
11/6/2020
|
$71.88
|
PP = $74.76
|
|
MB = $78.50
|
Most Recent Note - 11/18/2020 12:11:32 PM
Y - It stalled after reaching a new all-time high. Previously noted - "Subsequent gains above the pivot point may help clinch a convincing technical buy signal. Reported earnings +32% on +24% sales revenues for the Sep '20 quarter versus the year ago period, an improvement after +3% earnings in the Jun quarter. Prior quarterly comparisons were near or above the +25% minimum earnings guideline (C criteria). Annual earnings (A criteria) growth has been strong, a good match with the fact-based investment system."
>>> FEATURED STOCK ARTICLE : Encountered Distributional Pressure as it Hit a New High - 11/9/2020 |
View all notes |
Set NEW NOTE alert |
Company Profile |
SEC
News |
Chart |
Request a new note
C
A
S
I |
TEAM
-
NASDAQ
Atlassian Corp Plc Cl A
Comp Sftwr-Spec Enterprs
|
$208.43
|
+8.98
4.50% |
$211.55
|
2,743,306
153.60% of 50 DAV
50 DAV is 1,786,000
|
$216.30
-3.64%
|
10/12/2020
|
$193.77
|
PP = $199.60
|
|
MB = $209.58
|
Most Recent Note - 11/19/2020 1:16:56 PM
G - Consolidating above its 50 DMA line ($190) in recent weeks, perched not far off its all-time high. Found prompt support after undercutting the prior low ($180) but it has not formed a sound new base of sufficient length. Reported earnings +7% on +26% sales revenues for the Sep '20 quarter versus the year ago period, well below the +25% minimum earnings guideline (C criteria), raising concerns.
>>> FEATURED STOCK ARTICLE : Weak Technical Action Followed Disappointing Fundamental News - 11/2/2020 |
View all notes |
Set NEW NOTE alert |
Company Profile |
SEC
News |
Chart |
Request a new note
C
A
S
I |
Symbol/Exchange
Company Name
Industry Group |
PRICE |
CHANGE
(%Change) |
Day High |
Volume
(% DAV)
(% 50 day avg vol) |
52 Wk Hi
% From Hi |
Featured
Date |
Price
Featured |
Pivot Featured |
|
Max Buy |
YETI
-
NYSE
Yeti Holdings Inc
Leisure-Products
|
$61.78
|
+1.55
2.57% |
$61.99
|
1,233,479
95.84% of 50 DAV
50 DAV is 1,287,000
|
$62.72
-1.50%
|
11/5/2020
|
$57.25
|
PP = $55.14
|
|
MB = $57.90
|
Most Recent Note - 11/19/2020 12:08:13 PM
G - Rebounding impressively and its color code is changed to green after rising above its "max buy" level again challenging its all-time high after an abrupt pullback. Its 50 DMA line ($50.72) defines near-term support above prior lows
>>> FEATURED STOCK ARTICLE : Finished Strong After Breakout Gain Was Noted in Mid-Day Report - 11/5/2020 |
View all notes |
Set NEW NOTE alert |
Company Profile |
SEC
News |
Chart |
Request a new note
C
A
S
I |
BJ
-
NYSE
B J S Whlsl Club Hldgs
Retail-DiscountandVariety
|
$42.00
|
-2.55
-5.72% |
$44.68
|
4,490,886
198.27% of 50 DAV
50 DAV is 2,265,000
|
$47.46
-11.50%
|
11/19/2020
|
$42.97
|
PP = $47.56
|
|
MB = $49.94
|
 Most Recent Note - 11/20/2020 12:39:10 PM
Y - Pulling back today. Finished strong on the prior session with a 4th consecutive gain on higher volume. Highlighted in yellow in the 11/19/20 mid-day report with pivot point cited based on its 8/26/20 high plus 10 cents while consolidating above its 50 DMA line ($40.66). Subsequent volume-driven gains above the pivot point may trigger a technical buy signal. Reported Oct '20 quarterly results +124% on +16% sales revenues versus the year ago period, its 3rd consecutive strong quarterly comparison above the +25% minimum guideline (C criteria), helping it better match with the fundamental guidelines of the fact-based investment system. Annual earnings growth (A criteria) has been strong. Completed its new IPO at $17 on 6/28/19. Has a new CEO as of 2/03/20. See the latest FSU analysis for more details and an annotated graph.
>>> FEATURED STOCK ARTICLE : Rebounding Near High With 3rd Strong Quarterly Report - 11/19/2020 |
View all notes |
Set NEW NOTE alert |
Company Profile |
SEC
News |
Chart |
Request a new note
C
A
S
I |
AAXN
-
NASDAQ
Axon Enterprise Inc
Security/Sfty
|
$124.81
|
+1.71
1.39% |
$125.45
|
406,280
72.81% of 50 DAV
50 DAV is 558,000
|
$128.39
-2.79%
|
11/6/2020
|
$122.75
|
PP = $113.00
|
|
MB = $118.65
|
Most Recent Note - 11/19/2020 4:19:57 PM
G - Posted a gain today with average volume for its 2nd best ever close. Recently reported Sep '20 quarterly earnings +43% on +27% sales revenues versus the year ago period. It broke out of a cup-with-high-handle base with volume drying up during the handle.
>>> FEATURED STOCK ARTICLE : Breakaway Gap From Cup-With-High-Handle Pattern - 11/6/2020 |
View all notes |
Set NEW NOTE alert |
Company Profile |
SEC
News |
Chart |
Request a new note
C
A
S
I |
QTWO
-
NYSE
Q2 Holdings Inc
Computer Sftwr-Financial
|
$113.43
|
+1.13
1.01% |
$115.64
|
483,933
122.21% of 50 DAV
50 DAV is 396,000
|
$112.38
0.93%
|
11/12/2020
|
$105.14
|
PP = $106.54
|
|
MB = $111.87
|
Most Recent Note - 11/19/2020 4:18:29 PM
G - Hit a new all-time high while it rallied above the "max buy" level and its color code is changed to green after today's 4th consecutive gain backed by near average volume. Showed great earning increases with strong underlying sales revenues growth for the Jun and Sep '20 quarters versus the year ago periods. Annual earnings growth has been strong. Completed new Public Offerings on 6/06/19 and 5/13/20.
>>> FEATURED STOCK ARTICLE : Churning Action Near Prior High Indicative of Distributional Pressure - 11/12/2020 |
View all notes |
Set NEW NOTE alert |
Company Profile |
SEC
News |
Chart |
Request a new note
C
A
S
I |
|
|
|
THESE ARE NOT BUY RECOMMENDATIONS!
Comments contained in the body of this report are technical
opinions only. The material herein has been obtained
from sources believed to be reliable and accurate, however,
its accuracy and completeness cannot be guaranteed.
This site is not an investment advisor, hence it does
not endorse or recommend any securities or other investments.
Any recommendation contained in this report may not
be suitable for all investors and it is not to be deemed
an offer or solicitation on our part with respect to
the purchase or sale of any securities. All trademarks,
service marks and trade names appearing in this report
are the property of their respective owners, and are
likewise used for identification purposes only.
This report is a service available
only to active Paid Premium Members.
You may opt-out of receiving report notifications
at any time. Questions or comments may be submitted
by writing to Premium Membership Services 665 S.E. 10 Street, Suite 201 Deerfield Beach, FL 33441-5634 or by calling 1-800-965-8307
or 954-785-1121.
|
|
|