You are not logged in.
This means you
CAN ONLY VIEW reports that were published prior to Tuesday, February 20, 2024.
You
MUST UPGRADE YOUR MEMBERSHIP if you want to see any current reports.
AFTER MARKET UPDATE - WEDNESDAY, NOVEMBER 20TH, 2019
Previous After Market Report Next After Market Report >>>
|
|
|
|
DOW |
-112.93 |
27,821.09 |
-0.40% |
|
Volume |
1,024,805,470 |
+22% |
|
Volume |
2,559,292,840 |
+24% |
|
NASDAQ |
-43.93 |
8,526.73 |
-0.51% |
|
Advancers |
1,259 |
44% |
|
Advancers |
1,208 |
39% |
|
S&P 500 |
-11.72 |
3,108.46 |
-0.38% |
|
Decliners |
1,593 |
56% |
|
Decliners |
1,886 |
61% |
|
Russell 2000 |
-6.72 |
1,591.57 |
-0.42% |
|
52 Wk Highs |
93 |
|
|
52 Wk Highs |
104 |
|
|
S&P 600 |
-6.18 |
974.03 |
-0.63% |
|
52 Wk Lows |
85 |
|
|
52 Wk Lows |
104 |
|
|
 |
Major Indices Fell With Higher Volume Totals
Kenneth J. Gruneisen - Passed the CAN SLIM® Master's Exam
The Dow fell 112 points, while the S&P 500 lost 0.4%, its largest decline in a month. The Nasdaq Composite was down 0.5%. Decliners led advancers by a 4-3 margin on the NYSE and 3-2 on the Nasdaq exchange. Volume totals reported were higher than the prior session on both major exchanges, indicative of distributional pressure or selling from large institutional investors. There were 42 high-ranked companies from the Leaders List that hit a new 52-week high and were listed on the BreakOuts Page, versus the total of 62 on the prior session. New 52-week highs totals outnumbered new 52-week lows totals on the NYSE, meanwhile the high and low totals were even on the Nasdaq exchange. The major indices (M criteria) are in a "confirmed uptrend" after enduring distributional pressure in recent weeks. The Featured Stocks Page provides the most timely analysis on high-ranked leaders. Charts used courtesy of www.stockcharts.com
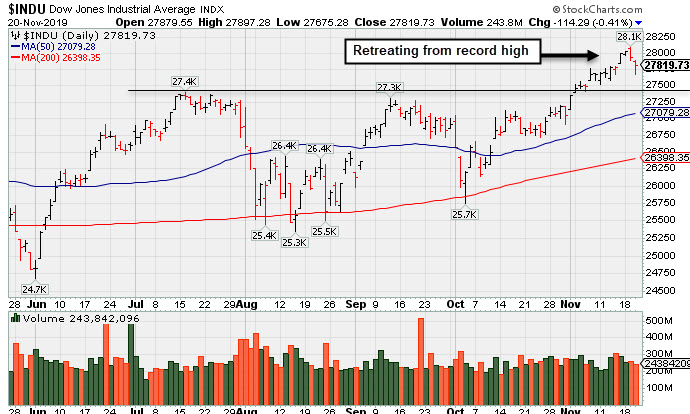
PICTURED: The Dow Jones Industrial Average is retreating from its record high.
Stocks finished lower Wednesday as lingering U.S.-China trade tensions pressured investor sentiment. The latest reports indicated that a “phase one” accord may not be solidified this year, as another deadlock in negotiations seems probable at this time. President Trump threatened to hike tariffs further if a preliminary agreement is not reached, while China has continued to press for more extensive rollbacks to existing duties. U.S. political intervention has complicated matters, as the Senate passed a measure supporting Hong Kong anti-government protesters.
Seven of 11 S&P 500 sectors closed in negative territory with Communication Services and Industrials leading decliners. Energy shares bucked the downtrend amid a rebound in oil prices. WTI crude jumped 3.4% to $57.11/barrel, bouncing back from its worst day since September. In earnings, Target (TGT +14.08%) rallied to a record high after its quarterly figures widely exceeded consensus expectations. The retailer saw its digital sales spike 31% during the quarter and subsequently raised its full-year guidance. Lowe’s (LOW +3.9%) rose following mostly positive results that included a bottom line beat and boost to its earnings forecast.
Treasuries advanced, with the yield on the 10-year note down five basis points to 1.73%, the lowest since the start of November. In central bank news, the minutes from the Fed’s latest meeting showed that most officials expected monetary policy would be well calibrated following the decision to reduce its benchmark rate for the third-straight meeting.
|
 Kenneth J. Gruneisen started out as a licensed stockbroker in August 1987, a couple of months prior to the historic stock market crash that took the Dow Jones Industrial Average down -22.6% in a single day. He has published daily fact-based fundamental and technical analysis on high-ranked stocks online for two decades. Through FACTBASEDINVESTING.COM, Kenneth provides educational articles, news, market commentary, and other information regarding proven investment systems that work in good times and bad.
Comments contained in the body of this report are technical opinions only and are not necessarily those of Gruneisen Growth Corp. The material herein has been obtained from sources believed to be reliable and accurate, however, its accuracy and completeness cannot be guaranteed. Our firm, employees, and customers may effect transactions, including transactions contrary to any recommendation herein, or have positions in the securities mentioned herein or options with respect thereto. Any recommendation contained in this report may not be suitable for all investors and it is not to be deemed an offer or solicitation on our part with respect to the purchase or sale of any securities. |
|
 |
Broker/Dealer, Biotech, and Commodity-Linked Groups Rose
Kenneth J. Gruneisen - Passed the CAN SLIM® Master's Exam
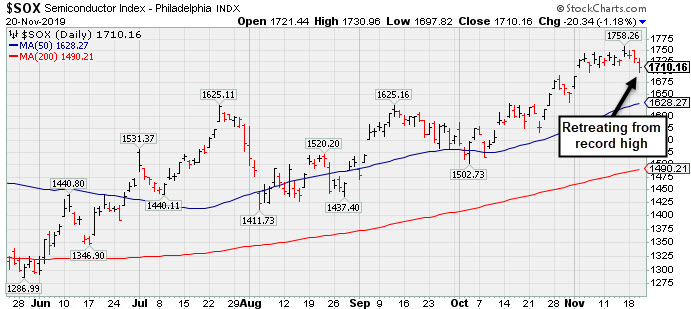
The Broker/Dealer Index ($XBD +0.29%) posted a small gain while the Bank Index ($BKX -0.52%) lost ground and the Retail Index ($RLX -0.05%) finished flat. The tech sector was mixed as the Biotech Index ($BTK +1.26%) rose while the Semiconductor Index ($SOX -1.18%) and the Networking Index ($NWX -0.65%) both ended the session lower. Commodity-linked ground had a positive bias as the Oil Services Index ($OSX +0.84%), Integrated Oil Index ($XOI +0.63%) and the Gold & Silver Index ($XAU +0.35%) posted unanimous gains.
PICTURED: The Semiconductor Index ($SOX -1.18%) is slumping from its record high.
| Oil Services |
$OSX |
65.78 |
+0.55 |
+0.84% |
-18.39% |
| Integrated Oil |
$XOI |
1,215.54 |
+7.67 |
+0.63% |
+4.87% |
| Semiconductor |
$SOX |
1,710.14 |
-20.36 |
-1.18% |
+48.04% |
| Networking |
$NWX |
579.54 |
-3.81 |
-0.65% |
+18.59% |
| Broker/Dealer |
$XBD |
279.54 |
+0.80 |
+0.29% |
+17.78% |
| Retail |
$RLX |
2,360.57 |
-1.23 |
-0.05% |
+20.97% |
| Gold & Silver |
$XAU |
95.67 |
+0.33 |
+0.35% |
+35.39% |
| Bank |
$BKX |
108.11 |
-0.57 |
-0.52% |
+26.02% |
| Biotech |
$BTK |
4,776.26 |
+59.37 |
+1.26% |
+13.16% |
|
|
|
 |
Powerful Gain for New High Backed by Heavy Volume
Kenneth J. Gruneisen - Passed the CAN SLIM® Master's Exam
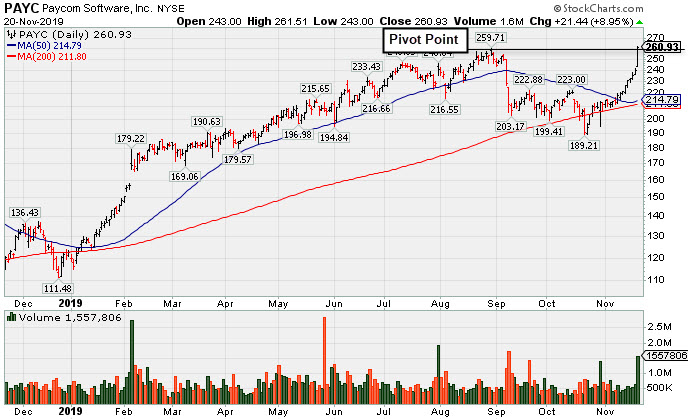
Paycom Software Inc (PAYC +$21.44 or +8.95% to $260.93) finished strong after highlighted in yellow with new pivot point cited based on its 8/29/19 high plus 10 cents in the earlier mid-day report (read here). The gain for a new high was backed by +167% above average volume and triggered a new technical buy signal. It powered to a new 52-week high with today's 10th consecutive gain.
The Computer Software - Enterprise firm went through a deep consolidation and rebounded since last shown in this FSU section on 8/26/19 under the headline "Recently Wedged Higher Without Great Volume Conviction". PAYC found support after undercutting its 200 DMA line since dropped from the Featured Stocks list when last noted on 9/12/19. Meanwhile, fundamentals remained strong. It reported earnings +35% on +31% sales revenues for the Sep '19 quarter.
The current Up/Down Volume Ratio of 1.8 is an unbiased indication its shares have been under accumulation over the past 50 days. Its small supply of only 58.4 million shares outstanding (S criteria) can contribute to greater price volatility in the event of institutional buying or selling. The number of top-rated funds owning its shares rose from 384 in Jun '17 to 862 in Sep '19, a reassuring sign concerning the I criteria. It has a Timeliness rating of B and Sponsorship rating of B. It completed Secondary Offerings on 11/13/15, 9/16/15, 5/15/15 and 1/14/15 since its $15 IPO on 4/15/14. |
|
|
Color Codes Explained :
Y - Better candidates highlighted by our
staff of experts.
G - Previously featured
in past reports as yellow but may no longer be buyable under the
guidelines.
***Last / Change / Volume data in this table is the closing quote data***
Symbol/Exchange
Company Name
Industry Group |
PRICE |
CHANGE
(%Change) |
Day High |
Volume
(% DAV)
(% 50 day avg vol) |
52 Wk Hi
% From Hi |
Featured
Date |
Price
Featured |
Pivot Featured |
|
Max Buy |
 MLR
-
NYSE
MLR
-
NYSE
Miller Industries Inc
AUTOMOTIVE - Auto Parts
|
$35.40
|
-0.54
-1.50% |
$36.14
|
48,479
112.74% of 50 DAV
50 DAV is 43,000
|
$37.70
-6.10%
|
9/24/2019
|
$34.00
|
PP = $35.36
|
|
MB = $37.13
|
 Most Recent Note - 11/20/2019 5:33:38 PM
Y - Showed resilience after recently reporting earnings which were below the fundamental guidelines of the fact-based investment system. Prior highs in the $35 area define initial support above its 50 DMA line ($34.03).
>>> FEATURED STOCK ARTICLE : Showing Resilience After Latest Quarter Missed Minimum Guidelines - 11/15/2019 |
View all notes |
Set NEW NOTE alert |
Company Profile |
SEC
News |
Chart |
Request a new note
C
A
S
I |
CCBG
-
NASDAQ
Capital City Bk Gp
BANKING - Regional - Mid-Atlantic Banks
|
$29.46
|
+0.01
0.03% |
$29.73
|
96,925
255.07% of 50 DAV
50 DAV is 38,000
|
$30.85
-4.51%
|
9/13/2019
|
$27.03
|
PP = $27.05
|
|
MB = $28.40
|
Most Recent Note - 11/20/2019 12:26:05 PM
G - Consolidating after getting extended from the prior base. Prior highs define important support to watch along with its 50 DMA line ($27.93).
>>> FEATURED STOCK ARTICLE : Consolidating After Volume-Driven Gains for New Highs - 11/19/2019 |
View all notes |
Set NEW NOTE alert |
Company Profile |
SEC
News |
Chart |
Request a new note
C
A
S
I |
FTNT
-
NASDAQ
Fortinet Inc
Computer Sftwr-Security
|
$102.45
|
-2.62
-2.49% |
$106.00
|
2,084,647
153.51% of 50 DAV
50 DAV is 1,358,000
|
$105.52
-2.91%
|
11/11/2019
|
$97.14
|
PP = $97.06
|
|
MB = $101.91
|
Most Recent Note - 11/20/2019 5:30:48 PM
G - There was a "negative reversal" after hitting a new all-time high today as it abruptly retreated for a loss with higher volume. Prior highs in the $97 area define initial support to watch on pullbacks.
>>> FEATURED STOCK ARTICLE : Reversed Into Red Today After Touching New High - 11/11/2019 |
View all notes |
Set NEW NOTE alert |
Company Profile |
SEC
News |
Chart |
Request a new note
C
A
S
I |
AUDC
-
NASDAQ
Audiocodes Ltd
ELECTRONICS - Scientific and Technical Instrum
|
$23.18
|
-0.04
-0.17% |
$23.48
|
319,159
108.93% of 50 DAV
50 DAV is 293,000
|
$24.35
-4.80%
|
9/13/2019
|
$19.68
|
PP = $19.84
|
|
MB = $20.83
|
Most Recent Note - 11/19/2019 1:51:05 PM
G - Retreating from its all-time high today following 3 consecutive gains marked by volume. Its 50 DMA line ($19.94) and recent low ($17.54 on 10/08/19) define important near-term support levels to watch. Bullish action came after it reported earnings +26% on +15% sales revenues for the Sep '19 quarter, continuing its strong earnings track record.
>>> FEATURED STOCK ARTICLE : Audiocodes is Quietly Perched Near its All-Time High - 11/7/2019 |
View all notes |
Set NEW NOTE alert |
Company Profile |
SEC
News |
Chart |
Request a new note
C
A
S
I |
CHDN
-
NASDAQ
Churchill Downs Inc
LEISURE - Gaming Activities
|
$129.40
|
+1.72
1.35% |
$129.88
|
259,347
93.63% of 50 DAV
50 DAV is 277,000
|
$135.32
-4.37%
|
10/8/2019
|
$129.77
|
PP = $132.83
|
|
MB = $139.47
|
Most Recent Note - 11/18/2019 6:26:29 PM
G - Rebounded above its 50 DMA line ($126.87) with today's gain backed by lighter than average volume. Reported Sep '19 earnings +4% on +38% sales revenues versus the year ago period, its 2nd consecutive quarterly comparison below the +25% minimum earnings guideline (C criteria), raising greater fundamental concerns. See the latest FSU analysis for more details and a new annotated graph.
>>> FEATURED STOCK ARTICLE : Resilience Shown Despite Another Sub Par Earnings Report - 11/18/2019 |
View all notes |
Set NEW NOTE alert |
Company Profile |
SEC
News |
Chart |
Request a new note
C
A
S
I |
Symbol/Exchange
Company Name
Industry Group |
PRICE |
CHANGE
(%Change) |
Day High |
Volume
(% DAV)
(% 50 day avg vol) |
52 Wk Hi
% From Hi |
Featured
Date |
Price
Featured |
Pivot Featured |
|
Max Buy |
LULU
-
NASDAQ
Lululemon Athletica
MANUFACTURING - Textile Manufacturing
|
$217.04
|
+0.16
0.07% |
$218.06
|
1,512,770
93.38% of 50 DAV
50 DAV is 1,620,000
|
$219.97
-1.33%
|
9/6/2019
|
$201.25
|
PP = $194.35
|
|
MB = $204.07
|
Most Recent Note - 11/18/2019 6:30:17 PM
G - Hit yet another new all-time high with today's 9th consecutive gain. Found prompt support again near its 50 DMA line ($199.87). The prior low ($191.21 on 11/05/19) defines the next important near-term support.
>>> FEATURED STOCK ARTICLE : Testing 50-Day Moving Average With Loss on Above Average Volume - 11/4/2019 |
View all notes |
Set NEW NOTE alert |
Company Profile |
SEC
News |
Chart |
Request a new note
C
A
S
I |
CPRT
-
NASDAQ
Copart Inc
SPECIALTY RETAIL - Auto Dealerships
|
$84.92
|
-1.46
-1.69% |
$86.56
|
3,468,183
237.71% of 50 DAV
50 DAV is 1,459,000
|
$86.79
-2.15%
|
9/5/2019
|
$79.13
|
PP = $79.84
|
|
MB = $83.83
|
Most Recent Note - 11/18/2019 6:28:20 PM
G - Color code is changed to green after recently rising above its "max buy" level. The 50 DMA line ($82.05) defines near-term support above the prior low ($76.35 on 10/03/19).
>>> FEATURED STOCK ARTICLE : Testing Support at 50-Day Moving Average - 11/6/2019 |
View all notes |
Set NEW NOTE alert |
Company Profile |
SEC
News |
Chart |
Request a new note
C
A
S
I |
NMIH
-
NASDAQ
N M I Holdings Inc Cl A
Finance-MrtgandRel Svc
|
$32.81
|
-0.63
-1.88% |
$33.54
|
635,000
144.98% of 50 DAV
50 DAV is 438,000
|
$34.50
-4.90%
|
11/8/2019
|
$32.89
|
PP = $31.44
|
|
MB = $33.01
|
Most Recent Note - 11/19/2019 6:39:31 PM
G - Holding its ground after rising above its "max buy" level with gains backed by above average volume. Reported earnings +54% on +42% sales revenues for the Sep '19 quarter, and prior quarterly comparisons were also well above the +25% minimum guideline (C criteria). After years of losses it had profitable years for FY '16, '17, and '18.
>>> FEATURED STOCK ARTICLE : Hit New High With Volume-Driven Gains - 11/8/2019 |
View all notes |
Set NEW NOTE alert |
Company Profile |
SEC
News |
Chart |
Request a new note
C
A
S
I |
PAYC
-
NYSE
Paycom Software Inc
COMPUTER SOFTWARE and SERVICES - Application Software
|
$260.93
|
+21.44
8.95% |
$261.51
|
1,557,730
267.19% of 50 DAV
50 DAV is 583,000
|
$259.71
0.47%
|
11/20/2019
|
$252.97
|
PP = $259.81
|
|
MB = $272.80
|
Most Recent Note - 11/20/2019 5:28:20 PM
Y - Finished strong today after highlighted in yellow with new pivot point cited based on its 8/29/19 high plus 10 cents. The big gain for a new high triggered a technical buy signal. Found support after undercutting its 200 DMA line since dropped from the Featured Stocks list on 9/12/19. Fundamentals remain strong. It reported earnings +35% on +31% sales revenues for the Sep '19 quarter. See the latest FSU analysis for more details and a new annotated graph.
>>> FEATURED STOCK ARTICLE : Powerful Gain for New High Backed by Heavy Volume - 11/20/2019 |
View all notes |
Set NEW NOTE alert |
Company Profile |
SEC
News |
Chart |
Request a new note
C
A
S
I |
BLD
-
NYSE
Topbuild Corp
Bldg-Constr Prds/Misc
|
$110.27
|
+0.33
0.30% |
$112.18
|
273,353
95.58% of 50 DAV
50 DAV is 286,000
|
$111.48
-1.09%
|
5/17/2019
|
$82.19
|
PP = $87.31
|
|
MB = $91.68
|
Most Recent Note - 11/19/2019 6:29:24 PM
G - Extended from any sound base and consolidating after volume-driven gains for new all-time highs. Reported earnings +24% on +5% sales revenues for the Sep '19 quarter versus the year ago period, just below the +25% minimum guideline (C criteria). Found prompt support near its 50 DMA line ($99.84) during its ongoing ascent.
>>> FEATURED STOCK ARTICLE : Perched Near High Following Recent Volume-Driven Gains - 11/12/2019 |
View all notes |
Set NEW NOTE alert |
Company Profile |
SEC
News |
Chart |
Request a new note
C
A
S
I |
Symbol/Exchange
Company Name
Industry Group |
PRICE |
CHANGE
(%Change) |
Day High |
Volume
(% DAV)
(% 50 day avg vol) |
52 Wk Hi
% From Hi |
Featured
Date |
Price
Featured |
Pivot Featured |
|
Max Buy |
GLOB
-
NYSE
Globant SA
Computer-Tech Services
|
$99.56
|
+3.63
3.78% |
$99.62
|
327,128
134.62% of 50 DAV
50 DAV is 243,000
|
$112.33
-11.37%
|
11/14/2019
|
$106.87
|
PP = $112.43
|
|
MB = $118.05
|
Most Recent Note - 11/20/2019 5:32:33 PM
G - Rebounding following 2 damaging volume-driven losses after recently featured, finding prompt support near its 50 DMA line ($94.92). Reported earnings +35% on +27% sales revenues for the Sep '19 quarter.
>>> FEATURED STOCK ARTICLE : Rallying Near High With 12th Consecutive Gain - 11/14/2019 |
View all notes |
Set NEW NOTE alert |
Company Profile |
SEC
News |
Chart |
Request a new note
C
A
S
I |
|
|
|
THESE ARE NOT BUY RECOMMENDATIONS!
Comments contained in the body of this report are technical
opinions only. The material herein has been obtained
from sources believed to be reliable and accurate, however,
its accuracy and completeness cannot be guaranteed.
This site is not an investment advisor, hence it does
not endorse or recommend any securities or other investments.
Any recommendation contained in this report may not
be suitable for all investors and it is not to be deemed
an offer or solicitation on our part with respect to
the purchase or sale of any securities. All trademarks,
service marks and trade names appearing in this report
are the property of their respective owners, and are
likewise used for identification purposes only.
This report is a service available
only to active Paid Premium Members.
You may opt-out of receiving report notifications
at any time. Questions or comments may be submitted
by writing to Premium Membership Services 665 S.E. 10 Street, Suite 201 Deerfield Beach, FL 33441-5634 or by calling 1-800-965-8307
or 954-785-1121.
|
|
|