You are not logged in.
This means you
CAN ONLY VIEW reports that were published prior to Monday, February 19, 2024.
You
MUST UPGRADE YOUR MEMBERSHIP if you want to see any current reports.
AFTER MARKET UPDATE - MONDAY, NOVEMBER 19TH, 2018
Previous After Market Report Next After Market Report >>>
|
|
|
|
DOW |
-395.78 |
25,017.44 |
-1.56% |
|
Volume |
908,933,020 |
-14% |
|
Volume |
2,336,829,610 |
-4% |
|
NASDAQ |
-219.39 |
7,028.48 |
-3.03% |
|
Advancers |
790 |
26% |
|
Advancers |
788 |
25% |
|
S&P 500 |
-45.54 |
2,690.73 |
-1.66% |
|
Decliners |
2,197 |
74% |
|
Decliners |
2,308 |
75% |
|
Russell 2000 |
-30.99 |
1,496.54 |
-2.03% |
|
52 Wk Highs |
47 |
|
|
52 Wk Highs |
19 |
|
|
S&P 600 |
-15.70 |
945.74 |
-1.63% |
|
52 Wk Lows |
242 |
|
|
52 Wk Lows |
193 |
|
|
 |
Major Indices Slump Dear Rally's Day 1 Lows as Leadership Thins
Kenneth J. Gruneisen - Passed the CAN SLIM® Master's Exam
Stocks finished lower Monday. The Dow fell 395 points to 25,017, while the S&P 500 dropped 45 points to 2,690. The Nasdaq Composite was down 219 points to 7,028. The volume totals reported were lighter on the NYSE and on the Nasdaq exchange versus the prior session. Decliners led advancers by nearly 3-1 on the NYSE and on the Nasdaq exchange. There were 21 high-ranked companies from the Leaders List that made new 52-week highs and were listed on the BreakOuts Page, matching the 21 on the prior session. New 52-week lows totals expanded and solidly outnumbered new 52-week highs totals on the NYSE and on the Nasdaq exchange. Technically, the major indices (M criteria) are under pressure while leadership is thin. The Featured Stocks Page provides the most timely analysis on high-ranked leaders. Strict buying and selling rules should always be followed on a case by case basis. Charts used courtesy of www.stockcharts.com
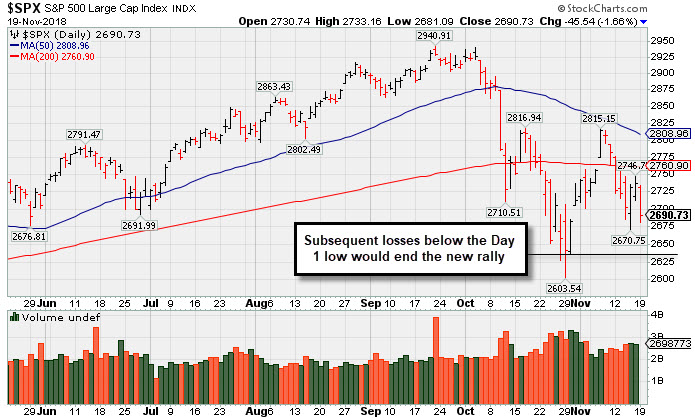
PICTURED: The S&P 500 Index is sputtering below its 200-day moving average (DMA) line and toward the prior low. The solid follow-through day on 11/07/18 was noted as a reassuring sign, however, subsequent losses undercutting the Day 1 lows would technically end the latest confirmed rally.
U.S. equities extended last week’s decline as broad weakness in Tech shares continued to weigh on the major averages. Trade relations also garnered an outsized focus after Vice President Mike Pence reiterated the U.S. will not yield on tariffs unless China makes significant concessions. On the data front, a report showed homebuilder sentiment in November suffered its steepest monthly decline since February 2014.
Nine of 11 S&P 500 sectors closed in negative territory. The Tech sector led decliners, with Apple (AAPL -3.96%) down after The Wall Street Journal reported production orders were slashed for all three iPhone models unveiled earlier in the year. Chipmakers provided a headwind as NVIDIA (NVDA -12.00%) and Micron Technology (MU -6.61%) fell. The oft-cited “FAANG” fell 4.8%. Industrials also underperformed in sympathy with lingering trade concerns, with Boeing (BA -4.47%) and Caterpillar (CAT -3.06%) slumping. In earnings, JD.com (JD -8.42%) fell after the Chinese eCommerce giant missed analyst revenue estimates.
Treasuries were higher with the yield on the benchmark 10-year note down two basis points to 3.05%. In commodities, WTI crude gained 0.5% to $56.76/barrel. COMEX gold rose 0.1% to $1,224.70/ounce amid a weaker dollar. |
 Kenneth J. Gruneisen started out as a licensed stockbroker in August 1987, a couple of months prior to the historic stock market crash that took the Dow Jones Industrial Average down -22.6% in a single day. He has published daily fact-based fundamental and technical analysis on high-ranked stocks online for two decades. Through FACTBASEDINVESTING.COM, Kenneth provides educational articles, news, market commentary, and other information regarding proven investment systems that work in good times and bad.
Comments contained in the body of this report are technical opinions only and are not necessarily those of Gruneisen Growth Corp. The material herein has been obtained from sources believed to be reliable and accurate, however, its accuracy and completeness cannot be guaranteed. Our firm, employees, and customers may effect transactions, including transactions contrary to any recommendation herein, or have positions in the securities mentioned herein or options with respect thereto. Any recommendation contained in this report may not be suitable for all investors and it is not to be deemed an offer or solicitation on our part with respect to the purchase or sale of any securities. |
|
 |
Retail and Tech Indices Had a Negative Bias
Kenneth J. Gruneisen - Passed the CAN SLIM® Master's Exam
The Retail Index ($RLX -3.54%) was a standout decliner that created a drag on the major indices while the Broker/Dealer Index ($XBD -1.31%) fell and the Bank Index ($BKX +0.22%) eked out a small gain. The Semiconductor Index ($SOX -3.86%), Networking Index ($NWX -2.17%) and the Biotech Index ($BTK -2.37%) each suffered big losses. Commodity-linked groups were less decisive as the Oil Services Index ($OSX +0.37%) edged higher but the Integrated Oil Index ($XOI -0.99%) and the Gold & Silver Index ($XAU -0.57%) both fell.
Charts courtesy of www.stockcharts.com
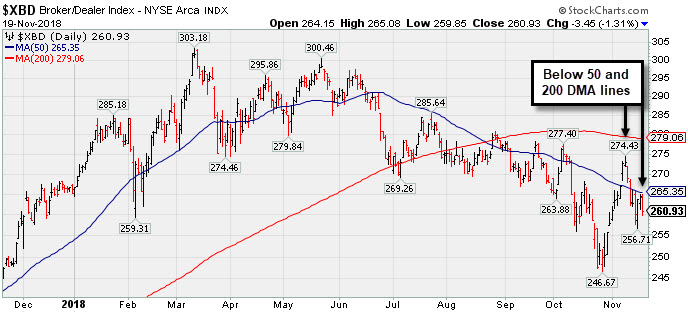 PICTURED: The Broker/Dealer Index ($XBD -1.31%) is sputtering below its 50-day and 200-day moving average (DMA) lines after recently slumping to new 2018 lows.
| Oil Services |
$OSX |
111.73 |
+0.41 |
+0.37% |
-25.29% |
| Integrated Oil |
$XOI |
1,327.10 |
-13.31 |
-0.99% |
-0.63% |
| Semiconductor |
$SOX |
1,173.01 |
-47.13 |
-3.86% |
-6.39% |
| Networking |
$NWX |
507.58 |
-11.24 |
-2.17% |
+3.48% |
| Broker/Dealer |
$XBD |
260.93 |
-3.45 |
-1.31% |
-1.63% |
| Retail |
$RLX |
2,007.10 |
-73.68 |
-3.54% |
+15.77% |
| Gold & Silver |
$XAU |
65.70 |
-0.38 |
-0.58% |
-22.95% |
| Bank |
$BKX |
100.48 |
+0.11 |
+0.11% |
-5.84% |
| Biotech |
$BTK |
4,496.34 |
-109.02 |
-2.37% |
+6.49% |
|
|
|
 |
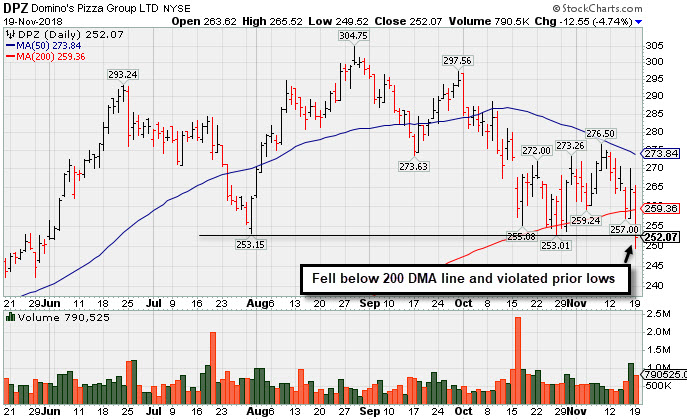
Slump Below Prior Lows Raises More Serious Concerns
Kenneth J. Gruneisen - Passed the CAN SLIM® Master's Exam
Dominos Pizza Inc (DPZ -$12.55 or -4.74% to $252.07) slumped below its 200-day moving average (DMA) line and below prior lows ($253) today triggering a technical sell signal. It will be dropped from the Featured Stocks list tonight. Recently it met resistance at its 50 DMA line ($273.87), but a rebound above the 50 DMA line is needed for its outlook to improve. Fundamentals remain strong.
The popular pizza firm recently reported earnings +54% on +22% sales revenues for the Sep '18 quarter, continuing its strong earnings track record. That marked its 9th consecutive quarterly comparison above the +25% minimum earnings guideline (C criteria). Annual earnings (A criteria) growth has been good. The company has a new CEO effective 7/02/18. The Retail - Restaurants industry group currently has a Relative Strength rating of 91, and leadership (L criteria) from others in the group is also a reassuring sign.
It was shown in this FSU section on 10/31/18 with an annotated graph under the headline, "Found Support at 200-Day Moving Average Line". DPZ was highlighted in the 2/20/18 mid-day report with pivot point cited based on its 1/25/18 high plus 10 cents (read here). The number of top-rated funds owning its shares rose from 772 in Mar '17 to 978 in Sep '18 a reassuring sign concerning the I criteria. Its current Up/Down Volume Ratio of 0.9 is an unbiased indication its shares have been under accumulation over the past 50 days. It has a small supply of only 41.6 million shares outstanding (S criteria). |
|
|
Color Codes Explained :
Y - Better candidates highlighted by our
staff of experts.
G - Previously featured
in past reports as yellow but may no longer be buyable under the
guidelines.
***Last / Change / Volume data in this table is the closing quote data***
Symbol/Exchange
Company Name
Industry Group |
PRICE |
CHANGE
(%Change) |
Day High |
Volume
(% DAV)
(% 50 day avg vol) |
52 Wk Hi
% From Hi |
Featured
Date |
Price
Featured |
Pivot Featured |
|
Max Buy |
MPX
-
NYSE
Marine Products Corp
AUTOMOTIVE - Recreational Vehicles
|
$21.43
|
-1.22
-5.39% |
$22.65
|
40,141
87.26% of 50 DAV
50 DAV is 46,000
|
$24.82
-13.66%
|
10/24/2018
|
$23.00
|
PP = $24.92
|
|
MB = $26.17
|
 Most Recent Note - 11/19/2018 5:14:54 PM
G - Slumped below its 50 DMA line ($22.22) again and its color code is changed to green. Recent low ($20.25 on 10/26/18) defines the next important support. A rebound above the 50 DMA line is needed for its outlook to improve. Subsequent gains above the pivot point backed by at least +40% above average volume may trigger a technical buy signal.
>>> FEATURED STOCK ARTICLE : Perched Within Striking Distance of Pivot Point - 11/13/2018 |
View all notes |
Set NEW NOTE alert |
Company Profile |
SEC
News |
Chart |
Request a new note
C
A
S
I |
GMED
-
NYSE
Globus Medical Inc Cl A
CHEMICALS - Specialty Chemicals
|
$50.33
|
-1.43
-2.76% |
$52.09
|
624,790
82.64% of 50 DAV
50 DAV is 756,000
|
$57.83
-12.97%
|
9/26/2018
|
$56.11
|
PP = $57.65
|
|
MB = $60.53
|
Most Recent Note - 11/14/2018 5:29:22 PM
G - Sank below its 200 DMA line ($51.67) near the prior low with lighter volume behind today's 4th consecutive loss, finishing -12.8% off its all-time high. The prior low ($49.34 on 10/08/18) defines important near term support.
>>> FEATURED STOCK ARTICLE : Consolidating -5.2% Off 52-Week High Ahead of Earnings News - 11/5/2018 |
View all notes |
Set NEW NOTE alert |
Company Profile |
SEC
News |
Chart |
Request a new note
C
A
S
I |
ZBRA
-
NASDAQ
Zebra Tech Corp Cl A
COMPUTER HARDWARE - Computer Peripherals
|
$169.41
|
-11.29
-6.25% |
$181.02
|
391,118
84.47% of 50 DAV
50 DAV is 463,000
|
$184.75
-8.30%
|
11/6/2018
|
$170.41
|
PP = $179.57
|
|
MB = $188.55
|
Most Recent Note - 11/19/2018 5:19:19 PM
Y - Suffered a big loss today on light volume testing its 50 DMA line ($169.78). Disciplined investors are reminded to always follow strict buy and sell rules.
>>> FEATURED STOCK ARTICLE : Hit New High Following Another Strong Earnings Increase - 11/6/2018 |
View all notes |
Set NEW NOTE alert |
Company Profile |
SEC
News |
Chart |
Request a new note
C
A
S
I |
CME
-
NASDAQ
C M E Group Inc
DIVERSIFIED SERVICES - Business/Management Services
|
$195.61
|
+0.00
0.00% |
$197.08
|
1,997,450
106.59% of 50 DAV
50 DAV is 1,874,000
|
$196.17
-0.29%
|
10/4/2018
|
$179.29
|
PP = $177.45
|
|
MB = $186.32
|
Most Recent Note - 11/13/2018 5:37:58 PM
G - Holding its ground near its all-time high after rising above its "max buy" level with an impressive streak of gains. Found support above its 50 DMA line ($178) after recently reporting earnings +22% on +2% sales revenues for the Sep '18 quarter, below the +25% minimum earnings guideline (C criteria), raising fundamental concerns. The 50 DMA line and prior low ($170.04 on 9/28/18) define important near-term support.
>>> FEATURED STOCK ARTICLE : Extended From Base After More Gain With Above Average Volume - 11/15/2018 |
View all notes |
Set NEW NOTE alert |
Company Profile |
SEC
News |
Chart |
Request a new note
C
A
S
I |
GDOT
-
NYSE
Green Dot Corp Cl A
FINANCIAL SERVICES - Credit Services
|
$77.27
|
-7.54
-8.89% |
$84.81
|
658,461
145.04% of 50 DAV
50 DAV is 454,000
|
$93.00
-16.91%
|
11/8/2018
|
$90.35
|
PP = $91.61
|
|
MB = $96.19
|
Most Recent Note - 11/19/2018 12:25:59 PM
G - Color code is changed to green while slumping back below its 50 DMA line ($81.81) today hurting its outlook. Its 200 DMA line ($74.42) and prior low ($71.50) define important near-term support.
>>> FEATURED STOCK ARTICLE : Volume Heavy Behind Rally to New High - 11/8/2018 |
View all notes |
Set NEW NOTE alert |
Company Profile |
SEC
News |
Chart |
Request a new note
C
A
S
I |
Symbol/Exchange
Company Name
Industry Group |
PRICE |
CHANGE
(%Change) |
Day High |
Volume
(% DAV)
(% 50 day avg vol) |
52 Wk Hi
% From Hi |
Featured
Date |
Price
Featured |
Pivot Featured |
|
Max Buy |
HZO
-
NYSE
Marinemax Inc
SPECIALTY RETAIL - Specialty Retail, Other
|
$22.72
|
-0.15
-0.66% |
$23.00
|
263,079
78.30% of 50 DAV
50 DAV is 336,000
|
$26.11
-12.98%
|
11/2/2018
|
$25.10
|
PP = $25.15
|
|
MB = $26.41
|
Most Recent Note - 11/16/2018 5:25:50 PM
Y - Volume totals have cooled but has slumped back into the prior base, raising concerns while completely negating the latest technical breakout. Fundamentals remain strong. Disciplined investors always limit losses by selling any stock that falls more than -7% from their purchase price.
>>> FEATURED STOCK ARTICLE : Boat Retailer Has Strong Earnings History - 11/2/2018 |
View all notes |
Set NEW NOTE alert |
Company Profile |
SEC
News |
Chart |
Request a new note
C
A
S
I |
ULTA
-
NASDAQ
Ulta Beauty Inc
SPECIALTY RETAIL - Specialty Retail, Other
|
$313.28
|
-0.28
-0.09% |
$322.49
|
1,019,983
108.97% of 50 DAV
50 DAV is 936,000
|
$321.73
-2.63%
|
11/8/2018
|
$296.36
|
PP = $290.40
|
|
MB = $304.92
|
Most Recent Note - 11/19/2018 12:44:13 PM
G - Hit another new all-time high today. Prior high ($290) defines initial support to watch above its 50 DMA line ($283).
>>> FEATURED STOCK ARTICLE : Volume Driven Gains Indicate Institutional Buying Demand - 11/9/2018 |
View all notes |
Set NEW NOTE alert |
Company Profile |
SEC
News |
Chart |
Request a new note
C
A
S
I |
UBNT
-
NASDAQ
Ubiquiti Networks Inc
TELECOMMUNICATIONS - Diversified Communication Serv
|
$109.18
|
-2.25
-2.02% |
$112.45
|
341,851
63.31% of 50 DAV
50 DAV is 540,000
|
$112.38
-2.85%
|
11/9/2018
|
$108.20
|
PP = $101.43
|
|
MB = $106.50
|
Most Recent Note - 11/14/2018 1:28:57 PM
G - Color code is changed to green while trading above its "max buy" level and near its all-time high. Disciplined investors avoid chasing stocks more than +5% above the pivot point. Prior high ($101.33 on 9/25/18) defines initial support to watch on pullbacks.
>>> FEATURED STOCK ARTICLE : Pullback Following Breakout Gain on After Latest Earnings Report - 11/12/2018 |
View all notes |
Set NEW NOTE alert |
Company Profile |
SEC
News |
Chart |
Request a new note
C
A
S
I |
DPZ
-
NYSE
Dominos Pizza Inc
Retail-Restaurants
|
$252.07
|
-12.55
-4.74% |
$265.52
|
790,525
130.67% of 50 DAV
50 DAV is 605,000
|
$305.34
-17.45%
|
8/13/2018
|
$288.60
|
PP = $293.91
|
|
MB = $308.61
|
Most Recent Note - 11/19/2018 5:24:02 PM
Violated the prior lows ($253) today while slumping further below its 200 DMA line ($260) triggering a more worrisome technical sell signal. A rebound above the 50 DMA line is needed for its outlook to improve. It will be dropped from the Featured Stocks list tonight. See the latest FSU analysis for more details and a new annotated graph.
>>> FEATURED STOCK ARTICLE : Slump Below Prior Lows Raises More Serious Concerns - 11/19/2018 |
View all notes |
Set NEW NOTE alert |
Company Profile |
SEC
News |
Chart |
Request a new note
C
A
S
I |
FIVE
-
NASDAQ
Five Below Inc
Retail-DiscountandVariety
|
$114.12
|
-5.82
-4.85% |
$120.33
|
844,344
96.83% of 50 DAV
50 DAV is 872,000
|
$136.13
-16.17%
|
7/6/2018
|
$98.90
|
PP = $104.09
|
|
MB = $109.29
|
Most Recent Note - 11/14/2018 5:24:30 PM
G - Consolidating above its 50 DMA line ($121.53). Faces some resistance due to overhead supply up to the $136 level. The recent low ($108.76 on 10/26/18) defines important near term support to watch on pullbacks. See the latest FSU analysis for more details and a new annotated graph.
>>> FEATURED STOCK ARTICLE : Consolidating Near 50-Day Moving Average After Finding Support - 11/14/2018 |
View all notes |
Set NEW NOTE alert |
Company Profile |
SEC
News |
Chart |
Request a new note
C
A
S
I |
Symbol/Exchange
Company Name
Industry Group |
PRICE |
CHANGE
(%Change) |
Day High |
Volume
(% DAV)
(% 50 day avg vol) |
52 Wk Hi
% From Hi |
Featured
Date |
Price
Featured |
Pivot Featured |
|
Max Buy |
HQY
-
NASDAQ
Healthequity Inc
COMPUTER SOFTWARE and SERVICES - Healthcare Information Service
|
$76.39
|
-8.91
-10.45% |
$85.15
|
1,100,097
119.58% of 50 DAV
50 DAV is 920,000
|
$101.58
-24.80%
|
11/2/2018
|
$95.56
|
PP = $100.09
|
|
MB = $105.09
|
Most Recent Note - 11/19/2018 5:17:23 PM
G - Suffered a big loss today and finished near its 200 DMA line ($76.69) after violating the prior low ($80.56 on 10/24/18) triggering a technical sell signal. A rebound above the 50 DMA line is needed for its outlook to improve.
>>> FEATURED STOCK ARTICLE : Rebound Above 50-Day Average Helped Outlook Improve - 11/1/2018 |
View all notes |
Set NEW NOTE alert |
Company Profile |
SEC
News |
Chart |
Request a new note
C
A
S
I |
OLLI
-
NASDAQ
Ollie's Bargain Outlet
Retail-DiscountandVariety
|
$88.70
|
-2.00
-2.21% |
$91.15
|
630,393
97.74% of 50 DAV
50 DAV is 645,000
|
$97.61
-9.13%
|
11/16/2018
|
$90.70
|
PP = $97.71
|
|
MB = $102.60
|
Most Recent Note - 11/16/2018 5:22:32 PM
Y - Color code is changed to yellow after a gain today on higher volume led to a close near its 50 DMA line ($91.07). New pivot point cited is based on its 10/01/18 high plus 10 cents. Subsequent gains above the pivot point backed by at least +40% above average volume may trigger a new (or add-on) technical buy signal. The recent low ($84.66 on 10/11/18) defines the next important support to watch. Fundamentals remain strong. See the latest FSU analysis for more details and a new annotated graph.
>>> FEATURED STOCK ARTICLE : Consolidating Near 50-Day Average Forming New Base - 11/16/2018 |
View all notes |
Set NEW NOTE alert |
Company Profile |
SEC
News |
Chart |
Request a new note
C
A
S
I |
PLNT
-
NYSE
Planet Fitness Inc Cl A
Leisure-Services
|
$50.67
|
-2.77
-5.18% |
$53.44
|
1,372,623
105.75% of 50 DAV
50 DAV is 1,298,000
|
$57.66
-12.12%
|
11/7/2018
|
$57.10
|
PP = $55.45
|
|
MB = $58.22
|
Most Recent Note - 11/19/2018 5:20:41 PM
Y - Suffered a big loss on higher (near average) volume today. Its 50 DMA line ($50.01) defines important support. Following a recent breakout it slumped back into the prior base with a damaging loss on 11/12/18 raising concerns.
>>> FEATURED STOCK ARTICLE : Big Gain for New High With Nearly 4 Times Average Volume - 11/7/2018 |
View all notes |
Set NEW NOTE alert |
Company Profile |
SEC
News |
Chart |
Request a new note
C
A
S
I |
|
|
|
THESE ARE NOT BUY RECOMMENDATIONS!
Comments contained in the body of this report are technical
opinions only. The material herein has been obtained
from sources believed to be reliable and accurate, however,
its accuracy and completeness cannot be guaranteed.
This site is not an investment advisor, hence it does
not endorse or recommend any securities or other investments.
Any recommendation contained in this report may not
be suitable for all investors and it is not to be deemed
an offer or solicitation on our part with respect to
the purchase or sale of any securities. All trademarks,
service marks and trade names appearing in this report
are the property of their respective owners, and are
likewise used for identification purposes only.
This report is a service available
only to active Paid Premium Members.
You may opt-out of receiving report notifications
at any time. Questions or comments may be submitted
by writing to Premium Membership Services 665 S.E. 10 Street, Suite 201 Deerfield Beach, FL 33441-5634 or by calling 1-800-965-8307
or 954-785-1121.
|
|
|