You are not logged in.
This means you
CAN ONLY VIEW reports that were published prior to Sunday, February 25, 2024.
You
MUST UPGRADE YOUR MEMBERSHIP if you want to see any current reports.
AFTER MARKET UPDATE - FRIDAY, NOVEMBER 16TH, 2018
Previous After Market Report Next After Market Report >>>
|
|
|
|
DOW |
+123.95 |
25,413.22 |
+0.49% |
|
Volume |
1,058,002,970 |
+11% |
|
Volume |
2,422,224,910 |
-3% |
|
NASDAQ |
-11.16 |
7,247.87 |
-0.15% |
|
Advancers |
1,566 |
53% |
|
Advancers |
1,543 |
51% |
|
S&P 500 |
+6.07 |
2,736.27 |
+0.22% |
|
Decliners |
1,408 |
47% |
|
Decliners |
1,503 |
49% |
|
Russell 2000 |
+3.41 |
1,527.53 |
+0.22% |
|
52 Wk Highs |
40 |
|
|
52 Wk Highs |
32 |
|
|
S&P 600 |
+2.90 |
961.44 |
+0.30% |
|
52 Wk Lows |
182 |
|
|
52 Wk Lows |
143 |
|
|
 |
Weekly Losses for Indices Show the New Rally is Sputtering
Kenneth J. Gruneisen - Passed the CAN SLIM® Master's Exam
For the week, the Dow fell 2.2% while the S&P 500 lost 1.6%. The Nasdaq declined 2.2%. Stocks finished mixed Friday. The Dow gained 123 points to 25413 while the S&P 500 added 6 points to 2736. The Nasdaq Composite lost 11 points to 7247. The volume totals reported were lighter on the NYSE and on the Nasdaq exchange versus the prior session, indicative of lackluster buying demand from the institutional crowd. Advancers had a slight lead over decliners on the NYSE and on the Nasdaq exchange. There were 20 high-ranked companies from the Leaders List that made new 52-week highs and were listed on the BreakOuts Page, versus 11 on the prior session. New 52-week lows solidly outnumbered new 52-week highs totals on the NYSE and on the Nasdaq exchange. Technically, bullish action on 11/07/18 marked a shift in the market direction (M criteria) confirming a new uptrend, however, pressure returned as leadership has again grown thin. The Featured Stocks Page provides the most timely analysis on high-ranked leaders. Strict buying and selling rules should always be followed on a case by case basis. Charts used courtesy of www.stockcharts.com
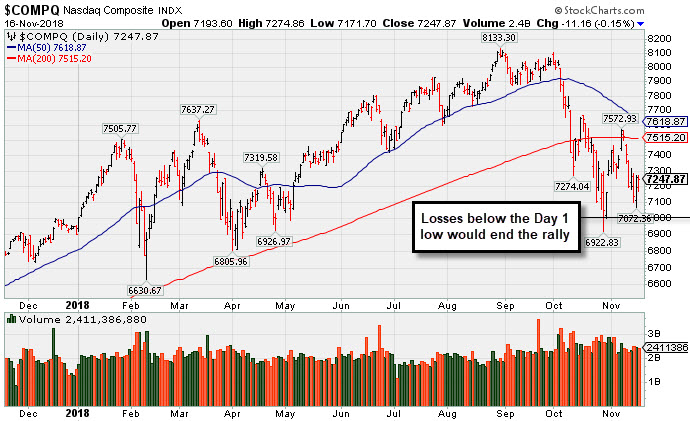
PICTURED: The Nasdaq Composite index is sputtering below its 200-day moving average (DMA) line and toward the prior low. The solid follow-through day on 11/07/18 was noted as a reassuring sign, however, subsequent losses undercutting the Day 1 lows would technically end the latest confirmed rally.
The Dow and S&P 500 reversed early session losses after President Trump struck an optimistic tone regarding trade relations between the U.S. and China. The tech-heavy Nasdaq meanwhile declined, unable to overcome weakness in chipmakers. On the data front, industrial production increased 0.1% in October, below projections of 0.2% amid declines in mining and utilities outputs. An additional update showed U.S. factory production expanded for the fifth straight month in October, the longest streak since 2011.
Seven of 11 S&P 500 sectors ended in positive territory. Utilities outperformed with PG&E Corp (PCG +37.54%) rebounded after a California regulator stated the government won’t let the utility go bankrupt. The Consumer Discretionary sector lagged as Nordstrom (JWN 13.66%) fell after the retailer announced a one-time charge-off totaling $72 million. In other earnings news, NVIDIA (NVDA -18.76%) fell after the chipmaker missed revenue projections and lowered its forward guidance.
Treasuries strengthened with the yield on the benchmark 10-year note down four basis points to 3.07%. In commodities, WTI crude added 0.6% to $56.77/barrel. COMEX gold advanced 0.6% to $1,222.30/ounce amid a weaker dollar. |
 Kenneth J. Gruneisen started out as a licensed stockbroker in August 1987, a couple of months prior to the historic stock market crash that took the Dow Jones Industrial Average down -22.6% in a single day. He has published daily fact-based fundamental and technical analysis on high-ranked stocks online for two decades. Through FACTBASEDINVESTING.COM, Kenneth provides educational articles, news, market commentary, and other information regarding proven investment systems that work in good times and bad.
Comments contained in the body of this report are technical opinions only and are not necessarily those of Gruneisen Growth Corp. The material herein has been obtained from sources believed to be reliable and accurate, however, its accuracy and completeness cannot be guaranteed. Our firm, employees, and customers may effect transactions, including transactions contrary to any recommendation herein, or have positions in the securities mentioned herein or options with respect thereto. Any recommendation contained in this report may not be suitable for all investors and it is not to be deemed an offer or solicitation on our part with respect to the purchase or sale of any securities. |
|
 |
Commodity-Linked Groups, Biotech, and Broker/Dealer Indexes Rose
Kenneth J. Gruneisen - Passed the CAN SLIM® Master's Exam
The Bank Index ($BKX -0.18%) edged lower while the Broker/Dealer Index ($XBD +0.26%) edged higher, meanwhile the Retail Index ($RLX -1.10%) slumped and created a drag on the major indices. The Semiconductor Index ($SOX -1.17%) slumped and the Networking Index ($NWX -0.28%) also edged lower, meanwhile the Biotech Index ($BTK +1.22%) rose. Commodity-linked groups had a positive bias again as the Oil Services Index ($OSX +0.30%), Integrated Oil Index ($XOI +0.95%), and the Gold & Silver Index ($XAU +1.67%) all posted gains.
Charts courtesy of www.stockcharts.com
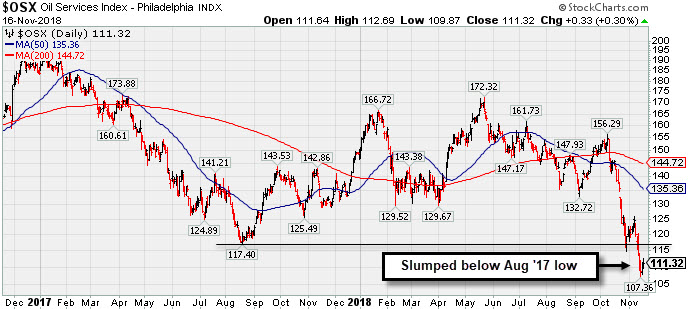 PICTURED: The Oil Services Index ($OSX +0.30%) remains well below its 50-day and 200-day moving average (DMA) lines after recently slumping below its August 2017 low.
| Oil Services |
$OSX |
111.32 |
+0.34 |
+0.31% |
-25.56% |
| Integrated Oil |
$XOI |
1,340.41 |
+12.72 |
+0.96% |
+0.36% |
| Semiconductor |
$SOX |
1,220.14 |
-14.48 |
-1.17% |
-2.63% |
| Networking |
$NWX |
518.82 |
-1.45 |
-0.28% |
+5.77% |
| Broker/Dealer |
$XBD |
264.38 |
+0.68 |
+0.26% |
-0.32% |
| Retail |
$RLX |
2,080.78 |
-23.05 |
-1.10% |
+20.01% |
| Gold & Silver |
$XAU |
66.08 |
+1.09 |
+1.68% |
-22.50% |
| Bank |
$BKX |
100.37 |
-0.18 |
-0.18% |
-5.94% |
| Biotech |
$BTK |
4,605.36 |
+55.48 |
+1.22% |
+9.07% |
|
|
|
 |
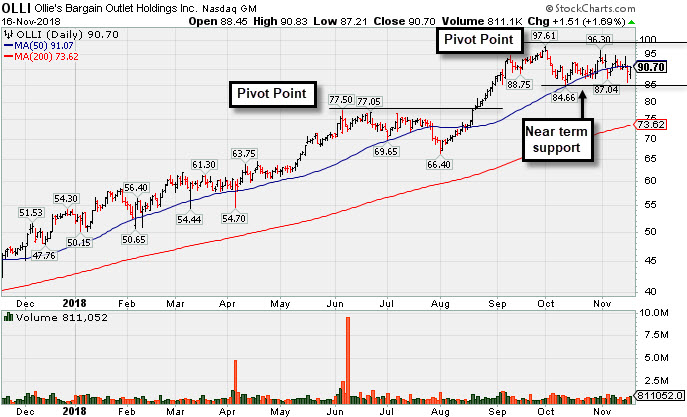
Consolidating Near 50-Day Average Forming New Base
Kenneth J. Gruneisen - Passed the CAN SLIM® Master's Exam
Ollie's Bargain Outlet (OLLI +$4.05 or +4.57% to $92.72) rebounded near its 50-day moving average (DMA) line ($91.07) with today's volume-driven gain. Its color code is changed to yellow with new pivot point cited based on its 10/01/18 high plus 10 cents. Subsequent gains above the pivot point backed by at least +40% above average volume may trigger a new (or add-on) technical buy signal. Meanwhile, the prior low ($84.66 on 10/11/18) defines important near-term support where any violation may raise serious concerns and trigger a technical sell signal.
It is due to report earnings on December 6th. Fundamentals remain strong. OLLI was last shown in this FSU section on 10/30/18 with an annotated graph under the headline, "Finding Support Near its 50-Day Moving Average". Recently it reported earnings +48% on +13% sales revenues for the Jul '18 quarter, continuing its strong earnings track record and meeting the +25% minimum earnings guideline (C criteria). It has earned a very strong 98 Earnings Per Share (EPS) rating.
The Retail - Discount & Variety firm traded up as much as +269.5% since highlighted in yellow with a pivot point based on its 4/28/16 high plus 10 cents in 7/19/16 mid-day report (read here). OLLI completed its $16 IPO on 7/16/15. It completed a Secondary Offerings on 6/06/16 and 2/18/16.
The number of top-rated funds owning its shares rose from 98 in Sep '15 to 526 in Sep '18, a reassuring sign concerning the I criteria. Its current Up/Down Volume ratio of 1.0 is an unbiased indication its shares have been neutral concerning accumulation or distributional pressure over the past 50 days. The small supply of only 62.7 million shares outstanding (S criteria) can contribute to greater price volatility in the event of institutional buying or selling.
|
|
|
Color Codes Explained :
Y - Better candidates highlighted by our
staff of experts.
G - Previously featured
in past reports as yellow but may no longer be buyable under the
guidelines.
***Last / Change / Volume data in this table is the closing quote data***
Symbol/Exchange
Company Name
Industry Group |
PRICE |
CHANGE
(%Change) |
Day High |
Volume
(% DAV)
(% 50 day avg vol) |
52 Wk Hi
% From Hi |
Featured
Date |
Price
Featured |
Pivot Featured |
|
Max Buy |
MPX
-
NYSE
Marine Products Corp
AUTOMOTIVE - Recreational Vehicles
|
$22.65
|
-0.28
-1.22% |
$22.74
|
44,246
98.32% of 50 DAV
50 DAV is 45,000
|
$24.82
-8.74%
|
10/24/2018
|
$23.00
|
PP = $24.92
|
|
MB = $26.17
|
Most Recent Note - 11/13/2018 5:44:01 PM
Y - Encountered distributional pressure and finished lower today after challenging its 52-week high. Very little resistance remains due to overhead supply. Subsequent gains above the pivot point backed by at least +40% above average volume may trigger a technical buy signal. Recent low ($20.25 on 10/26/18) defines important support below its 50 DMA line. See the latest FSU analysis for more details and a new annotated graph.
>>> FEATURED STOCK ARTICLE : Perched Within Striking Distance of Pivot Point - 11/13/2018 |
View all notes |
Set NEW NOTE alert |
Company Profile |
SEC
News |
Chart |
Request a new note
C
A
S
I |
GMED
-
NYSE
Globus Medical Inc Cl A
CHEMICALS - Specialty Chemicals
|
$51.76
|
+0.26
0.50% |
$52.38
|
630,122
84.13% of 50 DAV
50 DAV is 749,000
|
$57.83
-10.50%
|
9/26/2018
|
$56.11
|
PP = $57.65
|
|
MB = $60.53
|
Most Recent Note - 11/14/2018 5:29:22 PM
G - Sank below its 200 DMA line ($51.67) near the prior low with lighter volume behind today's 4th consecutive loss, finishing -12.8% off its all-time high. The prior low ($49.34 on 10/08/18) defines important near term support.
>>> FEATURED STOCK ARTICLE : Consolidating -5.2% Off 52-Week High Ahead of Earnings News - 11/5/2018 |
View all notes |
Set NEW NOTE alert |
Company Profile |
SEC
News |
Chart |
Request a new note
C
A
S
I |
ZBRA
-
NASDAQ
Zebra Tech Corp Cl A
COMPUTER HARDWARE - Computer Peripherals
|
$180.70
|
+1.79
1.00% |
$183.46
|
674,116
148.16% of 50 DAV
50 DAV is 455,000
|
$184.75
-2.19%
|
11/6/2018
|
$170.41
|
PP = $179.57
|
|
MB = $188.55
|
Most Recent Note - 11/15/2018 6:06:01 PM
Y - Posted a big gain with above average volume today while rebounding near its pivot point. Disciplined investors are reminded to always follow strict buy and sell rules.
>>> FEATURED STOCK ARTICLE : Hit New High Following Another Strong Earnings Increase - 11/6/2018 |
View all notes |
Set NEW NOTE alert |
Company Profile |
SEC
News |
Chart |
Request a new note
C
A
S
I |
CME
-
NASDAQ
C M E Group Inc
DIVERSIFIED SERVICES - Business/Management Services
|
$195.61
|
+4.05
2.11% |
$196.17
|
2,149,261
115.80% of 50 DAV
50 DAV is 1,856,000
|
$191.64
2.07%
|
10/4/2018
|
$179.29
|
PP = $177.45
|
|
MB = $186.32
|
Most Recent Note - 11/13/2018 5:37:58 PM
G - Holding its ground near its all-time high after rising above its "max buy" level with an impressive streak of gains. Found support above its 50 DMA line ($178) after recently reporting earnings +22% on +2% sales revenues for the Sep '18 quarter, below the +25% minimum earnings guideline (C criteria), raising fundamental concerns. The 50 DMA line and prior low ($170.04 on 9/28/18) define important near-term support.
>>> FEATURED STOCK ARTICLE : Extended From Base After More Gain With Above Average Volume - 11/15/2018 |
View all notes |
Set NEW NOTE alert |
Company Profile |
SEC
News |
Chart |
Request a new note
C
A
S
I |
GDOT
-
NYSE
Green Dot Corp Cl A
FINANCIAL SERVICES - Credit Services
|
$84.81
|
+1.81
2.18% |
$85.49
|
993,481
226.82% of 50 DAV
50 DAV is 438,000
|
$93.00
-8.81%
|
11/8/2018
|
$90.35
|
PP = $91.61
|
|
MB = $96.19
|
 Most Recent Note - 11/16/2018 12:56:05 PM
Y - Color code is changed to yellow after rebounding above its 50 DMA line ($81.92) helping its outlook improve. In the Certification they teach that any stock which was previously sold can be bought again if strength returns.
>>> FEATURED STOCK ARTICLE : Volume Heavy Behind Rally to New High - 11/8/2018 |
View all notes |
Set NEW NOTE alert |
Company Profile |
SEC
News |
Chart |
Request a new note
C
A
S
I |
Symbol/Exchange
Company Name
Industry Group |
PRICE |
CHANGE
(%Change) |
Day High |
Volume
(% DAV)
(% 50 day avg vol) |
52 Wk Hi
% From Hi |
Featured
Date |
Price
Featured |
Pivot Featured |
|
Max Buy |
HZO
-
NYSE
Marinemax Inc
SPECIALTY RETAIL - Specialty Retail, Other
|
$22.87
|
-0.90
-3.79% |
$23.46
|
271,819
81.14% of 50 DAV
50 DAV is 335,000
|
$26.11
-12.41%
|
11/2/2018
|
$25.10
|
PP = $25.15
|
|
MB = $26.41
|
Most Recent Note - 11/16/2018 5:25:50 PM
Y - Volume totals have cooled but has slumped back into the prior base, raising concerns while completely negating the latest technical breakout. Fundamentals remain strong. Disciplined investors always limit losses by selling any stock that falls more than -7% from their purchase price.
>>> FEATURED STOCK ARTICLE : Boat Retailer Has Strong Earnings History - 11/2/2018 |
View all notes |
Set NEW NOTE alert |
Company Profile |
SEC
News |
Chart |
Request a new note
C
A
S
I |
ULTA
-
NASDAQ
Ulta Beauty Inc
SPECIALTY RETAIL - Specialty Retail, Other
|
$313.56
|
+1.75
0.56% |
$316.64
|
827,260
85.73% of 50 DAV
50 DAV is 965,000
|
$321.73
-2.54%
|
11/8/2018
|
$296.36
|
PP = $290.40
|
|
MB = $304.92
|
Most Recent Note - 11/14/2018 5:33:48 PM
G - Color code is changed to green after trading above its "max buy" level with recent gains and hitting a new all-time high today. Prior high ($290) defines initial support to watch on pullbacks.
>>> FEATURED STOCK ARTICLE : Volume Driven Gains Indicate Institutional Buying Demand - 11/9/2018 |
View all notes |
Set NEW NOTE alert |
Company Profile |
SEC
News |
Chart |
Request a new note
C
A
S
I |
UBNT
-
NASDAQ
Ubiquiti Networks Inc
TELECOMMUNICATIONS - Diversified Communication Serv
|
$111.43
|
-0.25
-0.22% |
$112.02
|
770,990
144.92% of 50 DAV
50 DAV is 532,000
|
$112.38
-0.85%
|
11/9/2018
|
$108.20
|
PP = $101.43
|
|
MB = $106.50
|
Most Recent Note - 11/14/2018 1:28:57 PM
G - Color code is changed to green while trading above its "max buy" level and near its all-time high. Disciplined investors avoid chasing stocks more than +5% above the pivot point. Prior high ($101.33 on 9/25/18) defines initial support to watch on pullbacks.
>>> FEATURED STOCK ARTICLE : Pullback Following Breakout Gain on After Latest Earnings Report - 11/12/2018 |
View all notes |
Set NEW NOTE alert |
Company Profile |
SEC
News |
Chart |
Request a new note
C
A
S
I |
DPZ
-
NYSE
Dominos Pizza Inc
Retail-Restaurants
|
$264.62
|
+5.00
1.93% |
$270.07
|
1,103,145
187.61% of 50 DAV
50 DAV is 588,000
|
$305.34
-13.34%
|
8/13/2018
|
$288.60
|
PP = $293.91
|
|
MB = $308.61
|
Most Recent Note - 11/15/2018 6:02:09 PM
G - Prior lows ($253) define important near-term support to watch while retesting its 200 DMA line ($259) with a loss today on higher (near average) volume. Met resistance at its 50 DMA line ($275), and a rebound above the 50 DMA line is needed for its outlook to improve. Fundamentals remain strong.
>>> FEATURED STOCK ARTICLE : Found Support at 200-Day Moving Average Line - 10/31/2018 |
View all notes |
Set NEW NOTE alert |
Company Profile |
SEC
News |
Chart |
Request a new note
C
A
S
I |
FIVE
-
NASDAQ
Five Below Inc
Retail-DiscountandVariety
|
$119.94
|
-0.92
-0.76% |
$120.69
|
611,960
63.55% of 50 DAV
50 DAV is 963,000
|
$136.13
-11.89%
|
7/6/2018
|
$98.90
|
PP = $104.09
|
|
MB = $109.29
|
Most Recent Note - 11/14/2018 5:24:30 PM
G - Consolidating above its 50 DMA line ($121.53). Faces some resistance due to overhead supply up to the $136 level. The recent low ($108.76 on 10/26/18) defines important near term support to watch on pullbacks. See the latest FSU analysis for more details and a new annotated graph.
>>> FEATURED STOCK ARTICLE : Consolidating Near 50-Day Moving Average After Finding Support - 11/14/2018 |
View all notes |
Set NEW NOTE alert |
Company Profile |
SEC
News |
Chart |
Request a new note
C
A
S
I |
Symbol/Exchange
Company Name
Industry Group |
PRICE |
CHANGE
(%Change) |
Day High |
Volume
(% DAV)
(% 50 day avg vol) |
52 Wk Hi
% From Hi |
Featured
Date |
Price
Featured |
Pivot Featured |
|
Max Buy |
HQY
-
NASDAQ
Healthequity Inc
COMPUTER SOFTWARE and SERVICES - Healthcare Information Service
|
$85.30
|
+0.75
0.89% |
$86.02
|
664,260
72.36% of 50 DAV
50 DAV is 918,000
|
$101.58
-16.03%
|
11/2/2018
|
$95.56
|
PP = $100.09
|
|
MB = $105.09
|
Most Recent Note - 11/14/2018 11:41:38 AM
G - Slumping abruptly after wedging to a new high last week. Prior low ($80.56 on 10/24/18) defines important near-term support. A rebound above the 50 DMA line is needed for its outlook to improve. Prior reports cautioned members - "A big gain on 11/07/18 was backed by only +20% above average volume. Subsequent gains above the pivot point backed by at least +40% above average volume may clinch a convincing new (or add on) technical buy signal."
>>> FEATURED STOCK ARTICLE : Rebound Above 50-Day Average Helped Outlook Improve - 11/1/2018 |
View all notes |
Set NEW NOTE alert |
Company Profile |
SEC
News |
Chart |
Request a new note
C
A
S
I |
OLLI
-
NASDAQ
Ollie's Bargain Outlet
Retail-DiscountandVariety
|
$90.70
|
+1.51
1.69% |
$90.83
|
811,055
123.83% of 50 DAV
50 DAV is 655,000
|
$97.61
-7.08%
|
11/16/2018
|
$90.70
|
PP = $97.71
|
|
MB = $102.60
|
Most Recent Note - 11/16/2018 5:22:32 PM
Y - Color code is changed to yellow after a gain today on higher volume led to a close near its 50 DMA line ($91.07). New pivot point cited is based on its 10/01/18 high plus 10 cents. Subsequent gains above the pivot point backed by at least +40% above average volume may trigger a new (or add-on) technical buy signal. The recent low ($84.66 on 10/11/18) defines the next important support to watch. Fundamentals remain strong. See the latest FSU analysis for more details and a new annotated graph.
>>> FEATURED STOCK ARTICLE : Consolidating Near 50-Day Average Forming New Base - 11/16/2018 |
View all notes |
Set NEW NOTE alert |
Company Profile |
SEC
News |
Chart |
Request a new note
C
A
S
I |
PLNT
-
NYSE
Planet Fitness Inc Cl A
Leisure-Services
|
$53.44
|
-0.32
-0.60% |
$54.28
|
1,067,951
82.40% of 50 DAV
50 DAV is 1,296,000
|
$57.66
-7.32%
|
11/7/2018
|
$57.10
|
PP = $55.45
|
|
MB = $58.22
|
Most Recent Note - 11/15/2018 6:08:49 PM
Y - Posted a 3rd consecutive gain today. Following a recent breakout it slumped back into the prior base with a damaging loss on 11/12/18 raising concerns. Its 50 DMA line ($49.95) defines important support.
>>> FEATURED STOCK ARTICLE : Big Gain for New High With Nearly 4 Times Average Volume - 11/7/2018 |
View all notes |
Set NEW NOTE alert |
Company Profile |
SEC
News |
Chart |
Request a new note
C
A
S
I |
|
|
|
THESE ARE NOT BUY RECOMMENDATIONS!
Comments contained in the body of this report are technical
opinions only. The material herein has been obtained
from sources believed to be reliable and accurate, however,
its accuracy and completeness cannot be guaranteed.
This site is not an investment advisor, hence it does
not endorse or recommend any securities or other investments.
Any recommendation contained in this report may not
be suitable for all investors and it is not to be deemed
an offer or solicitation on our part with respect to
the purchase or sale of any securities. All trademarks,
service marks and trade names appearing in this report
are the property of their respective owners, and are
likewise used for identification purposes only.
This report is a service available
only to active Paid Premium Members.
You may opt-out of receiving report notifications
at any time. Questions or comments may be submitted
by writing to Premium Membership Services 665 S.E. 10 Street, Suite 201 Deerfield Beach, FL 33441-5634 or by calling 1-800-965-8307
or 954-785-1121.
|
|
|