You are not logged in.
This means you
CAN ONLY VIEW reports that were published prior to Sunday, February 25, 2024.
You
MUST UPGRADE YOUR MEMBERSHIP if you want to see any current reports.
AFTER MARKET UPDATE - WEDNESDAY, NOVEMBER 14TH, 2018
Previous After Market Report Next After Market Report >>>
|
|
|
|
DOW |
-205.99 |
25,080.50 |
-0.81% |
|
Volume |
1,002,826,000 |
+5% |
|
Volume |
2,532,827,610 |
+9% |
|
NASDAQ |
-64.48 |
7,136.39 |
-0.90% |
|
Advancers |
1,199 |
40% |
|
Advancers |
1,055 |
34% |
|
S&P 500 |
-20.60 |
2,701.58 |
-0.76% |
|
Decliners |
1,802 |
60% |
|
Decliners |
2,027 |
66% |
|
Russell 2000 |
-12.30 |
1,502.51 |
-0.81% |
|
52 Wk Highs |
23 |
|
|
52 Wk Highs |
18 |
|
|
S&P 600 |
-7.19 |
946.15 |
-0.75% |
|
52 Wk Lows |
173 |
|
|
52 Wk Lows |
207 |
|
|
 |
Major Indices Suffer as Distributional Pressure Weighs on Stocks
Kenneth J. Gruneisen - Passed the CAN SLIM® Master's Exam
Stocks finished lower Wednesday. The Dow fell 205 points to 25,080, while the S&P 500 lost 20 points to 2,701. The Nasdaq Composite was down 64 points to 7,136. The volume totals reported were higher on the NYSE and on the Nasdaq exchange versus the prior session, indicative of distributional pressure. Decliners led advancers by a 3-2 margin on the NYSE and 2-1 on the Nasdaq exchange. There were 10 high-ranked companies from the Leaders List that made new 52-week highs and were listed on the BreakOuts Page, versus 10 on the prior session. New 52-week lows expanded again and easily outnumbered shrinking new 52-week highs totals on the NYSE and on the Nasdaq exchange. Technically, bullish action last week marked a shift in the market direction (M criteria) confirming a new uptrend, however, pressure returned as leadership has again grown thin. The Featured Stocks Page provides the most timely analysis on high-ranked leaders. Strict buying and selling rules should always be followed on a case by case basis. Charts used courtesy of www.stockcharts.com
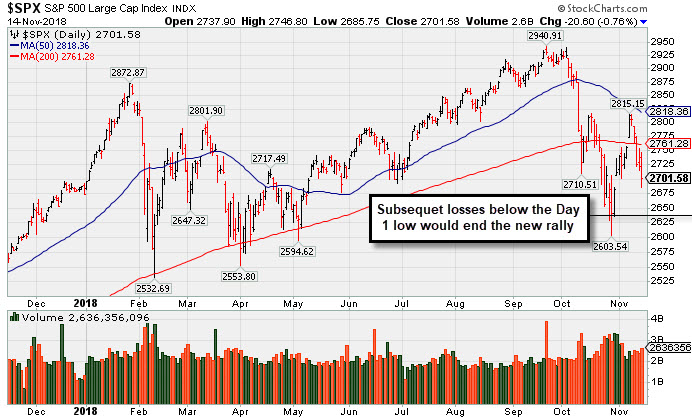
PICTURED: The S&P 500 Index finished lower for a 5th consecutive session, slumping further below its 200-day moving average (DMA) line and toward the prior low. The solid follow-through day on 11/07/18 was noted as a reassuring sign, however, subsequent losses undercutting the Day 1 lows would technically end the latest confirmed rally.
U.S. equities failed to sustain this morning’s positive momentum, with the S&P 500 slipping to its lowest point in two weeks. On the data front, an update on inflation showed consumer prices rose 0.3% in October. This marked the largest gain in nine months, though the uptick was largely due to rising gas prices. Core CPI (ex-food and energy) advanced 2.1% year-over-year last month, slightly below estimates of 2.2% but still above the Fed’s long-term target.
Nine of 11 S&P 500 sectors closed in negative territory. Financials led decliners with JP Morgan Chase & Co (JPM -2.06%) slumping and Goldman Sachs (GS -1.25%) falling to its worst level since November 2016. Tech stocks lagged, with the group on pace to fall nearly 4.5% on the week. Shares of Apple (AAPL -2.82%) continued to weigh on the market, dipping into bear market territory. Consumer Discretionary stocks erased earlier gains with Netflix (NFLX -2.61%) and Amazon (AMZN -1.97%).
Treasuries caught a perceived “safe haven” bid, with the yield on the benchmark 10-year note down two basis points to 3.12%. In commodities, WTI crude added 1.0% to $56.26/barrel, snapping longest losing streak on record. COMEX gold rose 0.9% to $1,212.10/ounce amid a weaker dollar. |
 Kenneth J. Gruneisen started out as a licensed stockbroker in August 1987, a couple of months prior to the historic stock market crash that took the Dow Jones Industrial Average down -22.6% in a single day. He has published daily fact-based fundamental and technical analysis on high-ranked stocks online for two decades. Through FACTBASEDINVESTING.COM, Kenneth provides educational articles, news, market commentary, and other information regarding proven investment systems that work in good times and bad.
Comments contained in the body of this report are technical opinions only and are not necessarily those of Gruneisen Growth Corp. The material herein has been obtained from sources believed to be reliable and accurate, however, its accuracy and completeness cannot be guaranteed. Our firm, employees, and customers may effect transactions, including transactions contrary to any recommendation herein, or have positions in the securities mentioned herein or options with respect thereto. Any recommendation contained in this report may not be suitable for all investors and it is not to be deemed an offer or solicitation on our part with respect to the purchase or sale of any securities. |
|
 |
Gold & Silver Index Rose Despite Widely Negative Market
Kenneth J. Gruneisen - Passed the CAN SLIM® Master's Exam
The Bank Index ($BKX -1.46%), Broker/Dealer Index ($XBD -1.08%), and the Retail Index ($RLX -1.39%) were unanimously lower. The Semiconductor Index ($SOX +0.36%) posted a small gain while the Biotech Index ($BTK -2.16%) slumped and the Networking Index ($NWX -0.40%) edged lower. The Oil Services Index ($OSX -0.10%) finished flat while Integrated Oil Index ($XOI +0.28%) edged higher and the Gold & Silver Index ($XAU +2.74%) was a standout gainer.
Charts courtesy of www.stockcharts.com
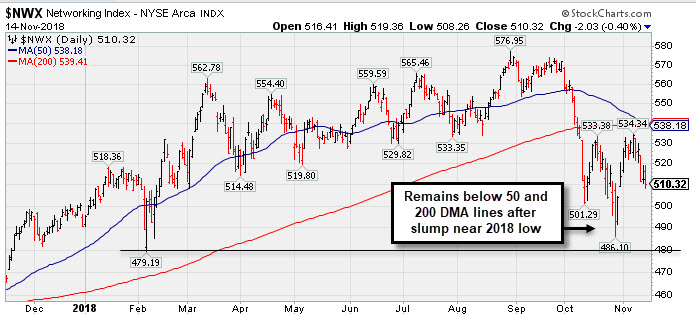 PICTURED: The Networking Index ($NWX -0.40%) edged lower. It remains below its 50-day and 200-day moving average (DMA) lines after recently slumping near its 2018 low.
| Oil Services |
$OSX |
109.04 |
-0.11 |
-0.10% |
-27.09% |
| Integrated Oil |
$XOI |
1,306.18 |
+3.65 |
+0.28% |
-2.20% |
| Semiconductor |
$SOX |
1,194.71 |
+4.34 |
+0.36% |
-4.66% |
| Networking |
$NWX |
510.32 |
-2.03 |
-0.40% |
+4.04% |
| Broker/Dealer |
$XBD |
259.99 |
-2.85 |
-1.08% |
-1.98% |
| Retail |
$RLX |
2,104.20 |
-29.65 |
-1.39% |
+21.37% |
| Gold & Silver |
$XAU |
63.53 |
+1.69 |
+2.73% |
-25.50% |
| Bank |
$BKX |
98.88 |
-1.47 |
-1.46% |
-7.34% |
| Biotech |
$BTK |
4,420.29 |
-97.39 |
-2.16% |
+4.69% |
|
|
|
 |
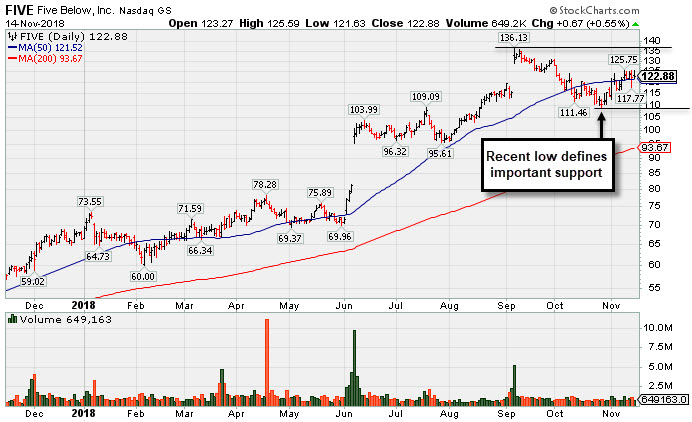
Consolidating Near 50-Day Moving Average After Finding Support
Kenneth J. Gruneisen - Passed the CAN SLIM® Master's Exam
Five Below Inc (FIVE +$0.67 or 0.55% to $122.88) posted another small gain today while consolidating above its 50-day moving average (DMA) line ($121.53). It still faces resistance due to overhead supply up to the $136 level. It found support near the prior high, but subsequent losses below the recent low ($108.76 on 10/26/18) would raise serious concerns.
Earnings rose +40% on +23% sales revenues for the Jul '18 quarter, continuing its strong earnings track record as 9 of the past 10 quarterly comparisons versus the year ago periods showed earnings increases above the +25% minimum guideline (C criteria). The Retail - Discount & Variety firm has a 98 Earnings Per Share Rating and matches the fact-based investment system's winning models with a good annual earnings (A criteria) track record.
Its current Up/Down Volume Ratio of 1.2 is an unbiased indication its shares have been under accumulation over the past 50 days. Its current Timeliness Rating is A and its Sponsorship Rating is B. FIVE was last shown in this FSU section on 10/25/18 with an annotated graph under the headline, "Sputtering Below 50-Day Moving Average Near Prior High". It traded up as much as +138% since highlighted in yellow with new pivot point cited based on its 5/19/17 high plus 10 cents in the 10/06/17 mid-day report (read here).
FIVE had a choppy history since its $17 IPO in July 2012 and 3 subsequent Secondary Offerings. It still has a small supply of 55.7 million shares outstanding (S criteria), which can lead to greater price volatility in the event of institutional buying or selling. The number of top-rated funds owning its shares rose from 465 in Sep '17 to 606 in Sep '18, a reassuring sign concerning the I criteria.
|
|
|
Color Codes Explained :
Y - Better candidates highlighted by our
staff of experts.
G - Previously featured
in past reports as yellow but may no longer be buyable under the
guidelines.
***Last / Change / Volume data in this table is the closing quote data***
Symbol/Exchange
Company Name
Industry Group |
PRICE |
CHANGE
(%Change) |
Day High |
Volume
(% DAV)
(% 50 day avg vol) |
52 Wk Hi
% From Hi |
Featured
Date |
Price
Featured |
Pivot Featured |
|
Max Buy |
MPX
-
NYSE
Marine Products Corp
AUTOMOTIVE - Recreational Vehicles
|
$22.78
|
+0.13
0.57% |
$23.50
|
35,257
78.35% of 50 DAV
50 DAV is 45,000
|
$24.82
-8.22%
|
10/24/2018
|
$23.00
|
PP = $24.92
|
|
MB = $26.17
|
Most Recent Note - 11/13/2018 5:44:01 PM
Y - Encountered distributional pressure and finished lower today after challenging its 52-week high. Very little resistance remains due to overhead supply. Subsequent gains above the pivot point backed by at least +40% above average volume may trigger a technical buy signal. Recent low ($20.25 on 10/26/18) defines important support below its 50 DMA line. See the latest FSU analysis for more details and a new annotated graph.
>>> FEATURED STOCK ARTICLE : Perched Within Striking Distance of Pivot Point - 11/13/2018 |
View all notes |
Set NEW NOTE alert |
Company Profile |
SEC
News |
Chart |
Request a new note
C
A
S
I |
GMED
-
NYSE
Globus Medical Inc Cl A
CHEMICALS - Specialty Chemicals
|
$50.44
|
-0.78
-1.52% |
$52.28
|
583,796
79.00% of 50 DAV
50 DAV is 739,000
|
$57.83
-12.78%
|
9/26/2018
|
$56.11
|
PP = $57.65
|
|
MB = $60.53
|
 Most Recent Note - 11/14/2018 5:29:22 PM
G - Sank below its 200 DMA line ($51.67) near the prior low with lighter volume behind today's 4th consecutive loss, finishing -12.8% off its all-time high. The prior low ($49.34 on 10/08/18) defines important near term support.
>>> FEATURED STOCK ARTICLE : Consolidating -5.2% Off 52-Week High Ahead of Earnings News - 11/5/2018 |
View all notes |
Set NEW NOTE alert |
Company Profile |
SEC
News |
Chart |
Request a new note
C
A
S
I |
ZBRA
-
NASDAQ
Zebra Tech Corp Cl A
COMPUTER HARDWARE - Computer Peripherals
|
$173.26
|
-3.61
-2.04% |
$179.51
|
329,831
74.79% of 50 DAV
50 DAV is 441,000
|
$184.75
-6.22%
|
11/6/2018
|
$170.41
|
PP = $179.57
|
|
MB = $188.55
|
Most Recent Note - 11/12/2018 6:50:41 PM
Y - Sputtered below the pivot point as it pulled back today for a 2nd small loss on lighter volume following 3 consecutive volume-driven gains. Disciplined investors are reminded to always follow strict buy and sell rules.
>>> FEATURED STOCK ARTICLE : Hit New High Following Another Strong Earnings Increase - 11/6/2018 |
View all notes |
Set NEW NOTE alert |
Company Profile |
SEC
News |
Chart |
Request a new note
C
A
S
I |
CME
-
NASDAQ
C M E Group Inc
DIVERSIFIED SERVICES - Business/Management Services
|
$188.06
|
+0.73
0.39% |
$190.21
|
2,152,354
119.71% of 50 DAV
50 DAV is 1,798,000
|
$190.43
-1.24%
|
10/4/2018
|
$179.29
|
PP = $177.45
|
|
MB = $186.32
|
Most Recent Note - 11/13/2018 5:37:58 PM
G - Holding its ground near its all-time high after rising above its "max buy" level with an impressive streak of gains. Found support above its 50 DMA line ($178) after recently reporting earnings +22% on +2% sales revenues for the Sep '18 quarter, below the +25% minimum earnings guideline (C criteria), raising fundamental concerns. The 50 DMA line and prior low ($170.04 on 9/28/18) define important near-term support.
>>> FEATURED STOCK ARTICLE : Perched Near High After Latest Earnings Report Below +25% Minimum - 10/26/2018 |
View all notes |
Set NEW NOTE alert |
Company Profile |
SEC
News |
Chart |
Request a new note
C
A
S
I |
GDOT
-
NYSE
Green Dot Corp Cl A
FINANCIAL SERVICES - Credit Services
|
$80.58
|
+1.43
1.81% |
$81.35
|
642,687
151.22% of 50 DAV
50 DAV is 425,000
|
$93.00
-13.35%
|
11/8/2018
|
$90.35
|
PP = $91.61
|
|
MB = $96.19
|
Most Recent Note - 11/12/2018 3:05:33 PM
G - Color code is changed to green with another big loss today undercutting its 50 DMA line ($82.18) after it abruptly reversed into the prior base with a big loss on Friday. Disciplined investors always limit losses by selling any stock that falls more than -7% from their purchase price.
>>> FEATURED STOCK ARTICLE : Volume Heavy Behind Rally to New High - 11/8/2018 |
View all notes |
Set NEW NOTE alert |
Company Profile |
SEC
News |
Chart |
Request a new note
C
A
S
I |
Symbol/Exchange
Company Name
Industry Group |
PRICE |
CHANGE
(%Change) |
Day High |
Volume
(% DAV)
(% 50 day avg vol) |
52 Wk Hi
% From Hi |
Featured
Date |
Price
Featured |
Pivot Featured |
|
Max Buy |
HZO
-
NYSE
Marinemax Inc
SPECIALTY RETAIL - Specialty Retail, Other
|
$24.06
|
+0.36
1.52% |
$24.55
|
226,892
68.34% of 50 DAV
50 DAV is 332,000
|
$26.11
-7.85%
|
11/2/2018
|
$25.10
|
PP = $25.15
|
|
MB = $26.41
|
Most Recent Note - 11/13/2018 5:40:34 PM
Y - Volume totals have cooled after slumping back into the prior base, raising concerns while completely negating the latest technical breakout. Fundamentals remain strong.
>>> FEATURED STOCK ARTICLE : Boat Retailer Has Strong Earnings History - 11/2/2018 |
View all notes |
Set NEW NOTE alert |
Company Profile |
SEC
News |
Chart |
Request a new note
C
A
S
I |
ULTA
-
NASDAQ
Ulta Beauty Inc
SPECIALTY RETAIL - Specialty Retail, Other
|
$313.13
|
-1.12
-0.36% |
$321.73
|
1,182,137
121.49% of 50 DAV
50 DAV is 973,000
|
$314.29
-0.37%
|
11/8/2018
|
$296.36
|
PP = $290.40
|
|
MB = $304.92
|
Most Recent Note - 11/14/2018 5:33:48 PM
G - Color code is changed to green after trading above its "max buy" level with recent gains and hitting a new all-time high today. Prior high ($290) defines initial support to watch on pullbacks.
>>> FEATURED STOCK ARTICLE : Volume Driven Gains Indicate Institutional Buying Demand - 11/9/2018 |
View all notes |
Set NEW NOTE alert |
Company Profile |
SEC
News |
Chart |
Request a new note
C
A
S
I |
UBNT
-
NASDAQ
Ubiquiti Networks Inc
TELECOMMUNICATIONS - Diversified Communication Serv
|
$108.42
|
+1.73
1.62% |
$110.47
|
726,435
139.16% of 50 DAV
50 DAV is 522,000
|
$112.38
-3.52%
|
11/9/2018
|
$108.20
|
PP = $101.43
|
|
MB = $106.50
|
Most Recent Note - 11/14/2018 1:28:57 PM
G - Color code is changed to green while trading above its "max buy" level and near its all-time high. Disciplined investors avoid chasing stocks more than +5% above the pivot point. Prior high ($101.33 on 9/25/18) defines initial support to watch on pullbacks.
>>> FEATURED STOCK ARTICLE : Pullback Following Breakout Gain on After Latest Earnings Report - 11/12/2018 |
View all notes |
Set NEW NOTE alert |
Company Profile |
SEC
News |
Chart |
Request a new note
C
A
S
I |
DPZ
-
NYSE
Dominos Pizza Inc
Retail-Restaurants
|
$266.12
|
+1.41
0.53% |
$270.72
|
392,094
66.23% of 50 DAV
50 DAV is 592,000
|
$305.34
-12.84%
|
8/13/2018
|
$288.60
|
PP = $293.91
|
|
MB = $308.61
|
Most Recent Note - 11/12/2018 6:53:56 PM
G - Met resistance at its 50 DMA line ($277), and a rebound above the 50 DMA line is needed for its outlook to improve. The 200 DMA line ($258) and prior lows ($253) define important near-term support to watch. Fundamentals remain strong.
>>> FEATURED STOCK ARTICLE : Found Support at 200-Day Moving Average Line - 10/31/2018 |
View all notes |
Set NEW NOTE alert |
Company Profile |
SEC
News |
Chart |
Request a new note
C
A
S
I |
FIVE
-
NASDAQ
Five Below Inc
Retail-DiscountandVariety
|
$122.88
|
+0.67
0.55% |
$125.59
|
653,465
64.89% of 50 DAV
50 DAV is 1,007,000
|
$136.13
-9.73%
|
7/6/2018
|
$98.90
|
PP = $104.09
|
|
MB = $109.29
|
Most Recent Note - 11/14/2018 5:24:30 PM
G - Consolidating above its 50 DMA line ($121.53). Faces some resistance due to overhead supply up to the $136 level. The recent low ($108.76 on 10/26/18) defines important near term support to watch on pullbacks. See the latest FSU analysis for more details and a new annotated graph.
>>> FEATURED STOCK ARTICLE : Consolidating Near 50-Day Moving Average After Finding Support - 11/14/2018 |
View all notes |
Set NEW NOTE alert |
Company Profile |
SEC
News |
Chart |
Request a new note
C
A
S
I |
Symbol/Exchange
Company Name
Industry Group |
PRICE |
CHANGE
(%Change) |
Day High |
Volume
(% DAV)
(% 50 day avg vol) |
52 Wk Hi
% From Hi |
Featured
Date |
Price
Featured |
Pivot Featured |
|
Max Buy |
HQY
-
NASDAQ
Healthequity Inc
COMPUTER SOFTWARE and SERVICES - Healthcare Information Service
|
$84.39
|
-4.60
-5.17% |
$90.20
|
1,362,365
149.06% of 50 DAV
50 DAV is 914,000
|
$101.58
-16.92%
|
11/2/2018
|
$95.56
|
PP = $100.09
|
|
MB = $105.09
|
Most Recent Note - 11/14/2018 11:41:38 AM
G - Slumping abruptly after wedging to a new high last week. Prior low ($80.56 on 10/24/18) defines important near-term support. A rebound above the 50 DMA line is needed for its outlook to improve. Prior reports cautioned members - "A big gain on 11/07/18 was backed by only +20% above average volume. Subsequent gains above the pivot point backed by at least +40% above average volume may clinch a convincing new (or add on) technical buy signal."
>>> FEATURED STOCK ARTICLE : Rebound Above 50-Day Average Helped Outlook Improve - 11/1/2018 |
View all notes |
Set NEW NOTE alert |
Company Profile |
SEC
News |
Chart |
Request a new note
C
A
S
I |
OLLI
-
NASDAQ
Ollie's Bargain Outlet
Retail-DiscountandVariety
|
$91.04
|
+0.28
0.31% |
$94.27
|
493,251
72.22% of 50 DAV
50 DAV is 683,000
|
$97.61
-6.73%
|
11/8/2018
|
$92.75
|
PP = $97.71
|
|
MB = $102.60
|
Most Recent Note - 11/14/2018 5:30:53 PM
Y - Traded higher but finished near the session low today. Consolidating near its 50 DMA line ($91.08). Color code was changed to yellow and a new pivot point is cited based on its 10/01/18 high plus 10 cents. Subsequent volume-driven gains above the pivot point may trigger a new (or add-on) technical buy signal. The recent low ($84.66 on 10/11/18) defines the next important support to watch. Fundamentals remain strong.
>>> FEATURED STOCK ARTICLE : Finding Support Near its 50-Day Moving Average - 10/30/2018 |
View all notes |
Set NEW NOTE alert |
Company Profile |
SEC
News |
Chart |
Request a new note
C
A
S
I |
PLNT
-
NYSE
Planet Fitness Inc Cl A
Leisure-Services
|
$52.55
|
+0.46
0.88% |
$53.81
|
1,280,229
100.49% of 50 DAV
50 DAV is 1,274,000
|
$57.66
-8.86%
|
11/7/2018
|
$57.10
|
PP = $55.45
|
|
MB = $58.22
|
Most Recent Note - 11/12/2018 12:53:13 PM
Y - Gapped down today and a big loss has it abruptly retreating below prior highs in the $53-55 area, raising concerns. Testing its 50 DMA line ($49.79) which defines important support.
>>> FEATURED STOCK ARTICLE : Big Gain for New High With Nearly 4 Times Average Volume - 11/7/2018 |
View all notes |
Set NEW NOTE alert |
Company Profile |
SEC
News |
Chart |
Request a new note
C
A
S
I |
|
|
|
THESE ARE NOT BUY RECOMMENDATIONS!
Comments contained in the body of this report are technical
opinions only. The material herein has been obtained
from sources believed to be reliable and accurate, however,
its accuracy and completeness cannot be guaranteed.
This site is not an investment advisor, hence it does
not endorse or recommend any securities or other investments.
Any recommendation contained in this report may not
be suitable for all investors and it is not to be deemed
an offer or solicitation on our part with respect to
the purchase or sale of any securities. All trademarks,
service marks and trade names appearing in this report
are the property of their respective owners, and are
likewise used for identification purposes only.
This report is a service available
only to active Paid Premium Members.
You may opt-out of receiving report notifications
at any time. Questions or comments may be submitted
by writing to Premium Membership Services 665 S.E. 10 Street, Suite 201 Deerfield Beach, FL 33441-5634 or by calling 1-800-965-8307
or 954-785-1121.
|
|
|