You are not logged in.
This means you
CAN ONLY VIEW reports that were published prior to Sunday, February 25, 2024.
You
MUST UPGRADE YOUR MEMBERSHIP if you want to see any current reports.
AFTER MARKET UPDATE - FRIDAY, NOVEMBER 13TH, 2020
Previous After Market Report Next After Market Report >>>
|
|
|
|
DOW |
+399.64 |
29,479.81 |
+1.37% |
|
Volume |
887,004,960 |
-15% |
|
Volume |
3,636,324,400 |
-5% |
|
NASDAQ |
+123.19 |
11,832.78 |
+1.05% |
|
Advancers |
2,491 |
83% |
|
Advancers |
2,535 |
74% |
|
S&P 500 |
+48.14 |
3,585.15 |
+1.36% |
|
Decliners |
521 |
17% |
|
Decliners |
898 |
26% |
|
Russell 2000 |
+35.57 |
1,744.04 |
+2.08% |
|
52 Wk Highs |
61 |
|
|
52 Wk Highs |
111 |
|
|
S&P 600 |
+25.79 |
994.29 |
+2.66% |
|
52 Wk Lows |
5 |
|
|
52 Wk Lows |
12 |
|
|
 |
Breadth Positive as Major Indices Rose With Lighter Volume Totals
Kenneth J. Gruneisen - Passed the CAN SLIM® Master's Exam
The Dow rose 399 points, outperforming its peers for the week with a 4.1% advance. The S&P 500 rallied 1.4%, closing at a new all-time high and climbing 2.2% for the week. Meanwhile, the Tech-heavy Nasdaq Composite advanced 1%, paring its weekly decline to 0.6%. The reported volume totals were ligher than the prior tsession on both the NYSE and the Nasdaq exchange, indicative of lackluster institutional buying demand. Breadth was positive as advancers led decliners by more than a 4-1 margin on the NYSE and by a 3-1 margin on the Nasdaq exchange. There were 22 high-ranked companies from the Leaders List that hit new 52-week highs and were listed on the BreakOuts Page, up from the total of 14 on the prior session. New 52-week highs expanded and easily outnumbered new 52-week lows totals. The major indices confirmed a new uptrend (M criteria) with recent follow-through gains backed by higher volume and more leadership. Investors are reminded to always make buying and selling decisions based based on the strict criteria and rules of the fact-based investment system. 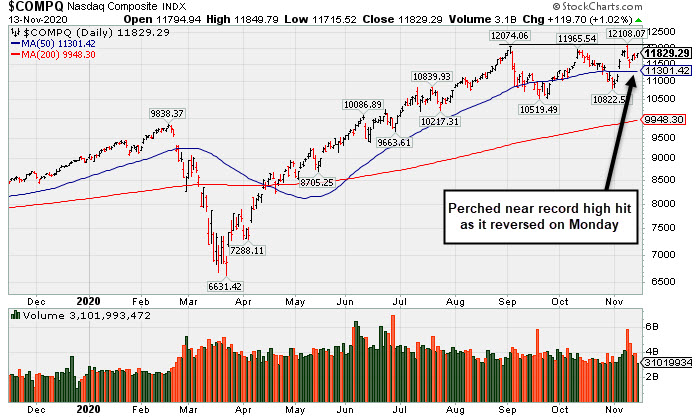 PICTURED: The Nasdaq Composite Index is consolidating with volume totals cooling after a "negative reversal" and loss with heavy volume on Monday when it touched a new record high.
Stocks finished firmly higher on Friday, as investors looked to cap a choppy week of trading on a positive note. Positive COVID vaccine data earlier in the week inspired a rotation out of growth-oriented stocks. Small-caps also extended their rally, with the Russell 2000 adding around 2% on the day and advancing roughly 6% for the week.
All 11 S&P 500 sectors ended in positive territory. The value- and cyclical-leaning sectors Energy, Real Estate and Industrials paced the gains, with each group adding more than 2%. In earnings, Walt Disney (DIS +2.10%) after posting a much smaller quarterly loss than analysts were expecting. Cisco Systems (CSCO +7.06%) jumped after topping Wall Street estimates on both the top and bottom line. Applied Materials (AMAT +4.31%) rose after besting profit projections and providing upbeat guidance.
On the data front, an update showed core producer prices increased 1.1% in October from the same period last year, slightly below estimates of 1.2%. A preliminary reading from the University of Michigan showed a gauge of consumer sentiment fell to 77 from the prior month’s 81.8 reading. Treasuries modestly declined, with the yield on the 10-year note up one basis point to 0.89%. In commodities, gold added 0.7% amid a weaker dollar. |
 Kenneth J. Gruneisen started out as a licensed stockbroker in August 1987, a couple of months prior to the historic stock market crash that took the Dow Jones Industrial Average down -22.6% in a single day. He has published daily fact-based fundamental and technical analysis on high-ranked stocks online for two decades. Through FACTBASEDINVESTING.COM, Kenneth provides educational articles, news, market commentary, and other information regarding proven investment systems that work in good times and bad.
Comments contained in the body of this report are technical opinions only and are not necessarily those of Gruneisen Growth Corp. The material herein has been obtained from sources believed to be reliable and accurate, however, its accuracy and completeness cannot be guaranteed. Our firm, employees, and customers may effect transactions, including transactions contrary to any recommendation herein, or have positions in the securities mentioned herein or options with respect thereto. Any recommendation contained in this report may not be suitable for all investors and it is not to be deemed an offer or solicitation on our part with respect to the purchase or sale of any securities. |
|
 |
Energy, Financial, Retail, and Tech Groups Rose
Kenneth J. Gruneisen - Passed the CAN SLIM® Master's Exam
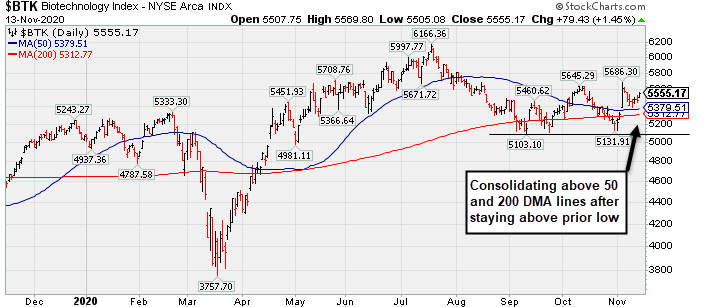
Financials had a positive influence on the major indices as the Bank Index ($BKX +2.21%) and Broker/Dealer Index ($XBD +1.67%) both posted solid gains. The Retail Index ($RLX +0.95%) also notched a gain. Energy-linked shares were strong as the Oil Services Index ($OSX +3.72%) and Integrated Oil Index ($XOI +4.11%) both posted standout gains while the Gold & Silver Index ($XAU +0.95%) posted a smaller gain. The tech sector had a positive bias as the Networking Index ($NWX +3.00%) outpaced the Semiconductor Index ($SOX +1.25%) and the Biotech Index ($BTK +1.45%).
PICTURED: The Biotech Index ($BTK +1.45%) is consolidating above the 50-day and 200-day moving average (DMA) lines after halting its slide above the September lows.
| Oil Services |
$OSX |
33.76 |
+1.21 |
+3.72% |
-56.88% |
| Integrated Oil |
$XOI |
691.10 |
+27.31 |
+4.11% |
-45.61% |
| Semiconductor |
$SOX |
2,509.36 |
+30.94 |
+1.25% |
+35.67% |
| Networking |
$NWX |
610.70 |
+17.77 |
+3.00% |
+4.68% |
| Broker/Dealer |
$XBD |
330.72 |
+5.44 |
+1.67% |
+13.89% |
| Retail |
$RLX |
3,441.20 |
+32.28 |
+0.95% |
+40.50% |
| Gold & Silver |
$XAU |
143.38 |
+1.35 |
+0.95% |
+34.10% |
| Bank |
$BKX |
87.53 |
+1.89 |
+2.21% |
-22.78% |
| Biotech |
$BTK |
5,555.17 |
+79.43 |
+1.45% |
+9.62% |
|
|
|
 |
Featured Stocks
Kenneth J. Gruneisen - Passed the CAN SLIM® Master's Exam
|
|
|
Color Codes Explained :
Y - Better candidates highlighted by our
staff of experts.
G - Previously featured
in past reports as yellow but may no longer be buyable under the
guidelines.
***Last / Change / Volume data in this table is the closing quote data***
Symbol/Exchange
Company Name
Industry Group |
PRICE |
CHANGE
(%Change) |
Day High |
Volume
(% DAV)
(% 50 day avg vol) |
52 Wk Hi
% From Hi |
Featured
Date |
Price
Featured |
Pivot Featured |
|
Max Buy |
 CRL
-
NYSE
CRL
-
NYSE
Charles River Labs Intl
DRUGS - Biotechnology
|
$239.01
|
+1.55
0.65% |
$240.17
|
264,505
74.09% of 50 DAV
50 DAV is 357,000
|
$257.88
-7.32%
|
7/15/2020
|
$192.66
|
PP = $189.95
|
|
MB = $199.45
|
Most Recent Note - 11/11/2020 5:58:04 PM
G - After a "negative reversal" at a new new all-time high it pulled back and tested support at an upward trendline and its 50 DMA line ($228) which again acted as support. More damaging losses would raise greater concerns and may trigger a worrisome technical sell signal. Reported Sep '20 quarterly earnings +38% on +11% sales revenues versus the year ago period, above the +25% minimum earnings guideline (C criteria).
>>> FEATURED STOCK ARTICLE : Earnings Due; Consolidating Near Prior High and Above 50 DMA Line - 10/27/2020 |
View all notes |
Set NEW NOTE alert |
Company Profile |
SEC
News |
Chart |
Request a new note
C
A
S
I |
AMD
-
NASDAQ
Advanced Micro Devices
ELECTRONICS - Semiconductor - Broad Line
|
$81.43
|
-0.41
-0.50% |
$83.11
|
30,405,750
56.20% of 50 DAV
50 DAV is 54,100,000
|
$94.28
-13.63%
|
8/31/2020
|
$90.42
|
PP = $87.39
|
|
MB = $91.76
|
Most Recent Note - 11/11/2020 5:56:21 PM
G - Rebounded back above its 50 DMA line ($80.71) with light volume behind today's big gain. Prior lows in the $73 area define important near term support. On 11/06 and 11/09 prior notes repeatedly cautioned members - "It has not formed a sound base pattern. Subsequent losses and deterioration below the recent low would raise greater concerns and trigger a more worrisome technical sell signal. Faces near-term resistance due to overhead supply up to the $94 level."
>>> FEATURED STOCK ARTICLE : Weak Action Raised Concern While Testing Recent Low - 11/3/2020 |
View all notes |
Set NEW NOTE alert |
Company Profile |
SEC
News |
Chart |
Request a new note
C
A
S
I |
TER
-
NASDAQ
Teradyne Inc
ELECTRONICS - Semiconductor Equipment and Mate
|
$102.29
|
+1.81
1.80% |
$103.20
|
1,040,863
43.28% of 50 DAV
50 DAV is 2,405,000
|
$105.62
-3.15%
|
10/21/2020
|
$92.22
|
PP = $93.54
|
|
MB = $98.22
|
Most Recent Note - 11/11/2020 5:52:44 PM
G - Posted a gain today with light volume for its second best ever close. Reported earnings +53% on +41% sales revenues for the Sep '20 quarter versus the year ago period, its 4th consecutive quarterly comparison with earnings above the +25% minimum earnings guideline (C criteria). Sequential comparisons show encouraging acceleration in its sales revenues growth rate. Its annual earnings (A criteria) history has been strong. See the latest FSU analysis for more details and a new annotated graph.
>>> FEATURED STOCK ARTICLE : Recent Gains for New Highs Lacked Great Volume Conviction - 11/11/2020 |
View all notes |
Set NEW NOTE alert |
Company Profile |
SEC
News |
Chart |
Request a new note
C
A
S
I |
TREX
-
NYSE
Trex Company Inc
MATERIALS and CONSTRUCTION - General Building Materials
|
$72.33
|
+3.27
4.74% |
$73.60
|
1,078,157
127.29% of 50 DAV
50 DAV is 847,000
|
$81.23
-10.96%
|
6/26/2020
|
$54.53
|
PP = $66.47
|
|
MB = $69.79
|
 Most Recent Note - 11/13/2020 5:48:04 PM
G - Rebounded near its 50 DMA line ($72.51) with today's gain. Found support when testing the prior low ($63.32 on 9/21/20). Recently noted that it reported Sep '20 quarterly earnings +14% on +19% sales revenues versus the year ago period, below the +25% minimum guideline (C criteria) raising fundamental concerns.
>>> FEATURED STOCK ARTICLE : Rebound Above 50-Day Moving Average Helped Technical Stance - 11/4/2020 |
View all notes |
Set NEW NOTE alert |
Company Profile |
SEC
News |
Chart |
Request a new note
C
A
S
I |
LGIH
-
NASDAQ
L G I Homes Inc
Bldg-Resident/Comml
|
$111.92
|
+1.61
1.46% |
$115.00
|
241,802
89.89% of 50 DAV
50 DAV is 269,000
|
$132.98
-15.84%
|
10/1/2020
|
$123.17
|
PP = $124.04
|
|
MB = $130.24
|
Most Recent Note - 11/10/2020 6:03:59 PM
G - Rebounded toward its 50 DMA line ($116) which may act as resistance after a damaging volume-driven loss on the prior session. A rebound above the 50 DMA line is needed for its outlook to improve. Reported Sep '20 quarterly earnings +27% on +11% sales revenues versus the year ago period. See the latest FSU analysis for more details and a new annotated graph.
>>> FEATURED STOCK ARTICLE : Rebound Toward 50-Day Average Which May Act as Resistance - 11/10/2020 |
View all notes |
Set NEW NOTE alert |
Company Profile |
SEC
News |
Chart |
Request a new note
C
A
S
I |
Symbol/Exchange
Company Name
Industry Group |
PRICE |
CHANGE
(%Change) |
Day High |
Volume
(% DAV)
(% 50 day avg vol) |
52 Wk Hi
% From Hi |
Featured
Date |
Price
Featured |
Pivot Featured |
|
Max Buy |
NOW
-
NYSE
Servicenow Inc
Computer Sftwr-Enterprse
|
$508.01
|
-1.77
-0.35% |
$511.60
|
1,235,075
90.75% of 50 DAV
50 DAV is 1,361,000
|
$537.53
-5.49%
|
8/20/2020
|
$453.34
|
PP = $454.79
|
|
MB = $477.53
|
Most Recent Note - 11/11/2020 12:33:45 PM
G - Promptly rebounding above its 50 DMA line ($489) with today's gap up gain following 2 consecutive big volume-driven losses off of its all-time high. Tested the prior low ($472 on 11/03/20) noted as important support where a damaging violation raises greater concerns. Recently reported Sep '20 quarterly earnings +22% on +30% sales revenues versus the year ago period, below the +25% minimum guideline (C criteria) of the fact-based investment system.
>>> FEATURED STOCK ARTICLE : Found Prompt Support at 50 DMA Line After Earnings News - 10/29/2020 |
View all notes |
Set NEW NOTE alert |
Company Profile |
SEC
News |
Chart |
Request a new note
C
A
S
I |
VEEV
-
NYSE
Veeva Systems Inc Cl A
Computer Sftwr-Medical
|
$264.92
|
-9.15
-3.34% |
$275.84
|
1,101,106
136.61% of 50 DAV
50 DAV is 806,000
|
$313.99
-15.63%
|
10/6/2020
|
$287.71
|
PP = $298.86
|
|
MB = $313.80
|
Most Recent Note - 11/13/2020 5:49:42 PM
G - Slumped today with higher volume indicative of more damaging distributional pressure after volume-driven losses violating its 50 DMA line ($281.84) and undercutting the prior low ($263). Only a prompt rebound above the 50 DMA line would help its outlook improve.
>>> FEATURED STOCK ARTICLE : Recently Slumped Back Below Prior Highs - 10/26/2020 |
View all notes |
Set NEW NOTE alert |
Company Profile |
SEC
News |
Chart |
Request a new note
C
A
S
I |
ALRM
-
NASDAQ
Alarm.com Holdings Inc
Security/Sfty
|
$70.02
|
-0.53
-0.75% |
$71.11
|
328,940
93.45% of 50 DAV
50 DAV is 352,000
|
$79.38
-11.79%
|
11/6/2020
|
$71.88
|
PP = $74.76
|
|
MB = $78.50
|
Most Recent Note - 11/10/2020 6:08:48 PM
Y - Suffered a loss today with above average volume breaking a streak of 6 consecutive gains. After reaching a new all-time high it has been encountering distributional pressure. See the latest FSU analysis for more details and an annotated graph. Previously noted - "Subsequent gains above the pivot point may help clinch a convincing technical buy signal. Reported earnings +32% on +24% sales revenues for the Sep '20 quarter versus the year ago period, an improvement after +3% earnings in the Jun quarter. Prior quarterly comparisons were near or above the +25% minimum earnings guideline (C criteria). Annual earnings (A criteria) growth has been strong, a good match with the fact-based investment system."
>>> FEATURED STOCK ARTICLE : Encountered Distributional Pressure as it Hit a New High - 11/9/2020 |
View all notes |
Set NEW NOTE alert |
Company Profile |
SEC
News |
Chart |
Request a new note
C
A
S
I |
TEAM
-
NASDAQ
Atlassian Corp Plc Cl A
Comp Sftwr-Spec Enterprs
|
$192.82
|
-0.18
-0.09% |
$194.82
|
1,795,014
104.48% of 50 DAV
50 DAV is 1,718,000
|
$216.30
-10.86%
|
10/12/2020
|
$193.77
|
PP = $199.60
|
|
MB = $209.58
|
Most Recent Note - 11/11/2020 5:54:54 PM
G - Rebounded back above its 50 DMA line ($188) with today's gain on average volume after undercutting the prior low ($180) and finding prompt support. Reported earnings +7% on +26% sales revenues for the Sep '20 quarter versus the year ago period, well below the +25% minimum earnings guideline (C criteria), raising concerns.
>>> FEATURED STOCK ARTICLE : Weak Technical Action Followed Disappointing Fundamental News - 11/2/2020 |
View all notes |
Set NEW NOTE alert |
Company Profile |
SEC
News |
Chart |
Request a new note
C
A
S
I |
YETI
-
NYSE
Yeti Holdings Inc
Leisure-Products
|
$57.13
|
+1.48
2.66% |
$58.42
|
1,486,143
116.93% of 50 DAV
50 DAV is 1,271,000
|
$62.72
-8.91%
|
11/5/2020
|
$57.25
|
PP = $55.14
|
|
MB = $57.90
|
Most Recent Note - 11/13/2020 5:51:08 PM
Y - Rebounded impressively after an abrupt pulllback. Its 50 DMA line ($50.02) defines near-term support above prior lows
>>> FEATURED STOCK ARTICLE : Finished Strong After Breakout Gain Was Noted in Mid-Day Report - 11/5/2020 |
View all notes |
Set NEW NOTE alert |
Company Profile |
SEC
News |
Chart |
Request a new note
C
A
S
I |
Symbol/Exchange
Company Name
Industry Group |
PRICE |
CHANGE
(%Change) |
Day High |
Volume
(% DAV)
(% 50 day avg vol) |
52 Wk Hi
% From Hi |
Featured
Date |
Price
Featured |
Pivot Featured |
|
Max Buy |
AAXN
-
NASDAQ
Axon Enterprise Inc
Security/Sfty
|
$120.98
|
+2.83
2.40% |
$121.20
|
421,107
69.03% of 50 DAV
50 DAV is 610,000
|
$128.39
-5.77%
|
11/6/2020
|
$122.75
|
PP = $113.00
|
|
MB = $118.65
|
Most Recent Note - 11/10/2020 6:06:43 PM
G - Pulled back with above average volume today after a streak of 5 consecutive gains helped it hit new all-time highs. Bullish action came after reporting Sep '20 quarterly earnings +43% on +27% sales revenues versus the year ago period. It broke out of a cup-with-high-handle base with volume drying up during the handle.
>>> FEATURED STOCK ARTICLE : Breakaway Gap From Cup-With-High-Handle Pattern - 11/6/2020 |
View all notes |
Set NEW NOTE alert |
Company Profile |
SEC
News |
Chart |
Request a new note
C
A
S
I |
QTWO
-
NYSE
Q2 Holdings Inc
Computer Sftwr-Financial
|
$104.59
|
-0.41
-0.39% |
$105.74
|
429,184
108.11% of 50 DAV
50 DAV is 397,000
|
$109.27
-4.28%
|
11/12/2020
|
$105.14
|
PP = $106.54
|
|
MB = $111.87
|
Most Recent Note - 11/13/2020 12:29:43 PM
Y - Pulling back today yet still hovering near its high. Encountered distributional pressure on the prior sessoion as it churned heavy volme and ended lower after highlighted in yellow with new pivot point cited based on its 8/06/20 high plus 10 cents. Subsequent confirming gains above the pivot point backed by at least +40% above average volume may help clinch a convincing technical buy signal. Showed great earning increases with strong underlying sales revenues growth for the Jun and Sep '20 quarters versus the year ago periods. Annual earnings growth has been strong. Completed new Public Offerings on 6/06/19 and 5/13/20. See the latest FSU analysis for more details and an annotated graph.
>>> FEATURED STOCK ARTICLE : Churning Action Near Prior High Indicative of Distributional Pressure - 11/12/2020 |
View all notes |
Set NEW NOTE alert |
Company Profile |
SEC
News |
Chart |
Request a new note
C
A
S
I |
|
|
|
THESE ARE NOT BUY RECOMMENDATIONS!
Comments contained in the body of this report are technical
opinions only. The material herein has been obtained
from sources believed to be reliable and accurate, however,
its accuracy and completeness cannot be guaranteed.
This site is not an investment advisor, hence it does
not endorse or recommend any securities or other investments.
Any recommendation contained in this report may not
be suitable for all investors and it is not to be deemed
an offer or solicitation on our part with respect to
the purchase or sale of any securities. All trademarks,
service marks and trade names appearing in this report
are the property of their respective owners, and are
likewise used for identification purposes only.
This report is a service available
only to active Paid Premium Members.
You may opt-out of receiving report notifications
at any time. Questions or comments may be submitted
by writing to Premium Membership Services 665 S.E. 10 Street, Suite 201 Deerfield Beach, FL 33441-5634 or by calling 1-800-965-8307
or 954-785-1121.
|
|
|