You are not logged in.
This means you
CAN ONLY VIEW reports that were published prior to Monday, February 19, 2024.
You
MUST UPGRADE YOUR MEMBERSHIP if you want to see any current reports.
AFTER MARKET UPDATE - TUESDAY, NOVEMBER 13TH, 2018
Previous After Market Report Next After Market Report >>>
|
|
|
|
DOW |
-100.69 |
25,286.49 |
-0.40% |
|
Volume |
951,886,370 |
+11% |
|
Volume |
2,333,283,800 |
+2% |
|
NASDAQ |
+0.00 |
7,200.87 |
+0.00% |
|
Advancers |
1,447 |
48% |
|
Advancers |
1,492 |
49% |
|
S&P 500 |
-4.04 |
2,722.18 |
-0.15% |
|
Decliners |
1,552 |
52% |
|
Decliners |
1,563 |
51% |
|
Russell 2000 |
-3.99 |
1,514.80 |
-0.26% |
|
52 Wk Highs |
28 |
|
|
52 Wk Highs |
20 |
|
|
S&P 600 |
-1.74 |
953.34 |
-0.18% |
|
52 Wk Lows |
151 |
|
|
52 Wk Lows |
176 |
|
|
 |
Major Indices Sputtered With Thinning Leadership
Kenneth J. Gruneisen - Passed the CAN SLIM® Master's Exam
Stocks finished lower Tuesday. The Dow fell 100 points to 25,286, while the S&P 500 slipped 4 points to 2,722. The Nasdaq Composite was unchanged at 7,200. The volume totals reported were higher on the NYSE and on the Nasdaq exchange versus the prior session. Decliners narrowly led advancers on the NYSE and on the Nasdaq exchange. There were 10 high-ranked companies from the Leaders List that made new 52-week highs and were listed on the BreakOuts Page, versus 23 on the prior session. New 52-week lows easiily outnumbered shrinking new 52-week highs totals on the NYSE and on the Nasdaq exchange. Technically, bullish action last week marked a shift in the market direction (M criteria) confirming a new uptrend, however, pressure returned as leadership has again grown thin. The Featured Stocks Page provides the most timely analysis on high-ranked leaders. Strict buying and selling rules should always be followed on a case by case basis. Charts used courtesy of www.stockcharts.com
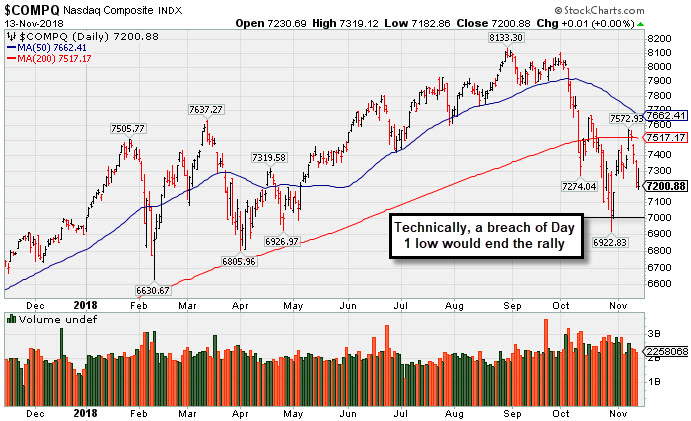
PICTURED: The Nasdaq Composite Index finished flat on Tuesday. It met prompt resistance near its 200-day moving average (DMA) line and has slumped toward the prior low. The solid follow-through day on 11/07/18 was noted as a reassuring sign, however, subsequent losses undercutting the Day 1 lows would technically end the latest confirmed rally.
The major averages toggled between gains and losses during a choppy session as weakness in the Energy sector offset positive trade updates. Oil prices extended their longest losing streak on record, as WTI crude tumbled an additional -8.1% to $55.06/barrel. The sharp decline marked the worst daily performance for WTI crude since 2015 and the lowest closing price of the year. In geopolitics, U.S. and Chinese officials confirmed they have reengaged in high level trade discussions. On the data front, the lone update showed small business optimism unexpectedly eased slightly from the prior month, but remains near all-time highs.
Energy shares weighed on the major averages today as the sell-off in oil caused the group to fall roughly 2.4% on the session. Healthcare and Consumer Staples also underperformed as both groups saw a flurry of analyst downgrades. Technology stocks finished marginally higher as a strong rebound in the semi-conductor space helped offset continued weakness in Apple (AAPL -1.00%) which fell to a close below its 200 DMA line. In earnings, Home Depot (HD -0.24%) fell despite topping analyst profit projections and raising forward guidance.
Treasuries were stronger, as the yield on the benchmark 10-year note slipped four basis points to 3.14%. In commodities, COMEX gold declined 0.1% $1,201.90/ounce despite a weaker dollar. |
 Kenneth J. Gruneisen started out as a licensed stockbroker in August 1987, a couple of months prior to the historic stock market crash that took the Dow Jones Industrial Average down -22.6% in a single day. He has published daily fact-based fundamental and technical analysis on high-ranked stocks online for two decades. Through FACTBASEDINVESTING.COM, Kenneth provides educational articles, news, market commentary, and other information regarding proven investment systems that work in good times and bad.
Comments contained in the body of this report are technical opinions only and are not necessarily those of Gruneisen Growth Corp. The material herein has been obtained from sources believed to be reliable and accurate, however, its accuracy and completeness cannot be guaranteed. Our firm, employees, and customers may effect transactions, including transactions contrary to any recommendation herein, or have positions in the securities mentioned herein or options with respect thereto. Any recommendation contained in this report may not be suitable for all investors and it is not to be deemed an offer or solicitation on our part with respect to the purchase or sale of any securities. |
|
 |
Semiconductor and Bank Indexes Rose; Energy Groups Fell
Kenneth J. Gruneisen - Passed the CAN SLIM® Master's Exam
The Bank Index ($BKX +0.68%) rose while the Broker/Dealer Index ($XBD +0.04%) finished flat and the Retail Index ($RLX -0.22%) edged lower. The Semiconductor Index ($SOX +1.35%) posted a solid gain while the Biotech Index ($BTK +0.05%) and the Networking Index ($NWX +0.10%) both finished flat. The Oil Services Index ($OSX -4.34%) and Integrated Oil Index ($XOI -2.58%) both were standout decliners and the Gold & Silver Index ($XAU -1.30%) also finished lower.
Charts courtesy of www.stockcharts.com
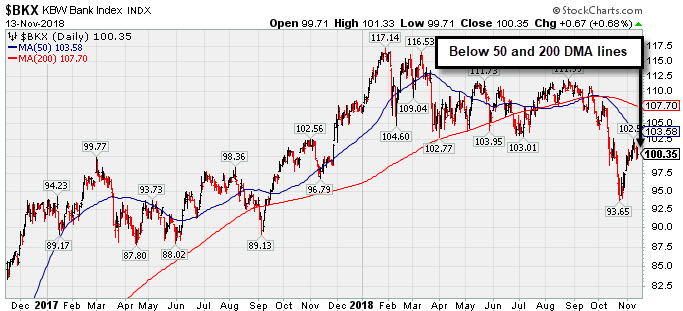 PICTURED: The Bank Index ($BKX +0.68%) posted a gain on Tuesday, but it remains below its 50-day and 200-day moving average (DMA) lines.
| Oil Services |
$OSX |
109.15 |
-4.96 |
-4.35% |
-27.01% |
| Integrated Oil |
$XOI |
1,302.53 |
-34.47 |
-2.58% |
-2.47% |
| Semiconductor |
$SOX |
1,190.37 |
+15.88 |
+1.35% |
-5.00% |
| Networking |
$NWX |
512.36 |
+0.53 |
+0.10% |
+4.45% |
| Broker/Dealer |
$XBD |
262.84 |
+0.11 |
+0.04% |
-0.91% |
| Retail |
$RLX |
2,133.85 |
-4.78 |
-0.22% |
+23.08% |
| Gold & Silver |
$XAU |
61.84 |
-0.81 |
-1.29% |
-27.48% |
| Bank |
$BKX |
100.35 |
+0.67 |
+0.67% |
-5.96% |
| Biotech |
$BTK |
4,517.68 |
+2.47 |
+0.05% |
+7.00% |
|
|
|
 |
Perched Within Striking Distance of Pivot Point
Kenneth J. Gruneisen - Passed the CAN SLIM® Master's Exam
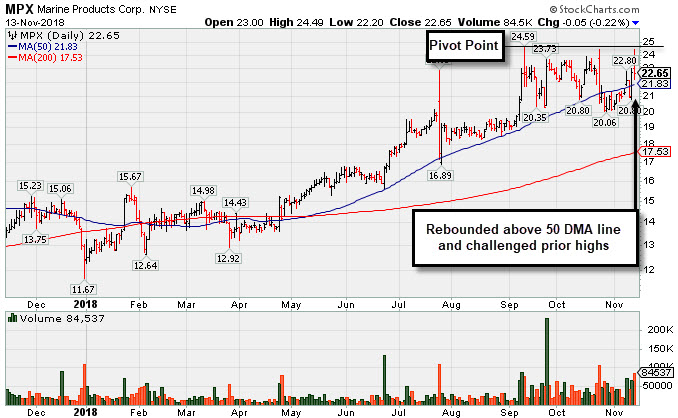
Marine Products Corp (MPX -$0.05 or -0.22% to $22.65) challenged its 52-week high but ended lower today. Recent gains were backed by above average volume. Its color code was changed to yellow after rebounding above its 50-day moving average (DMA) line ($21.83) with volume-driven gains. Very little resistance remains due to overhead supply. Subsequent gains above the pivot point backed by at least +40% above average volume may trigger a technical buy signal.
MPX was highlighted in yellow with pivot point cited based on its 9/12/18 high plus 10 cents in the 10/24/18 mid-day report (read here). Recently it reported earnings +62% on +22% sales revenues for the Sep '18 quarter, so the past 4 quarterly comparisons were above the +25% minimum earnings guideline (C criteria). Its annual earnings history (A criteria) has been strong and steady, helping it earn the highest possible 99 Earnings Per Share Rating.
The number of top-rated funds owning its shares rose from 126 in Mar '18 to 138 in Sep '18, a reassuring sign concerning the I criteria. It has an A Timeliness Rating and a C Sponsorship Rating. Its small supply of only 7.3 million shares (S criteria) in the public float can contribute to greater price volatility in the event of institutional buying or selling.
Charts courtesy of www.stockcharts.com
 |
|
|
Color Codes Explained :
Y - Better candidates highlighted by our
staff of experts.
G - Previously featured
in past reports as yellow but may no longer be buyable under the
guidelines.
***Last / Change / Volume data in this table is the closing quote data***
Symbol/Exchange
Company Name
Industry Group |
PRICE |
CHANGE
(%Change) |
Day High |
Volume
(% DAV)
(% 50 day avg vol) |
52 Wk Hi
% From Hi |
Featured
Date |
Price
Featured |
Pivot Featured |
|
Max Buy |
MPX
-
NYSE
Marine Products Corp
AUTOMOTIVE - Recreational Vehicles
|
$22.65
|
-0.05
-0.22% |
$24.49
|
84,537
196.60% of 50 DAV
50 DAV is 43,000
|
$24.82
-8.74%
|
10/24/2018
|
$23.00
|
PP = $24.92
|
|
MB = $26.17
|
 Most Recent Note - 11/13/2018 5:44:01 PM
Y - Encountered distributional pressure and finished lower today after challenging its 52-week high. Very little resistance remains due to overhead supply. Subsequent gains above the pivot point backed by at least +40% above average volume may trigger a technical buy signal. Recent low ($20.25 on 10/26/18) defines important support below its 50 DMA line. See the latest FSU analysis for more details and a new annotated graph.
>>> FEATURED STOCK ARTICLE : Perched Within Striking Distance of Pivot Point - 11/13/2018 |
View all notes |
Set NEW NOTE alert |
Company Profile |
SEC
News |
Chart |
Request a new note
C
A
S
I |
GMED
-
NYSE
Globus Medical Inc Cl A
CHEMICALS - Specialty Chemicals
|
$51.22
|
-0.39
-0.76% |
$52.10
|
665,556
91.05% of 50 DAV
50 DAV is 731,000
|
$57.83
-11.43%
|
9/26/2018
|
$56.11
|
PP = $57.65
|
|
MB = $60.53
|
Most Recent Note - 11/9/2018 1:13:41 PM
G - Reported earnings +30% on +12% sales revenues for the Sep '18 quarter. Gapped down and abruptly retreated below its 50 and 200 DMA lines with today's big loss triggering a technical sell signal and its color code is changed to green. Disciplined investors note it did not trigger a technical buy signal after previously noted - "Volume and volatility often increase near earnings news. Its 50 DMA line ($53.26) and 200 DMA line ($51.52) define near-term support. Subsequent gains above the pivot point backed by more than +40% above average volume are needed to trigger a proper technical buy signal."
>>> FEATURED STOCK ARTICLE : Consolidating -5.2% Off 52-Week High Ahead of Earnings News - 11/5/2018 |
View all notes |
Set NEW NOTE alert |
Company Profile |
SEC
News |
Chart |
Request a new note
C
A
S
I |
ZBRA
-
NASDAQ
Zebra Tech Corp Cl A
COMPUTER HARDWARE - Computer Peripherals
|
$176.87
|
-0.56
-0.32% |
$180.54
|
432,265
99.14% of 50 DAV
50 DAV is 436,000
|
$184.75
-4.27%
|
11/6/2018
|
$170.41
|
PP = $179.57
|
|
MB = $188.55
|
Most Recent Note - 11/12/2018 6:50:41 PM
Y - Sputtered below the pivot point as it pulled back today for a 2nd small loss on lighter volume following 3 consecutive volume-driven gains. Disciplined investors are reminded to always follow strict buy and sell rules.
>>> FEATURED STOCK ARTICLE : Hit New High Following Another Strong Earnings Increase - 11/6/2018 |
View all notes |
Set NEW NOTE alert |
Company Profile |
SEC
News |
Chart |
Request a new note
C
A
S
I |
CME
-
NASDAQ
C M E Group Inc
DIVERSIFIED SERVICES - Business/Management Services
|
$187.33
|
+0.88
0.47% |
$187.89
|
2,038,177
114.57% of 50 DAV
50 DAV is 1,779,000
|
$190.43
-1.63%
|
10/4/2018
|
$179.29
|
PP = $177.45
|
|
MB = $186.32
|
Most Recent Note - 11/13/2018 5:37:58 PM
G - Holding its ground near its all-time high after rising above its "max buy" level with an impressive streak of gains. Found support above its 50 DMA line ($178) after recently reporting earnings +22% on +2% sales revenues for the Sep '18 quarter, below the +25% minimum earnings guideline (C criteria), raising fundamental concerns. The 50 DMA line and prior low ($170.04 on 9/28/18) define important near-term support.
>>> FEATURED STOCK ARTICLE : Perched Near High After Latest Earnings Report Below +25% Minimum - 10/26/2018 |
View all notes |
Set NEW NOTE alert |
Company Profile |
SEC
News |
Chart |
Request a new note
C
A
S
I |
GDOT
-
NYSE
Green Dot Corp Cl A
FINANCIAL SERVICES - Credit Services
|
$79.15
|
-0.62
-0.78% |
$80.81
|
429,035
101.91% of 50 DAV
50 DAV is 421,000
|
$93.00
-14.89%
|
11/8/2018
|
$90.35
|
PP = $91.61
|
|
MB = $96.19
|
Most Recent Note - 11/12/2018 3:05:33 PM
G - Color code is changed to green with another big loss today undercutting its 50 DMA line ($82.18) after it abruptly reversed into the prior base with a big loss on Friday. Disciplined investors always limit losses by selling any stock that falls more than -7% from their purchase price.
>>> FEATURED STOCK ARTICLE : Volume Heavy Behind Rally to New High - 11/8/2018 |
View all notes |
Set NEW NOTE alert |
Company Profile |
SEC
News |
Chart |
Request a new note
C
A
S
I |
Symbol/Exchange
Company Name
Industry Group |
PRICE |
CHANGE
(%Change) |
Day High |
Volume
(% DAV)
(% 50 day avg vol) |
52 Wk Hi
% From Hi |
Featured
Date |
Price
Featured |
Pivot Featured |
|
Max Buy |
HZO
-
NYSE
Marinemax Inc
SPECIALTY RETAIL - Specialty Retail, Other
|
$23.70
|
-0.44
-1.82% |
$24.37
|
283,527
85.40% of 50 DAV
50 DAV is 332,000
|
$26.11
-9.23%
|
11/2/2018
|
$25.10
|
PP = $25.15
|
|
MB = $26.41
|
Most Recent Note - 11/13/2018 5:40:34 PM
Y - Volume totals have cooled after slumping back into the prior base, raising concerns while completely negating the latest technical breakout. Fundamentals remain strong.
>>> FEATURED STOCK ARTICLE : Boat Retailer Has Strong Earnings History - 11/2/2018 |
View all notes |
Set NEW NOTE alert |
Company Profile |
SEC
News |
Chart |
Request a new note
C
A
S
I |
ULTA
-
NASDAQ
Ulta Beauty Inc
SPECIALTY RETAIL - Specialty Retail, Other
|
$314.25
|
+5.26
1.70% |
$314.29
|
799,602
79.72% of 50 DAV
50 DAV is 1,003,000
|
$312.38
0.60%
|
11/8/2018
|
$296.36
|
PP = $290.40
|
|
MB = $304.92
|
Most Recent Note - 11/9/2018 5:52:26 PM
Y - Posted another solid gain today with above average volume. Finished strong after highlighted in yellow with pivot point cited based on its 9/11/18 high plus 10 cents in the prior mid-day report. The gain and close above the pivot point backed by +79% above average volume clinched a technical buy signal. See the latest FSU analysis for more details and a new annotated graph.
>>> FEATURED STOCK ARTICLE : Volume Driven Gains Indicate Institutional Buying Demand - 11/9/2018 |
View all notes |
Set NEW NOTE alert |
Company Profile |
SEC
News |
Chart |
Request a new note
C
A
S
I |
UBNT
-
NASDAQ
Ubiquiti Networks Inc
TELECOMMUNICATIONS - Diversified Communication Serv
|
$106.69
|
+0.73
0.69% |
$108.30
|
492,641
94.56% of 50 DAV
50 DAV is 521,000
|
$112.38
-5.06%
|
11/9/2018
|
$108.20
|
PP = $101.43
|
|
MB = $106.50
|
Most Recent Note - 11/12/2018 6:47:16 PM
Y - Pulled back today below its "max buy" level. Quickly got extended and finished strong after highlighted in yellow in the 11/09/18 mid-day report with new pivot point cited based on its 9/25/18 high plus 10 cents. Reported earnings +27% on +15% sales revenues for the Sep '18 quarter, marking its 3rd consecutive quarterly comparison above the +25% minimum earnings guideline (C criteria), helping it better match the fact-based investment system's fundamental guidelines. After a small downturn in FY '15 its annual earnings (A criteria) growth has been strong. See the latest FSU analysis for more details and a new annotated graph.
>>> FEATURED STOCK ARTICLE : Pullback Following Breakout Gain on After Latest Earnings Report - 11/12/2018 |
View all notes |
Set NEW NOTE alert |
Company Profile |
SEC
News |
Chart |
Request a new note
C
A
S
I |
DPZ
-
NYSE
Dominos Pizza Inc
Retail-Restaurants
|
$264.71
|
-4.38
-1.63% |
$272.86
|
357,056
60.21% of 50 DAV
50 DAV is 593,000
|
$305.34
-13.31%
|
8/13/2018
|
$288.60
|
PP = $293.91
|
|
MB = $308.61
|
Most Recent Note - 11/12/2018 6:53:56 PM
G - Met resistance at its 50 DMA line ($277), and a rebound above the 50 DMA line is needed for its outlook to improve. The 200 DMA line ($258) and prior lows ($253) define important near-term support to watch. Fundamentals remain strong.
>>> FEATURED STOCK ARTICLE : Found Support at 200-Day Moving Average Line - 10/31/2018 |
View all notes |
Set NEW NOTE alert |
Company Profile |
SEC
News |
Chart |
Request a new note
C
A
S
I |
FIVE
-
NASDAQ
Five Below Inc
Retail-DiscountandVariety
|
$122.21
|
-1.20
-0.97% |
$125.32
|
1,056,919
105.06% of 50 DAV
50 DAV is 1,006,000
|
$136.13
-10.23%
|
7/6/2018
|
$98.90
|
PP = $104.09
|
|
MB = $109.29
|
Most Recent Note - 11/8/2018 5:20:43 PM
G - Posted a solid gain today backed by +25% above average volume while rebounding further above its 50 DMA line ($121). Still faces resistance due to overhead supply up to the $136 level. Recently found support near the prior high ($109.09 on 7/19/18), but more damaging losses would raise greater concerns.
>>> FEATURED STOCK ARTICLE : Sputtering Below 50-Day Moving Average Near Prior High - 10/25/2018 |
View all notes |
Set NEW NOTE alert |
Company Profile |
SEC
News |
Chart |
Request a new note
C
A
S
I |
Symbol/Exchange
Company Name
Industry Group |
PRICE |
CHANGE
(%Change) |
Day High |
Volume
(% DAV)
(% 50 day avg vol) |
52 Wk Hi
% From Hi |
Featured
Date |
Price
Featured |
Pivot Featured |
|
Max Buy |
HQY
-
NASDAQ
Healthequity Inc
COMPUTER SOFTWARE and SERVICES - Healthcare Information Service
|
$88.99
|
-2.35
-2.57% |
$92.89
|
676,744
73.64% of 50 DAV
50 DAV is 919,000
|
$101.58
-12.39%
|
11/2/2018
|
$95.56
|
PP = $100.09
|
|
MB = $105.09
|
Most Recent Note - 11/13/2018 5:46:50 PM
G - Color code is changed to green after today's 4th consecutive loss on light volume led to a close below its 50 DMA line ($91.12). A rebound above the 50 DMA line is needed for its outlook to improve. Prior reports cautioned members - "A big gain on 11/07/18 was backed by only +20% above average volume. Subsequent gains above the pivot point backed by at least +40% above average volume may clinch a convincing new (or add on) technical buy signal."
>>> FEATURED STOCK ARTICLE : Rebound Above 50-Day Average Helped Outlook Improve - 11/1/2018 |
View all notes |
Set NEW NOTE alert |
Company Profile |
SEC
News |
Chart |
Request a new note
C
A
S
I |
OLLI
-
NASDAQ
Ollie's Bargain Outlet
Retail-DiscountandVariety
|
$90.76
|
+0.42
0.46% |
$91.75
|
412,823
59.66% of 50 DAV
50 DAV is 692,000
|
$97.61
-7.02%
|
11/8/2018
|
$92.75
|
PP = $97.71
|
|
MB = $102.60
|
Most Recent Note - 11/8/2018 5:24:29 PM
Y - Posted a 3rd consecutive gain today and it has been finding support near its 50 DMA line ($90.79). Color code is changed to yellow and a new pivot point is cited based on its 10/01/18 high plus 10 cents. Subsequent volume-driven gains above the pivot point may trigger a new (or add-on) technical buy signal. The recent low ($84.66 on 10/11/18) defines the next important support to watch. Fundamentals remain strong.
>>> FEATURED STOCK ARTICLE : Finding Support Near its 50-Day Moving Average - 10/30/2018 |
View all notes |
Set NEW NOTE alert |
Company Profile |
SEC
News |
Chart |
Request a new note
C
A
S
I |
PLNT
-
NYSE
Planet Fitness Inc Cl A
Leisure-Services
|
$52.09
|
+0.99
1.94% |
$52.97
|
1,112,964
88.47% of 50 DAV
50 DAV is 1,258,000
|
$57.66
-9.66%
|
11/7/2018
|
$57.10
|
PP = $55.45
|
|
MB = $58.22
|
Most Recent Note - 11/12/2018 12:53:13 PM
Y - Gapped down today and a big loss has it abruptly retreating below prior highs in the $53-55 area, raising concerns. Testing its 50 DMA line ($49.79) which defines important support.
>>> FEATURED STOCK ARTICLE : Big Gain for New High With Nearly 4 Times Average Volume - 11/7/2018 |
View all notes |
Set NEW NOTE alert |
Company Profile |
SEC
News |
Chart |
Request a new note
C
A
S
I |
|
|
|
THESE ARE NOT BUY RECOMMENDATIONS!
Comments contained in the body of this report are technical
opinions only. The material herein has been obtained
from sources believed to be reliable and accurate, however,
its accuracy and completeness cannot be guaranteed.
This site is not an investment advisor, hence it does
not endorse or recommend any securities or other investments.
Any recommendation contained in this report may not
be suitable for all investors and it is not to be deemed
an offer or solicitation on our part with respect to
the purchase or sale of any securities. All trademarks,
service marks and trade names appearing in this report
are the property of their respective owners, and are
likewise used for identification purposes only.
This report is a service available
only to active Paid Premium Members.
You may opt-out of receiving report notifications
at any time. Questions or comments may be submitted
by writing to Premium Membership Services 665 S.E. 10 Street, Suite 201 Deerfield Beach, FL 33441-5634 or by calling 1-800-965-8307
or 954-785-1121.
|
|
|

