You are not logged in.
This means you
CAN ONLY VIEW reports that were published prior to Tuesday, February 20, 2024.
You
MUST UPGRADE YOUR MEMBERSHIP if you want to see any current reports.
AFTER MARKET UPDATE - THURSDAY, NOVEMBER 12TH, 2020
Previous After Market Report Next After Market Report >>>
|
|
|
|
DOW |
-317.46 |
29,080.17 |
-1.08% |
|
Volume |
1,043,772,952 |
+13% |
|
Volume |
3,835,064,300 |
+0% |
|
NASDAQ |
-77.49 |
11,708.95 |
-0.66% |
|
Advancers |
741 |
25% |
|
Advancers |
1,102 |
32% |
|
S&P 500 |
-35.65 |
3,537.01 |
-1.00% |
|
Decliners |
2,251 |
75% |
|
Decliners |
2,331 |
68% |
|
Russell 2000 |
-28.47 |
1,708.47 |
-1.64% |
|
52 Wk Highs |
33 |
|
|
52 Wk Highs |
92 |
|
|
S&P 600 |
-20.94 |
968.50 |
-2.12% |
|
52 Wk Lows |
7 |
|
|
52 Wk Lows |
9 |
|
|
 |
Breadth Negative and Volume Higher as Stocks Endure Pressure
Kenneth J. Gruneisen - Passed the CAN SLIM® Master's Exam
The Dow slumped 317 points, while the S&P 500 lost 1.0%. The Nasdaq Composite reversed early session gains, losing 0.7%. The reported volume totals were higher than the prior session on both the NYSE and the Nasdaq exchange, indicative of distributional pressure. Breadth was negative as decliners led advancers by a 3-1 margin on the NYSE and by more than a 2-1 margin on the Nasdaq exchange. There were 14 high-ranked companies from the Leaders List that hit new 52-week highs and were listed on the BreakOuts Page, versus the total of 27 on the prior session. New 52-week highs totals contracted yet still easily outnumbered shrinking new 52-week lows totals. New lows were in the single digits on both the NYSE and the Nasdaq exchange for the second consecutive session. The major indices confirmed a new uptrend (M criteria) with recent follow-through gains backed by higher volume and more leadership. Investors are reminded to always make buying and selling decisions based based on the strict criteria and rules of the fact-based investment system. 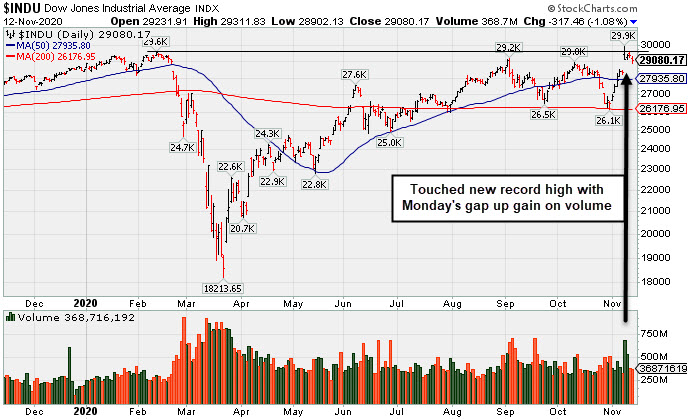 PICTURED: The Dow Jones Industrial Average has been consolidating after finally touching a new record high with Monday's gap up gain on higher volume. INDU
U.S. stocks ended firmly lower on Thursday, as vaccine optimism was overshadowed by concerns that new restrictions could hinder ongoing economic recovery. City and state officials weighed new measures aimed at curbing the virus’s spread as U.S. case counts surged. The most recent tally showed the U.S. averaged the highest number of daily new infections since the pandemic began, and the number of hospitalized COVID patients hit a new record on Wednesday.
All 11 S&P 500 sectors ended in negative territory, with seven groups falling more than 1%. The Energy sector lagged the most, with WTI crude losing 1.2% to $40.95/barrel amid a surprise build of U.S. crude stockpiles in the most recent week. Biotech company Moderna (MRNA +6.51%) bucked the downtrend as market participants anticipated positive feedback from an independent committee analysis on the company’s coronavirus vaccine candidate in the coming days. In earnings, Energizer Holdings (ENR -14.97%) sank after the battery maker’s quarterly profit fell short of estimates.
On the data front, initial jobless claims fell to the lowest level since March, declining to 709,000 from the prior period’s 757,000 figure. A separate update showed U.S. core consumer prices (ex- food and energy) held steady month-over-month, and climbed 1.6% year-over-year. Meanwhile, the monthly budget statement showed the federal government started its 2021 fiscal year with a record October deficit. Treasuries advanced, with the yield on the benchmark 10-year note down 10 basis points to 0.88%. |
 Kenneth J. Gruneisen started out as a licensed stockbroker in August 1987, a couple of months prior to the historic stock market crash that took the Dow Jones Industrial Average down -22.6% in a single day. He has published daily fact-based fundamental and technical analysis on high-ranked stocks online for two decades. Through FACTBASEDINVESTING.COM, Kenneth provides educational articles, news, market commentary, and other information regarding proven investment systems that work in good times and bad.
Comments contained in the body of this report are technical opinions only and are not necessarily those of Gruneisen Growth Corp. The material herein has been obtained from sources believed to be reliable and accurate, however, its accuracy and completeness cannot be guaranteed. Our firm, employees, and customers may effect transactions, including transactions contrary to any recommendation herein, or have positions in the securities mentioned herein or options with respect thereto. Any recommendation contained in this report may not be suitable for all investors and it is not to be deemed an offer or solicitation on our part with respect to the purchase or sale of any securities. |
|
 |
Energy Group Led Tech, Financial, and Retail Indexes Lower
Kenneth J. Gruneisen - Passed the CAN SLIM® Master's Exam
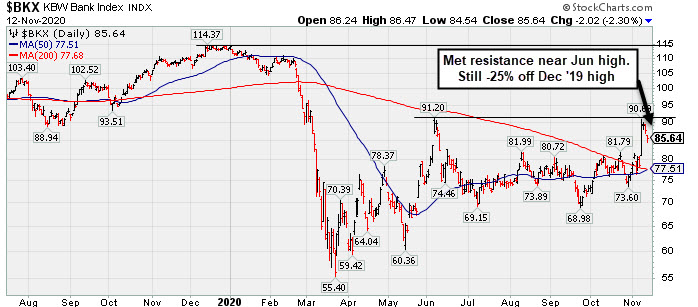
The Retail Index ($RLX -0.87%) and financial shares created a drag on the major indices as the Bank Index ($BKX -2.30%) and Broker/Dealer Index ($XBD -1.57%) each lost ground. The tech sector had a negative bias as the Semiconductor Index ($SOX -1.31%) and Networking Index ($NWX -1.66%) both lost ground, and the Biotech Index ($BTK -0.27%) also ended slightly in the red. Commodity-linked groupps were mixed as the energy-linked groups lost ground and the Oil Services Index ($OSX -3.13%) and Integrated Oil Index ($XOI -4.13%) both slumped, meanwhile, the Gold & Silver Index ($XAU +1.02%) posted a gain.
PICTURED: The Bank Index ($BKX -2.30%) has pulled back after recently spiking near its June high. Subsequent gains for new highs would bode well for the broader market outlook. However, this index is still -25% off its Dec '19 high. Chart readers may notice the 50-day moving average (DMA) line is on the cusp of crossing above its 200 DMA line, action technically termed a "golden cross". It is an encouraging sign when financial indexes are trading above both their 50 and 200 DMA lines. In this case the 200 DMA line is downward sloping.
| Oil Services |
$OSX |
32.55 |
-1.05 |
-3.13% |
-58.43% |
| Integrated Oil |
$XOI |
663.79 |
-28.59 |
-4.13% |
-47.76% |
| Semiconductor |
$SOX |
2,478.46 |
-32.78 |
-1.31% |
+34.00% |
| Networking |
$NWX |
592.93 |
-10.03 |
-1.66% |
+1.63% |
| Broker/Dealer |
$XBD |
325.28 |
-5.20 |
-1.57% |
+12.02% |
| Retail |
$RLX |
3,408.92 |
-30.09 |
-0.87% |
+39.18% |
| Gold & Silver |
$XAU |
142.04 |
+1.43 |
+1.02% |
+32.84% |
| Bank |
$BKX |
85.64 |
-2.02 |
-2.30% |
-24.45% |
| Biotech |
$BTK |
5,475.74 |
-14.58 |
-0.27% |
+8.06% |
|
|
|
 |
Churning Action Near Prior High Indicative of Distributional Pressure
Kenneth J. Gruneisen - Passed the CAN SLIM® Master's Exam
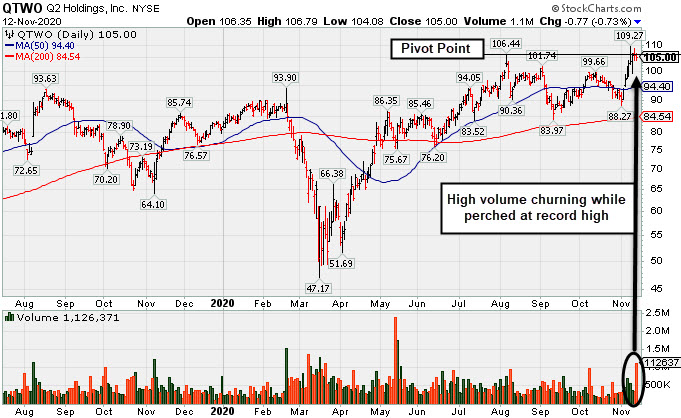
Q2 Holdings Inc (QTWO -$0.77 or -0.73% to $105.00) finished lower after highlighted in yellow with new pivot point cited based on its 8/06/20 high plus 10 cents in the earlier mid-day report (read here). Perched at a new 52-week and all-time high after a spurt of gains, the session's high volume "churning" without meaningful price progress had the look of distributional pressure or selling from the institutonal crowd. Disciplined investors may watch for subsequent confirming gains above the pivot point backed by at least +40% above average volume to help clinch a convincing technical buy signal.
It has a 97 Earnings Per Share Rating. It showed great earning increases with strong underlying sales revenues growth for the Jun and Sep '20 quarters versus the year ago periods. Annual earnings growth has been strong. Completed new Public Offerings on 6/06/19 and 5/13/20. The company hails from the Computer Sftwr-Financial group. There are only 59.3 million shares outstanding (S criteria).
The number of top-rated funds owning its shares rose from 404 in Dec '19 to 465 in Sep '20, a reassuring sign concerning the I criteria. Its current Up/Down Volume Ratio of 0.9 is an unbiased indication its shares have been under slight distributional pressure over the past 50 days.
.
|
|
|
Color Codes Explained :
Y - Better candidates highlighted by our
staff of experts.
G - Previously featured
in past reports as yellow but may no longer be buyable under the
guidelines.
***Last / Change / Volume data in this table is the closing quote data***
Symbol/Exchange
Company Name
Industry Group |
PRICE |
CHANGE
(%Change) |
Day High |
Volume
(% DAV)
(% 50 day avg vol) |
52 Wk Hi
% From Hi |
Featured
Date |
Price
Featured |
Pivot Featured |
|
Max Buy |
 CRL
-
NYSE
CRL
-
NYSE
Charles River Labs Intl
DRUGS - Biotechnology
|
$237.46
|
+1.80
0.76% |
$238.14
|
368,295
104.04% of 50 DAV
50 DAV is 354,000
|
$257.88
-7.92%
|
7/15/2020
|
$192.66
|
PP = $189.95
|
|
MB = $199.45
|
Most Recent Note - 11/11/2020 5:58:04 PM
G - After a "negative reversal" at a new new all-time high it pulled back and tested support at an upward trendline and its 50 DMA line ($228) which again acted as support. More damaging losses would raise greater concerns and may trigger a worrisome technical sell signal. Reported Sep '20 quarterly earnings +38% on +11% sales revenues versus the year ago period, above the +25% minimum earnings guideline (C criteria).
>>> FEATURED STOCK ARTICLE : Earnings Due; Consolidating Near Prior High and Above 50 DMA Line - 10/27/2020 |
View all notes |
Set NEW NOTE alert |
Company Profile |
SEC
News |
Chart |
Request a new note
C
A
S
I |
AMD
-
NASDAQ
Advanced Micro Devices
ELECTRONICS - Semiconductor - Broad Line
|
$81.84
|
+0.56
0.69% |
$83.00
|
37,179,007
68.39% of 50 DAV
50 DAV is 54,361,000
|
$94.28
-13.19%
|
8/31/2020
|
$90.42
|
PP = $87.39
|
|
MB = $91.76
|
Most Recent Note - 11/11/2020 5:56:21 PM
G - Rebounded back above its 50 DMA line ($80.71) with light volume behind today's big gain. Prior lows in the $73 area define important near term support. On 11/06 and 11/09 prior notes repeatedly cautioned members - "It has not formed a sound base pattern. Subsequent losses and deterioration below the recent low would raise greater concerns and trigger a more worrisome technical sell signal. Faces near-term resistance due to overhead supply up to the $94 level."
>>> FEATURED STOCK ARTICLE : Weak Action Raised Concern While Testing Recent Low - 11/3/2020 |
View all notes |
Set NEW NOTE alert |
Company Profile |
SEC
News |
Chart |
Request a new note
C
A
S
I |
TER
-
NASDAQ
Teradyne Inc
ELECTRONICS - Semiconductor Equipment and Mate
|
$100.48
|
-0.70
-0.69% |
$102.13
|
1,260,398
52.26% of 50 DAV
50 DAV is 2,412,000
|
$105.62
-4.87%
|
10/21/2020
|
$92.22
|
PP = $93.54
|
|
MB = $98.22
|
Most Recent Note - 11/11/2020 5:52:44 PM
G - Posted a gain today with light volume for its second best ever close. Reported earnings +53% on +41% sales revenues for the Sep '20 quarter versus the year ago period, its 4th consecutive quarterly comparison with earnings above the +25% minimum earnings guideline (C criteria). Sequential comparisons show encouraging acceleration in its sales revenues growth rate. Its annual earnings (A criteria) history has been strong. See the latest FSU analysis for more details and a new annotated graph.
>>> FEATURED STOCK ARTICLE : Recent Gains for New Highs Lacked Great Volume Conviction - 11/11/2020 |
View all notes |
Set NEW NOTE alert |
Company Profile |
SEC
News |
Chart |
Request a new note
C
A
S
I |
TREX
-
NYSE
Trex Company Inc
MATERIALS and CONSTRUCTION - General Building Materials
|
$69.06
|
-0.58
-0.83% |
$70.90
|
939,260
111.16% of 50 DAV
50 DAV is 845,000
|
$81.23
-14.98%
|
6/26/2020
|
$54.53
|
PP = $66.47
|
|
MB = $69.79
|
Most Recent Note - 11/10/2020 6:20:51 PM
G - Finished in the upper half of its intra-day range today but suffered a 2nd consecutive damaging volume-driven loss while testing the prior low ($63.32 on 9/21/20) noted as the next near-term support level to watch. Recently noted that it reported Sep '20 quarterly earnings +14% on +19% sales revenues versus the year ago period, below the +25% minimum guideline (C criteria) raising fundamental concerns.
>>> FEATURED STOCK ARTICLE : Rebound Above 50-Day Moving Average Helped Technical Stance - 11/4/2020 |
View all notes |
Set NEW NOTE alert |
Company Profile |
SEC
News |
Chart |
Request a new note
C
A
S
I |
LGIH
-
NASDAQ
L G I Homes Inc
Bldg-Resident/Comml
|
$110.31
|
-3.83
-3.36% |
$115.37
|
240,240
87.36% of 50 DAV
50 DAV is 275,000
|
$132.98
-17.05%
|
10/1/2020
|
$123.17
|
PP = $124.04
|
|
MB = $130.24
|
Most Recent Note - 11/10/2020 6:03:59 PM
G - Rebounded toward its 50 DMA line ($116) which may act as resistance after a damaging volume-driven loss on the prior session. A rebound above the 50 DMA line is needed for its outlook to improve. Reported Sep '20 quarterly earnings +27% on +11% sales revenues versus the year ago period. See the latest FSU analysis for more details and a new annotated graph.
>>> FEATURED STOCK ARTICLE : Rebound Toward 50-Day Average Which May Act as Resistance - 11/10/2020 |
View all notes |
Set NEW NOTE alert |
Company Profile |
SEC
News |
Chart |
Request a new note
C
A
S
I |
Symbol/Exchange
Company Name
Industry Group |
PRICE |
CHANGE
(%Change) |
Day High |
Volume
(% DAV)
(% 50 day avg vol) |
52 Wk Hi
% From Hi |
Featured
Date |
Price
Featured |
Pivot Featured |
|
Max Buy |
NOW
-
NYSE
Servicenow Inc
Computer Sftwr-Enterprse
|
$509.78
|
+6.42
1.28% |
$525.01
|
1,576,559
116.27% of 50 DAV
50 DAV is 1,356,000
|
$537.53
-5.16%
|
8/20/2020
|
$453.34
|
PP = $454.79
|
|
MB = $477.53
|
Most Recent Note - 11/11/2020 12:33:45 PM
G - Promptly rebounding above its 50 DMA line ($489) with today's gap up gain following 2 consecutive big volume-driven losses off of its all-time high. Tested the prior low ($472 on 11/03/20) noted as important support where a damaging violation raises greater concerns. Recently reported Sep '20 quarterly earnings +22% on +30% sales revenues versus the year ago period, below the +25% minimum guideline (C criteria) of the fact-based investment system.
>>> FEATURED STOCK ARTICLE : Found Prompt Support at 50 DMA Line After Earnings News - 10/29/2020 |
View all notes |
Set NEW NOTE alert |
Company Profile |
SEC
News |
Chart |
Request a new note
C
A
S
I |
VEEV
-
NYSE
Veeva Systems Inc Cl A
Computer Sftwr-Medical
|
$274.07
|
+1.51
0.55% |
$277.93
|
587,081
71.60% of 50 DAV
50 DAV is 820,000
|
$313.99
-12.71%
|
10/6/2020
|
$287.71
|
PP = $298.86
|
|
MB = $313.80
|
Most Recent Note - 11/11/2020 5:59:39 PM
G - Posted a gain today with light volume after 2 consecutive damaging volume-driven losses violating its 50 DMA line ($282) and undercutting the prior low ($263). Only a prompt rebound above the 50 DMA line would help its outlook improve.
>>> FEATURED STOCK ARTICLE : Recently Slumped Back Below Prior Highs - 10/26/2020 |
View all notes |
Set NEW NOTE alert |
Company Profile |
SEC
News |
Chart |
Request a new note
C
A
S
I |
ALRM
-
NASDAQ
Alarm.com Holdings Inc
Security/Sfty
|
$70.55
|
-0.95
-1.33% |
$71.70
|
252,770
71.20% of 50 DAV
50 DAV is 355,000
|
$79.38
-11.12%
|
11/6/2020
|
$71.88
|
PP = $74.76
|
|
MB = $78.50
|
Most Recent Note - 11/10/2020 6:08:48 PM
Y - Suffered a loss today with above average volume breaking a streak of 6 consecutive gains. After reaching a new all-time high it has been encountering distributional pressure. See the latest FSU analysis for more details and an annotated graph. Previously noted - "Subsequent gains above the pivot point may help clinch a convincing technical buy signal. Reported earnings +32% on +24% sales revenues for the Sep '20 quarter versus the year ago period, an improvement after +3% earnings in the Jun quarter. Prior quarterly comparisons were near or above the +25% minimum earnings guideline (C criteria). Annual earnings (A criteria) growth has been strong, a good match with the fact-based investment system."
>>> FEATURED STOCK ARTICLE : Encountered Distributional Pressure as it Hit a New High - 11/9/2020 |
View all notes |
Set NEW NOTE alert |
Company Profile |
SEC
News |
Chart |
Request a new note
C
A
S
I |
TEAM
-
NASDAQ
Atlassian Corp Plc Cl A
Comp Sftwr-Spec Enterprs
|
$193.00
|
+1.24
0.65% |
$195.91
|
1,206,785
69.56% of 50 DAV
50 DAV is 1,735,000
|
$216.30
-10.77%
|
10/12/2020
|
$193.77
|
PP = $199.60
|
|
MB = $209.58
|
Most Recent Note - 11/11/2020 5:54:54 PM
G - Rebounded back above its 50 DMA line ($188) with today's gain on average volume after undercutting the prior low ($180) and finding prompt support. Reported earnings +7% on +26% sales revenues for the Sep '20 quarter versus the year ago period, well below the +25% minimum earnings guideline (C criteria), raising concerns.
>>> FEATURED STOCK ARTICLE : Weak Technical Action Followed Disappointing Fundamental News - 11/2/2020 |
View all notes |
Set NEW NOTE alert |
Company Profile |
SEC
News |
Chart |
Request a new note
C
A
S
I |
YETI
-
NYSE
Yeti Holdings Inc
Leisure-Products
|
$55.65
|
-0.49
-0.87% |
$57.17
|
916,983
71.58% of 50 DAV
50 DAV is 1,281,000
|
$62.72
-11.27%
|
11/5/2020
|
$57.25
|
PP = $55.14
|
|
MB = $57.90
|
Most Recent Note - 11/10/2020 1:13:28 PM
Y - Rebounding impressively today. Its 50 DMA line ($49.75) defines near-term support above prior lows. Suffered a big volume-driven loss on he prior session, slumping back below the pivot point and completely negating the recently noted breakout. See the latest FSU analysis for more details and an annotated graph.
>>> FEATURED STOCK ARTICLE : Finished Strong After Breakout Gain Was Noted in Mid-Day Report - 11/5/2020 |
View all notes |
Set NEW NOTE alert |
Company Profile |
SEC
News |
Chart |
Request a new note
C
A
S
I |
Symbol/Exchange
Company Name
Industry Group |
PRICE |
CHANGE
(%Change) |
Day High |
Volume
(% DAV)
(% 50 day avg vol) |
52 Wk Hi
% From Hi |
Featured
Date |
Price
Featured |
Pivot Featured |
|
Max Buy |
AAXN
-
NASDAQ
Axon Enterprise Inc
Security/Sfty
|
$118.15
|
-0.15
-0.13% |
$119.59
|
396,262
64.96% of 50 DAV
50 DAV is 610,000
|
$128.39
-7.98%
|
11/6/2020
|
$122.75
|
PP = $113.00
|
|
MB = $118.65
|
Most Recent Note - 11/10/2020 6:06:43 PM
G - Pulled back with above average volume today after a streak of 5 consecutive gains helped it hit new all-time highs. Bullish action came after reporting Sep '20 quarterly earnings +43% on +27% sales revenues versus the year ago period. It broke out of a cup-with-high-handle base with volume drying up during the handle.
>>> FEATURED STOCK ARTICLE : Breakaway Gap From Cup-With-High-Handle Pattern - 11/6/2020 |
View all notes |
Set NEW NOTE alert |
Company Profile |
SEC
News |
Chart |
Request a new note
C
A
S
I |
QTWO
-
NYSE
Q2 Holdings Inc
Computer Sftwr-Financial
|
$105.00
|
-0.77
-0.73% |
$106.79
|
1,118,818
289.10% of 50 DAV
50 DAV is 387,000
|
$109.27
-3.91%
|
11/12/2020
|
$105.14
|
PP = $106.54
|
|
MB = $111.87
|
 Most Recent Note - 11/12/2020 5:47:05 PM
Y - Encountered distributional pressure today as it churned heavy volme and ended lower after highlighted in yellow with new pivot point cited based on its 8/06/20 high plus 10 cents. Subsequent confirming gains above the pivot point backed by at least +40% above average volume may help clinch a convincing technical buy signal. Showed great earning increases with strong underlying sales revenues growth for the Jun and Sep '20 quarters versus the year ago periods. Annual earnings growth has been strong. Completed new Public Offerings on 6/06/19 and 5/13/20. See the latest FSU analysis for more details and a new annotated graph.
>>> FEATURED STOCK ARTICLE : Churning Action Near Prior High Indicative of Distributional Pressure - 11/12/2020 |
View all notes |
Set NEW NOTE alert |
Company Profile |
SEC
News |
Chart |
Request a new note
C
A
S
I |
|
|
|
THESE ARE NOT BUY RECOMMENDATIONS!
Comments contained in the body of this report are technical
opinions only. The material herein has been obtained
from sources believed to be reliable and accurate, however,
its accuracy and completeness cannot be guaranteed.
This site is not an investment advisor, hence it does
not endorse or recommend any securities or other investments.
Any recommendation contained in this report may not
be suitable for all investors and it is not to be deemed
an offer or solicitation on our part with respect to
the purchase or sale of any securities. All trademarks,
service marks and trade names appearing in this report
are the property of their respective owners, and are
likewise used for identification purposes only.
This report is a service available
only to active Paid Premium Members.
You may opt-out of receiving report notifications
at any time. Questions or comments may be submitted
by writing to Premium Membership Services 665 S.E. 10 Street, Suite 201 Deerfield Beach, FL 33441-5634 or by calling 1-800-965-8307
or 954-785-1121.
|
|
|