Help Lines 954-785-1121


You are not logged in. Upgrade Here
 <<<Previous Mid Day Report     Next Mid Day Report >>> 
 <<<Previous After Market Report Next After Market Report >>> 
You are not logged in.
This means you CAN ONLY VIEW reports that were published prior to Sunday, February 25, 2024.
You MUST UPGRADE YOUR MEMBERSHIP if you want to see any current reports.

AFTER MARKET UPDATE - TUESDAY, NOVEMBER 12TH, 2019
Previous After Market Report Next After Market Report >>>
Indices NYSE Nasdaq
DOW  +0.00 27,691.49 +0.00% Volume 790,575,270 +4% Volume 1,985,205,000 +16%
NASDAQ +21.81 8,486.09 +0.26% Advancers 1,364 48% Advancers 1,544 50%
S&P 500 +4.83 3,091.84 +0.16% Decliners 1,475 52% Decliners 1,523 50%
Russell 2000 +0.35 1,595.12 +0.02% 52 Wk Highs 119   52 Wk Highs 152  
S&P 600 -0.15 985.47 -0.02% 52 Wk Lows 71   52 Wk Lows 107  

Major Indices Hit Record Highs With Better Leadership

The S&P 500 added 0.2%, posting a new closing high after exceeding 3,100 for the first time during the session. The Dow ended the day unchanged, while the Nasdaq Composite closed up 0.3%, notching a fresh record level.. Decliners led advancers by a narrow margin on the NYSE while the mix was near even on the Nasdaq exchange. Volume totals reported were slightly higher than the prior session on both major exchanges. There were 64 high-ranked companies from the Leaders List that hit a new 52-week high and were listed on the BreakOuts Page, versus the total of 44 on the prior session. New 52-week highs totals solidly outnumbered new 52-week lows totals on the NYSE and on the Nasdaq exchange . The major indices (M criteria) are in a "confirmed uptrend" after enduring distributional pressure in recent weeks. The Featured Stocks Page provides the most timely analysis on high-ranked leaders.
Charts used courtesy of www.stockcharts.com

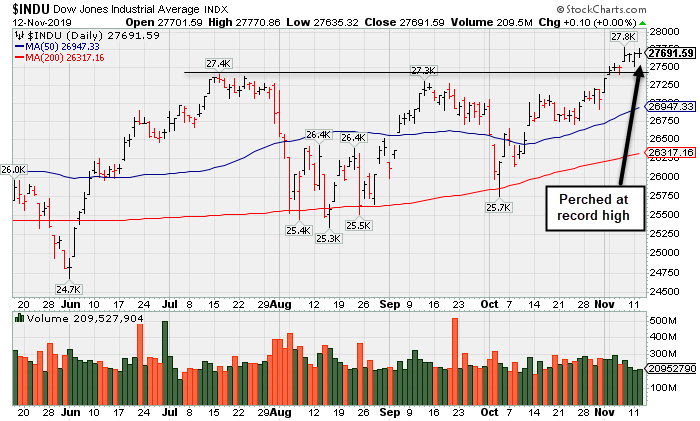
PICTURED: The Dow Jones Industrial Average is perched at its record high. 

Stocks finished mostly higher Tuesday as investors digested comments from President Trump and weighed corporate earnings results. In a lunchtime speech to the Economic Club of New York, President Trump noted that the initial part of a broader trade deal with Beijing could be finalized soon, but he also suggested that tariffs on Chinese goods would be increased substantially if no agreement is reached.

On the earnings front, D.R. Horton (DHI +3.08%) rose after the home construction company topped Wall Street profit forecasts and projected higher 2020 sales, citing strong demand and lower mortgage rates. Rockwell Automation (ROK +10.50%) rose following positive quarterly figures from the factory equipment maker. Advance Auto Parts (AAP -7.51%) fell after its same-store sales figure missed consensus estimates. CBS Corp. (CBS -3.62%) fell after delivering disappointing revenue figures amid a sharp decline in advertisement sales. Tyson Foods (TSN +7.43%) rose following positive remarks concerning the company’s move into alternative meats. In other corporate news, Disney (DIS +1.35%) rose following the launch of its new Disney+ streaming service.

Treasuries strengthened with the yield on the 10-year note down three basis points to 1.91%. On the data front, the NFIB reported that small business optimism improved in October. In commodities, WTI crude slipped 0.1% to $56.80/barrel, while COMEX gold rose 0.1% to $1,458.80/ounce, still near its lowest level since August.


Kenneth J. Gruneisen started out as a licensed stockbroker in August 1987, a couple of months prior to the historic stock market crash that took the Dow Jones Industrial Average down -22.6% in a single day. He has published daily fact-based fundamental and technical analysis on high-ranked stocks online for two decades. Through FACTBASEDINVESTING.COM, Kenneth provides educational articles, news, market commentary, and other information regarding proven investment systems that work in good times and bad.

Comments contained in the body of this report are technical opinions only and are not necessarily those of Gruneisen Growth Corp. The material herein has been obtained from sources believed to be reliable and accurate, however, its accuracy and completeness cannot be guaranteed. Our firm, employees, and customers may effect transactions, including transactions contrary to any recommendation herein, or have positions in the securities mentioned herein or options with respect thereto. Any recommendation contained in this report may not be suitable for all investors and it is not to be deemed an offer or solicitation on our part with respect to the purchase or sale of any securities.


Tech Sector and Gold & Silver Index Rose

The Bank Index ($BKX -0.15%), Broker/Dealer Index ($XBD +0.13%), and the Retail Index ($RLX -0.05%) each ended the session little changed. The Networking Index ($NWX +0.21%), Biotech Index ($BTK +0.66%), and the Semiconductor Index ($SOX +0.28%) posted unanimous gains, but all were on the small side. Energy-linked groups had a negative bias as the Oil Services Index ($OSX -1.49%) and the Integrated Oil Index ($XOI -0.61%).
Charts courtesy of www.stockcharts.com

PICTURED:  The Gold & Silver Index is consolidating near ts 50-day moving average (DMA) line.

Industry Index Symbol Close Change % Change YTD % Change
Oil Services $OSX  68.70 -1.04 -1.49% -14.76%
Integrated Oil $XOI  1,246.63 -7.63 -0.61% +7.55%
Semiconductor $SOX  1,732.42 +4.83 +0.28% +49.97%
Networking $NWX  584.32 +1.21 +0.21% +19.57%
Broker/Dealer $XBD  273.94 +0.36 +0.13% +15.42%
Retail $RLX  2,386.42 -1.11 -0.05% +22.29%
Gold & Silver $XAU  92.60 +1.07 +1.17% +31.05%
Bank $BKX  109.05 -0.16 -0.15% +27.11%
Biotech $BTK  4,578.01 +30.15 +0.66% +8.46%


Perched Near High Following Recent Volume-Driven Gains

Topbuild Corp (BLD +$1.01 or +0.95% to $107.32) is consolidating after getting very extended from any sound base with volume-driven gains last week for new all-time highs. Recently it reported earnings +24% on +5% sales revenues for the Sep '19 quarter versus the year ago period, just below the +25% minimum guideline (C criteria). It still has a 98 Earnings Per Share Rating, as its annual earnings (A criteria) history has also been strong and steady since turning profitable in FY '14.

BLD was last shown in this FSU section on 10/23/19 with an annotated graph under the headline, "Pulling Back After Recently Wedging Into New High Territory". It was highlighted in yellow with new pivot point cited based on its 8/12/18 high plus 10 cents in the 5/17/19 mid-day report (read here). It found prompt support near its 50-day moving average (DMA) line ($98.13) during its ongoing ascent.

The number of top-rated funds owning its shares rose from 380 in Dec '18 to 453 in Sep '19.   Its current Up/Down Volume Ratio of 1.1 is an unbiased indication its shares have been under slight accumulation over the past 50 days. It has a Timeliness Rating of A and a Sponsorship Rating of D.


Charts used courtesy of www.stockcharts.com

Color Codes Explained :
Y - Better candidates highlighted by our staff of experts.
G - Previously featured in past reports as yellow but may no longer be buyable under the guidelines.

***Last / Change / Volume data in this table is the closing quote data***
Symbol/Exchange
Company Name
Industry Group
PRICE CHANGE
(%Change)
Day High Volume
(% DAV)
(% 50 day avg vol)
52 Wk Hi
% From Hi
Featured
Date
Price
Featured
Pivot Featured
Max Buy
StockCharts.com Latest Chart for MLR MLR - NYSE
Miller Industries Inc
AUTOMOTIVE - Auto Parts  
$35.96 +0.97
2.77%

$36.06

54,981
134.10% of 50 DAV
50 DAV is 41,000
$37.70
-4.62%
9/24/2019 $34.00 PP = $35.36
MB = $37.13
Most Recent Note - 11/8/2019 12:34:21 PM
Y - Retreating from its 52-week high with today's 3rd consecutive loss with above average volume. Prior highs in the $35 area define initial support above its 50 DMA line ($33.40). Fundamentals remain strong.

>>> FEATURED STOCK ARTICLE : Hit New High But Did Not Close Session Above Pivot Point - 10/29/2019
 |  View all notes | Set NEW NOTE alert | Company Profile | SEC News | Chart | Request a new note C A  S  I 
StockCharts.com Latest Chart for CCBG CCBG - NASDAQ
Capital City Bk Gp
BANKING - Regional - Mid-Atlantic Banks  
$29.85 +0.10
0.34%

$29.94

21,639
61.83% of 50 DAV
50 DAV is 35,000
$30.85
-3.24%
9/13/2019 $27.03 PP = $27.05
MB = $28.40
Most Recent Note - 11/7/2019 5:37:18 PM
G - There was a "negative reversal" after hitting another new 52-week high today. Extended from the prior base. Prior highs define important support to watch along with its 50 DMA line ($27.07).
>>> FEATURED STOCK ARTICLE : Noted "Positive Reversal" on Volatile Session After Earnings - 10/31/2019
 |  View all notes | Set NEW NOTE alert | Company Profile | SEC News | Chart | Request a new note C A  S  I 
StockCharts.com Latest Chart for FTNT FTNT - NASDAQ
Fortinet Inc
Computer Sftwr-Security  
$99.99 +4.04
4.21%

$100.08

2,446,595
185.21% of 50 DAV
50 DAV is 1,321,000
$98.21
1.81%
11/11/2019 $97.14 PP = $97.06
MB = $101.91
Most Recent Note - 11/12/2019 5:44:40 PM
Y - Posted a solid gain above its new pivot point today backed by +85% above average volume triggering a new (or add-on) technical buy signal. Gapped up on 11/01/19 helping its outlook to improve. Bullish action came after it reported earnings +37% on +21% sales revenues for the Sep '19 quarter versus the year ago period. See the latest FSU analysis for more details and an annotated graph.

>>> FEATURED STOCK ARTICLE : Reversed Into Red Today After Touching New High - 11/11/2019
 |  View all notes | Set NEW NOTE alert | Company Profile | SEC News | Chart | Request a new note C A  S  I 
StockCharts.com Latest Chart for AUDC AUDC - NASDAQ
Audiocodes Ltd
ELECTRONICS - Scientific and Technical Instrum  
$21.64 +0.20
0.93%

$21.82

259,642
101.82% of 50 DAV
50 DAV is 255,000
$22.50
-3.82%
9/13/2019 $19.68 PP = $19.84
MB = $20.83
Most Recent Note - 11/11/2019 12:44:57 PM
G - Rebounded from early lows today below its "max buy" level. Reported earnings +26% on +15% sales revenues for the Sep '19 quarter. Its 50 DMA line ($19.31) and recent low ($17.54 on 10/08/19) define important near-term support levels to watch.
>>> FEATURED STOCK ARTICLE : Audiocodes is Quietly Perched Near its All-Time High - 11/7/2019
 |  View all notes | Set NEW NOTE alert | Company Profile | SEC News | Chart | Request a new note C A  S  I 
StockCharts.com Latest Chart for CHDN CHDN - NASDAQ
Churchill Downs Inc
LEISURE - Gaming Activities  
$125.88 -0.38
-0.30%

$127.07

210,405
74.88% of 50 DAV
50 DAV is 281,000
$135.32
-6.98%
10/8/2019 $129.77 PP = $132.83
MB = $139.47
Most Recent Note - 11/11/2019 11:46:18 AM
G - Technically, meeting resistance at its 50 DMA line ($126.53) when trying to rebound following damaging volume-driven losses last week. Reported Sep '19 earnings +4% on +38% sales revenues versus the year ago period, its 2nd consecutive quarterly comparison below the +25% minimum earnings guideline (C criteria), raising greater fundamental concerns.
>>> FEATURED STOCK ARTICLE : Perched at Record High at Time of Quarterly Report - 10/30/2019
 |  View all notes | Set NEW NOTE alert | Company Profile | SEC News | Chart | Request a new note C A  S  I 
Symbol/Exchange
Company Name
Industry Group
PRICE CHANGE
(%Change)
Day High Volume
(% DAV)
(% 50 day avg vol)
52 Wk Hi
% From Hi
Featured
Date
Price
Featured
Pivot Featured
Max Buy
StockCharts.com Latest Chart for LULU LULU - NASDAQ
Lululemon Athletica
MANUFACTURING - Textile Manufacturing  
$207.81 +0.62
0.30%

$208.74

1,724,108
87.03% of 50 DAV
50 DAV is 1,981,000
$209.02
-0.58%
9/6/2019 $201.25 PP = $194.35
MB = $204.07
Most Recent Note - 11/11/2019 11:49:05 AM
G - After wedging higher with gains lacking great volume conviction it found prompt support again near its 50 DMA line ($197.41). The prior low ($185.36 on 10/03/19) defines the next important near-term support.
>>> FEATURED STOCK ARTICLE : Testing 50-Day Moving Average With Loss on Above Average Volume - 11/4/2019
 |  View all notes | Set NEW NOTE alert | Company Profile | SEC News | Chart | Request a new note C A  S  I 
StockCharts.com Latest Chart for CPRT CPRT - NASDAQ
Copart Inc
SPECIALTY RETAIL - Auto Dealerships  
$82.30 -0.67
-0.81%

$83.37

1,263,550
82.42% of 50 DAV
50 DAV is 1,533,000
$85.31
-3.53%
9/5/2019 $79.13 PP = $79.84
MB = $83.83
Most Recent Note - 11/11/2019 11:47:40 AM
Y - Still consolidating below its "max buy" level and finding support above its 50 DMA line ($81.47). The 50 DMA line defines near-term support above the prior low ($76.35 on 10/03/19). Wedged to new all-time highs with recent gains lacking great volume conviction.
>>> FEATURED STOCK ARTICLE : Testing Support at 50-Day Moving Average - 11/6/2019
 |  View all notes | Set NEW NOTE alert | Company Profile | SEC News | Chart | Request a new note C A  S  I 
StockCharts.com Latest Chart for NMIH NMIH - NASDAQ
N M I Holdings Inc Cl A
Finance-MrtgandRel Svc  
$33.59 +1.17
3.61%

$33.88

471,912
115.10% of 50 DAV
50 DAV is 410,000
$33.54
0.15%
11/8/2019 $32.89 PP = $31.44
MB = $33.01
Most Recent Note - 11/12/2019 5:46:14 PM
G - Color code is changed to green after rising above its "max buy" level with today's gain backed by near average volume. Reported earnings +54% on +42% sales revenues for the Sep '19 quarter, and prior quarterly comparisons were also well above the +25% minimum guideline (C criteria). After years of losses it had profitable years for FY '16, '17, and '18.
>>> FEATURED STOCK ARTICLE : Hit New High With Volume-Driven Gains - 11/8/2019
 |  View all notes | Set NEW NOTE alert | Company Profile | SEC News | Chart | Request a new note C A  S  I 
StockCharts.com Latest Chart for BLD BLD - NYSE
Topbuild Corp
Bldg-Constr Prds/Misc  
$107.32 +1.01
0.95%

$107.99

246,739
86.27% of 50 DAV
50 DAV is 286,000
$111.48
-3.73%
5/17/2019 $82.19 PP = $87.31
MB = $91.68
Most Recent Note - 11/12/2019 5:43:01 PM
G - Extended from any sound base and consolidating after volume-driven gains for new all-time highs. Reported earnings +24% on +5% sales revenues for the Sep '19 quarter versus the year ago period, just below the +25% minimum guideline (C criteria). Found prompt support near its 50 DMA line ($98.13) during its ongoing ascent. See the latest FSU analysis for more details and a new annotated graph.
>>> FEATURED STOCK ARTICLE : Perched Near High Following Recent Volume-Driven Gains - 11/12/2019
 |  View all notes | Set NEW NOTE alert | Company Profile | SEC News | Chart | Request a new note C A  S  I 

THESE ARE NOT BUY RECOMMENDATIONS!  Comments contained in the body of this report are technical opinions only. The material herein has been obtained from sources believed to be reliable and accurate, however, its accuracy and completeness cannot be guaranteed. This site is not an investment advisor, hence it does not endorse or recommend any securities or other investments. Any recommendation contained in this report may not be suitable for all investors and it is not to be deemed an offer or solicitation on our part with respect to the purchase or sale of any securities. All trademarks, service marks and trade names appearing in this report are the property of their respective owners, and are likewise used for identification purposes only.

This report is a service available only to active Paid Premium Members. You may opt-out of receiving report notifications at any time.  Questions or comments may be submitted by writing to Premium Membership Services 665 S.E. 10 Street, Suite 201 Deerfield Beach, FL 33441-5634 or by calling 1-800-965-8307 or 954-785-1121.

Kenneth J. Gruneisen founded Gruneisen Growth Corp. (2003), which prior to May 11, 2015, operated CANSLIM.net and CANSLIM.com both under license from Data Analysis Inc. / Investor's Business Daily. Kenneth has passed the CAN SLIM® Master's Exam. Gruneisen Growth Corp. now continues over two decades of fact based market analysis via FactBasedInvesting.com.

Copyright © 1996-2024 Gruneisen Growth Corp. All rights reserved. Protected by the copyright laws of the United States and Canada and by international treaties

Privacy Policy | Terms of Use | Contact Us