You are not logged in.
This means you
CAN ONLY VIEW reports that were published prior to Saturday, February 24, 2024.
You
MUST UPGRADE YOUR MEMBERSHIP if you want to see any current reports.
AFTER MARKET UPDATE - MONDAY, NOVEMBER 12TH, 2018
Previous After Market Report Next After Market Report >>>
|
|
|
|
DOW |
-602.12 |
25,387.18 |
-2.32% |
|
Volume |
856,176,950 |
-8% |
|
Volume |
2,283,228,320 |
-5% |
|
NASDAQ |
-206.03 |
7,200.87 |
-2.78% |
|
Advancers |
792 |
27% |
|
Advancers |
664 |
22% |
|
S&P 500 |
-54.79 |
2,726.22 |
-1.97% |
|
Decliners |
2,190 |
73% |
|
Decliners |
2,415 |
78% |
|
Russell 2000 |
-30.70 |
1,518.79 |
-1.98% |
|
52 Wk Highs |
59 |
|
|
52 Wk Highs |
30 |
|
|
S&P 600 |
-17.57 |
955.08 |
-1.81% |
|
52 Wk Lows |
131 |
|
|
52 Wk Lows |
176 |
|
|
 |
Broad Weakness Leans Heavily on Latest Market Rally
Kenneth J. Gruneisen - Passed the CAN SLIM® Master's Exam
Stocks were firmly lower Monday. The Dow dropped 602 points to 25,387, while the S&P 500 lost 54 points to 2,726. The Nasdaq Composite was down 206 points to 7,200, erasing this month’s gains. The volume totals reported were lower on the NYSE and on the Nasdaq exchange versus the prior session. Decliners led advancers by almost a 3-1 margin on the NYSE and nearly 4-1 on the Nasdaq exchange. There were 23 high-ranked companies from the Leaders List that made new 52-week highs and were listed on the BreakOuts Page, down from the prior session. New 52-week lows outnumbered new 52-week highs on the NYSE and on the Nasdaq exchange. Technically, bullish action last week marked a shift in the market direction (M criteria) and confirmed a new uptrend but stocks have encountered pressure and leadership has sputtered. The Featured Stocks Page provides the most timely analysis on high-ranked leaders. Strict buying and selling rules should always be followed on a case by case basis. Charts used courtesy of www.stockcharts.com
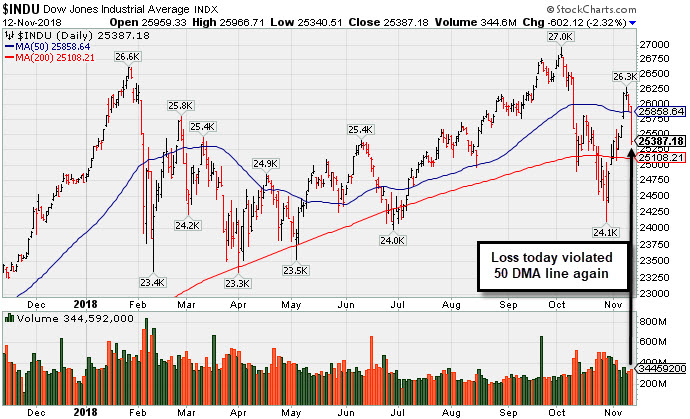
PICTURED: The Dow Jones Industrial Average pulled back for a big loss on Monday and retreated back below its 50-day moving average (DMA) line. The solid follow-through day on 11/07/18 was noted as a reassuring sign, however, subsequent losses undercutting the Day 1 lows would technically end the latest confirmed rally.
The major averages retreated as Tech weakness resumed and the U.S. dollar jumped amid continued political uncertainty in Europe. The Information Technology sector slumped 3.5%, led by a slide in Apple (AAPL -5.04%). A key Apple supplier cut its guidance Monday, leading to analyst speculation that iPhone production in the fourth quarter may be lower than expected.
10 of 11 S&P 500 sectors finished in negative territory with Real Estate the sole advancer. Consumer Discretionary lagged with Amazon (AMZN -4.41%) down. Financials also underperformed. Goldman Sachs (GS -7.46%), its worst session in seven years, amid scrutiny surrounding a Malaysian government scandal.
There were no economic releases, and the U.S. fixed income markets were closed in observance of Veterans Day. The U.S. dollar jumped another 0.6% on the session to its highest level since mid-2017 as uncertainty over Brexit negotiations and the Italian budget sent the euro tumbling. In commodities, oil extended its record losing streak to 11 days, reversing earlier gains. WTI crude slumped 2.3% to $58.80/barrel despite OPEC announcing it may implement supply cuts to stabilize prices. COMEX gold dipped 0.6% to $1,201.20 amid the strengthening dollar. |
 Kenneth J. Gruneisen started out as a licensed stockbroker in August 1987, a couple of months prior to the historic stock market crash that took the Dow Jones Industrial Average down -22.6% in a single day. He has published daily fact-based fundamental and technical analysis on high-ranked stocks online for two decades. Through FACTBASEDINVESTING.COM, Kenneth provides educational articles, news, market commentary, and other information regarding proven investment systems that work in good times and bad.
Comments contained in the body of this report are technical opinions only and are not necessarily those of Gruneisen Growth Corp. The material herein has been obtained from sources believed to be reliable and accurate, however, its accuracy and completeness cannot be guaranteed. Our firm, employees, and customers may effect transactions, including transactions contrary to any recommendation herein, or have positions in the securities mentioned herein or options with respect thereto. Any recommendation contained in this report may not be suitable for all investors and it is not to be deemed an offer or solicitation on our part with respect to the purchase or sale of any securities. |
|
 |
Retail, Tech, Financial, and Commodity-Linked Groups Fell
Kenneth J. Gruneisen - Passed the CAN SLIM® Master's Exam
The Retail Index ($RLX -3.00%) outpaced the Broker/Dealer Index ($XBD -2.26%) and the Bank Index ($BKX -1.49%) to the downside on Monday. The tech sector had a negative bias as the Semiconductor Index ($SOX -4.44%), Biotech Index ($BTK -3.65%), and the Networking Index ($NWX -2.86%) suffered unanimous losses. The Gold & Silver Index ($XAU -2.36%), Oil Services Index ($OSX -3.89%), and Integrated Oil Index ($XOI -2.06%) each ended solidly lower.
Charts courtesy of www.stockcharts.com
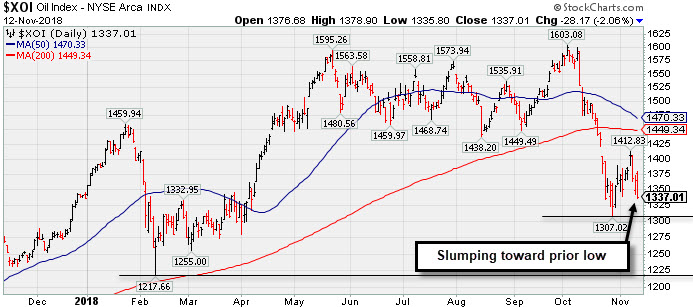 PICTURED: The Integrated Oil Index ($XOI -2.06%) is below its 200-day moving average (DMA) lines, slumping toward its prior low.
| Oil Services |
$OSX |
114.11 |
-4.61 |
-3.88% |
-23.70% |
| Integrated Oil |
$XOI |
1,337.01 |
-28.17 |
-2.06% |
+0.11% |
| Semiconductor |
$SOX |
1,174.49 |
-54.56 |
-4.44% |
-6.27% |
| Networking |
$NWX |
511.82 |
-15.06 |
-2.86% |
+4.34% |
| Broker/Dealer |
$XBD |
262.73 |
-6.07 |
-2.26% |
-0.95% |
| Retail |
$RLX |
2,138.63 |
-66.17 |
-3.00% |
+23.35% |
| Gold & Silver |
$XAU |
62.65 |
-1.51 |
-2.35% |
-26.53% |
| Bank |
$BKX |
99.68 |
-1.50 |
-1.48% |
-6.59% |
| Biotech |
$BTK |
4,515.21 |
-170.90 |
-3.65% |
+6.94% |
|
|
|
 |
Pullback Following Breakout Gain on After Latest Earnings Report
Kenneth J. Gruneisen - Passed the CAN SLIM® Master's Exam
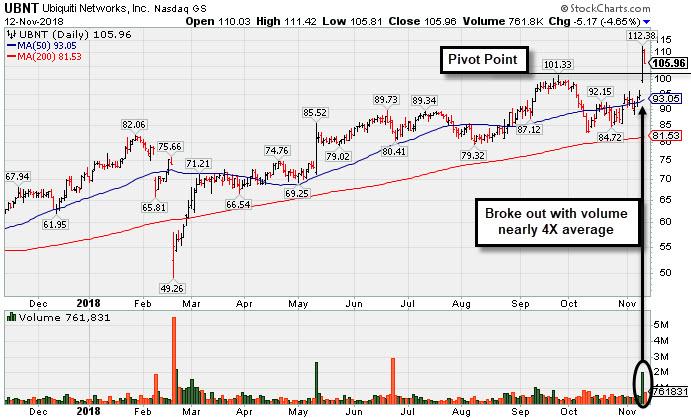
Ubiquiti Networks Inc (UBNT -$5.17 or -4.65% to $105.96) pulled back back below its "max buy" level with above average volume behind a big loss today. It had quickly gotten extended more than +5% above the prior high and finished strong after highlighted in yellow in the 11/09/18 mid-day report with new pivot point cited based on its 9/25/18 high plus 10 cents (read here). The big gain for a new high with nearly 4 times average volume triggered a technical buy signal. A tactical approach taught in the Certification requires investors to avoid chasing extended stocks. Disciplined investors also know to always limit losses if ever any stock falls more than 7% from their purchase price! Bullish action last week came after it reported earnings +27% on +15% sales revenues for the Sep '18 quarter, marking its 3rd consecutive quarterly comparison above the +25% minimum earnings guideline (C criteria), helping it better match the fact-based investment system's fundamental guidelines. The number of top-rated funds owning its shares rose from 262 in Dec '17 to 293 in Sep '18, a reassuring sign concerning the I criteria. Its current Up/Down Volume ratio of 1.2 is an unbiased indication its shares have been under accumulation over the past 50 days. Its small supply of only 20 million shares (S criteria) in the public float can contribute to greater price volatility in the event of institutional buying or selling. It has earned a B Timeliness Rating and B Sponsorship Rating. It hails from the Telecom - Infrastructure Industry Group which has a 91 Group Relative Strength Rating, a reassuring sign concerning the L criteria. After a small downturn in FY '15 its annual earnings (A criteria) growth has been strong. That fundamental shortcoming had a role in limiting its appearances since UBNT was last shown in this FSU section on 4/20/12 with an annotated graph under the headline, "Formed a New Ascending Base But Did Not Confirm New Buy Signal".
Chart courtesy of www.stockcharts.com
 |
|
|
Color Codes Explained :
Y - Better candidates highlighted by our
staff of experts.
G - Previously featured
in past reports as yellow but may no longer be buyable under the
guidelines.
***Last / Change / Volume data in this table is the closing quote data***
Symbol/Exchange
Company Name
Industry Group |
PRICE |
CHANGE
(%Change) |
Day High |
Volume
(% DAV)
(% 50 day avg vol) |
52 Wk Hi
% From Hi |
Featured
Date |
Price
Featured |
Pivot Featured |
|
Max Buy |
MPX
-
NYSE
Marine Products Corp
AUTOMOTIVE - Recreational Vehicles
|
$22.70
|
+1.66
7.89% |
$23.05
|
66,933
159.36% of 50 DAV
50 DAV is 42,000
|
$24.82
-8.54%
|
10/24/2018
|
$23.00
|
PP = $24.92
|
|
MB = $26.17
|
 Most Recent Note - 11/12/2018 3:13:39 PM
Y - Color code is changed to yellow after rebounding above its 50 DMA line ($21.95) again with today's volume-driven gain. Very little resistance remains due to overhead supply up to the $24 level. Subsequent gains above the pivot point backed by at least +40% above average volume may trigger a technical buy signal.
>>> FEATURED STOCK ARTICLE : Weak Finish Amid Widely Negative Market Environment - 10/24/2018 |
View all notes |
Set NEW NOTE alert |
Company Profile |
SEC
News |
Chart |
Request a new note
C
A
S
I |
GMED
-
NYSE
Globus Medical Inc Cl A
CHEMICALS - Specialty Chemicals
|
$51.61
|
-0.25
-0.48% |
$54.05
|
873,109
121.27% of 50 DAV
50 DAV is 720,000
|
$57.83
-10.76%
|
9/26/2018
|
$56.11
|
PP = $57.65
|
|
MB = $60.53
|
Most Recent Note - 11/9/2018 1:13:41 PM
G - Reported earnings +30% on +12% sales revenues for the Sep '18 quarter. Gapped down and abruptly retreated below its 50 and 200 DMA lines with today's big loss triggering a technical sell signal and its color code is changed to green. Disciplined investors note it did not trigger a technical buy signal after previously noted - "Volume and volatility often increase near earnings news. Its 50 DMA line ($53.26) and 200 DMA line ($51.52) define near-term support. Subsequent gains above the pivot point backed by more than +40% above average volume are needed to trigger a proper technical buy signal."
>>> FEATURED STOCK ARTICLE : Consolidating -5.2% Off 52-Week High Ahead of Earnings News - 11/5/2018 |
View all notes |
Set NEW NOTE alert |
Company Profile |
SEC
News |
Chart |
Request a new note
C
A
S
I |
ZBRA
-
NASDAQ
Zebra Tech Corp Cl A
COMPUTER HARDWARE - Computer Peripherals
|
$177.43
|
-4.07
-2.24% |
$181.66
|
416,183
96.34% of 50 DAV
50 DAV is 432,000
|
$184.75
-3.96%
|
11/6/2018
|
$170.41
|
PP = $179.57
|
|
MB = $188.55
|
Most Recent Note - 11/12/2018 6:50:41 PM
Y - Sputtered below the pivot point as it pulled back today for a 2nd small loss on lighter volume following 3 consecutive volume-driven gains. Disciplined investors are reminded to always follow strict buy and sell rules.
>>> FEATURED STOCK ARTICLE : Hit New High Following Another Strong Earnings Increase - 11/6/2018 |
View all notes |
Set NEW NOTE alert |
Company Profile |
SEC
News |
Chart |
Request a new note
C
A
S
I |
CME
-
NASDAQ
C M E Group Inc
DIVERSIFIED SERVICES - Business/Management Services
|
$186.45
|
-3.29
-1.73% |
$190.19
|
2,109,772
120.01% of 50 DAV
50 DAV is 1,758,000
|
$190.43
-2.09%
|
10/4/2018
|
$179.29
|
PP = $177.45
|
|
MB = $186.32
|
Most Recent Note - 11/7/2018 5:15:40 PM
G - Hit yet another new all-time high and rose further above its "max buy" level with above average volume behind today's 9th consecutive small gain. Found support above its 50 DMA line ($177) after recently reporting earnings +22% on +2% sales revenues for the Sep '18 quarter, below the +25% minimum earnings guideline (C criteria), raising fundamental concerns. The 50 DMA line and prior low ($170.04 on 9/28/18) define important near-term support.
>>> FEATURED STOCK ARTICLE : Perched Near High After Latest Earnings Report Below +25% Minimum - 10/26/2018 |
View all notes |
Set NEW NOTE alert |
Company Profile |
SEC
News |
Chart |
Request a new note
C
A
S
I |
GDOT
-
NYSE
Green Dot Corp Cl A
FINANCIAL SERVICES - Credit Services
|
$79.77
|
-6.16
-7.17% |
$86.46
|
645,644
156.71% of 50 DAV
50 DAV is 412,000
|
$93.00
-14.23%
|
11/8/2018
|
$90.35
|
PP = $91.61
|
|
MB = $96.19
|
Most Recent Note - 11/12/2018 3:05:33 PM
G - Color code is changed to green with another big loss today undercutting its 50 DMA line ($82.18) after it abruptly reversed into the prior base with a big loss on Friday. Disciplined investors always limit losses by selling any stock that falls more than -7% from their purchase price.
>>> FEATURED STOCK ARTICLE : Volume Heavy Behind Rally to New High - 11/8/2018 |
View all notes |
Set NEW NOTE alert |
Company Profile |
SEC
News |
Chart |
Request a new note
C
A
S
I |
Symbol/Exchange
Company Name
Industry Group |
PRICE |
CHANGE
(%Change) |
Day High |
Volume
(% DAV)
(% 50 day avg vol) |
52 Wk Hi
% From Hi |
Featured
Date |
Price
Featured |
Pivot Featured |
|
Max Buy |
HZO
-
NYSE
Marinemax Inc
SPECIALTY RETAIL - Specialty Retail, Other
|
$24.14
|
-0.32
-1.31% |
$24.59
|
218,364
66.17% of 50 DAV
50 DAV is 330,000
|
$26.11
-7.55%
|
11/2/2018
|
$25.10
|
PP = $25.15
|
|
MB = $26.41
|
Most Recent Note - 11/7/2018 1:12:04 PM
Y - Abruptly retreated from its 52-week high and slumped back into the prior base raising concerns with today's big loss after an impressive streak of 7 consecutive volume-driven gains. Highlighted in yellow with pivot point cited based on its 6/07/18 high plus 10 cents in the 11/02/18 mid-day report. New buying efforts are discouraged until a convincing follow-through day confirms a new market rally (M criteria). Reported Sep '18 earnings +105% on +23% sales revenues, its 4th consecutive quarter with a big earnings increase versus the year ago period. Sales revenues growth has shown encouraging acceleration in sequential quarterly comparisons versus the year ago periods. See the latest FSU analysis for more details and an annotated graph.
>>> FEATURED STOCK ARTICLE : Boat Retailer Has Strong Earnings History - 11/2/2018 |
View all notes |
Set NEW NOTE alert |
Company Profile |
SEC
News |
Chart |
Request a new note
C
A
S
I |
ULTA
-
NASDAQ
Ulta Beauty Inc
SPECIALTY RETAIL - Specialty Retail, Other
|
$308.99
|
+0.87
0.28% |
$312.38
|
1,150,888
105.97% of 50 DAV
50 DAV is 1,086,000
|
$312.20
-1.03%
|
11/8/2018
|
$296.36
|
PP = $290.40
|
|
MB = $304.92
|
Most Recent Note - 11/9/2018 5:52:26 PM
Y - Posted another solid gain today with above average volume. Finished strong after highlighted in yellow with pivot point cited based on its 9/11/18 high plus 10 cents in the prior mid-day report. The gain and close above the pivot point backed by +79% above average volume clinched a technical buy signal. See the latest FSU analysis for more details and a new annotated graph.
>>> FEATURED STOCK ARTICLE : Volume Driven Gains Indicate Institutional Buying Demand - 11/9/2018 |
View all notes |
Set NEW NOTE alert |
Company Profile |
SEC
News |
Chart |
Request a new note
C
A
S
I |
UBNT
-
NASDAQ
Ubiquiti Networks Inc
TELECOMMUNICATIONS - Diversified Communication Serv
|
$105.96
|
-5.17
-4.65% |
$111.42
|
761,801
148.21% of 50 DAV
50 DAV is 514,000
|
$112.38
-5.71%
|
11/9/2018
|
$108.20
|
PP = $101.43
|
|
MB = $106.50
|
Most Recent Note - 11/12/2018 6:47:16 PM
Y - Pulled back today below its "max buy" level. Quickly got extended and finished strong after highlighted in yellow in the 11/09/18 mid-day report with new pivot point cited based on its 9/25/18 high plus 10 cents. Reported earnings +27% on +15% sales revenues for the Sep '18 quarter, marking its 3rd consecutive quarterly comparison above the +25% minimum earnings guideline (C criteria), helping it better match the fact-based investment system's fundamental guidelines. After a small downturn in FY '15 its annual earnings (A criteria) growth has been strong. See the latest FSU analysis for more details and a new annotated graph.
>>> FEATURED STOCK ARTICLE : Pullback Following Breakout Gain on After Latest Earnings Report - 11/12/2018 |
View all notes |
Set NEW NOTE alert |
Company Profile |
SEC
News |
Chart |
Request a new note
C
A
S
I |
DPZ
-
NYSE
Dominos Pizza Inc
Retail-Restaurants
|
$269.09
|
-5.26
-1.92% |
$274.45
|
400,767
67.70% of 50 DAV
50 DAV is 592,000
|
$305.34
-11.87%
|
8/13/2018
|
$288.60
|
PP = $293.91
|
|
MB = $308.61
|
Most Recent Note - 11/12/2018 6:53:56 PM
G - Met resistance at its 50 DMA line ($277), and a rebound above the 50 DMA line is needed for its outlook to improve. The 200 DMA line ($258) and prior lows ($253) define important near-term support to watch. Fundamentals remain strong.
>>> FEATURED STOCK ARTICLE : Found Support at 200-Day Moving Average Line - 10/31/2018 |
View all notes |
Set NEW NOTE alert |
Company Profile |
SEC
News |
Chart |
Request a new note
C
A
S
I |
FIVE
-
NASDAQ
Five Below Inc
Retail-DiscountandVariety
|
$123.41
|
+1.71
1.41% |
$124.90
|
982,282
97.93% of 50 DAV
50 DAV is 1,003,000
|
$136.13
-9.34%
|
7/6/2018
|
$98.90
|
PP = $104.09
|
|
MB = $109.29
|
Most Recent Note - 11/8/2018 5:20:43 PM
G - Posted a solid gain today backed by +25% above average volume while rebounding further above its 50 DMA line ($121). Still faces resistance due to overhead supply up to the $136 level. Recently found support near the prior high ($109.09 on 7/19/18), but more damaging losses would raise greater concerns.
>>> FEATURED STOCK ARTICLE : Sputtering Below 50-Day Moving Average Near Prior High - 10/25/2018 |
View all notes |
Set NEW NOTE alert |
Company Profile |
SEC
News |
Chart |
Request a new note
C
A
S
I |
Symbol/Exchange
Company Name
Industry Group |
PRICE |
CHANGE
(%Change) |
Day High |
Volume
(% DAV)
(% 50 day avg vol) |
52 Wk Hi
% From Hi |
Featured
Date |
Price
Featured |
Pivot Featured |
|
Max Buy |
HQY
-
NASDAQ
Healthequity Inc
COMPUTER SOFTWARE and SERVICES - Healthcare Information Service
|
$91.34
|
-5.69
-5.86% |
$96.81
|
718,003
78.56% of 50 DAV
50 DAV is 914,000
|
$101.58
-10.08%
|
11/2/2018
|
$95.56
|
PP = $100.09
|
|
MB = $105.09
|
Most Recent Note - 11/12/2018 3:09:19 PM
Y - Pulling back from its all-time high with today's 3rd consecutive loss with below average volume. The 50 DMA line ($91.26) defines important near-term support. A big gain on 11/07/18 was backed by only +20% above average volume. Subsequent gains above the pivot point backed by at least +40% above average volume may clinch a convincing new (or add on) technical buy signal.
>>> FEATURED STOCK ARTICLE : Rebound Above 50-Day Average Helped Outlook Improve - 11/1/2018 |
View all notes |
Set NEW NOTE alert |
Company Profile |
SEC
News |
Chart |
Request a new note
C
A
S
I |
OLLI
-
NASDAQ
Ollie's Bargain Outlet
Retail-DiscountandVariety
|
$90.34
|
-0.94
-1.03% |
$92.47
|
682,383
98.90% of 50 DAV
50 DAV is 690,000
|
$97.61
-7.45%
|
11/8/2018
|
$92.75
|
PP = $97.71
|
|
MB = $102.60
|
Most Recent Note - 11/8/2018 5:24:29 PM
Y - Posted a 3rd consecutive gain today and it has been finding support near its 50 DMA line ($90.79). Color code is changed to yellow and a new pivot point is cited based on its 10/01/18 high plus 10 cents. Subsequent volume-driven gains above the pivot point may trigger a new (or add-on) technical buy signal. The recent low ($84.66 on 10/11/18) defines the next important support to watch. Fundamentals remain strong.
>>> FEATURED STOCK ARTICLE : Finding Support Near its 50-Day Moving Average - 10/30/2018 |
View all notes |
Set NEW NOTE alert |
Company Profile |
SEC
News |
Chart |
Request a new note
C
A
S
I |
PLNT
-
NYSE
Planet Fitness Inc Cl A
Leisure-Services
|
$51.10
|
-3.89
-7.07% |
$53.56
|
2,432,047
199.68% of 50 DAV
50 DAV is 1,218,000
|
$57.66
-11.38%
|
11/7/2018
|
$57.10
|
PP = $55.45
|
|
MB = $58.22
|
Most Recent Note - 11/12/2018 12:53:13 PM
Y - Gapped down today and a big loss has it abruptly retreating below prior highs in the $53-55 area, raising concerns. Testing its 50 DMA line ($49.79) which defines important support.
>>> FEATURED STOCK ARTICLE : Big Gain for New High With Nearly 4 Times Average Volume - 11/7/2018 |
View all notes |
Set NEW NOTE alert |
Company Profile |
SEC
News |
Chart |
Request a new note
C
A
S
I |
|
|
|
THESE ARE NOT BUY RECOMMENDATIONS!
Comments contained in the body of this report are technical
opinions only. The material herein has been obtained
from sources believed to be reliable and accurate, however,
its accuracy and completeness cannot be guaranteed.
This site is not an investment advisor, hence it does
not endorse or recommend any securities or other investments.
Any recommendation contained in this report may not
be suitable for all investors and it is not to be deemed
an offer or solicitation on our part with respect to
the purchase or sale of any securities. All trademarks,
service marks and trade names appearing in this report
are the property of their respective owners, and are
likewise used for identification purposes only.
This report is a service available
only to active Paid Premium Members.
You may opt-out of receiving report notifications
at any time. Questions or comments may be submitted
by writing to Premium Membership Services 665 S.E. 10 Street, Suite 201 Deerfield Beach, FL 33441-5634 or by calling 1-800-965-8307
or 954-785-1121.
|
|
|

