You are not logged in.
This means you
CAN ONLY VIEW reports that were published prior to Friday, February 23, 2024.
You
MUST UPGRADE YOUR MEMBERSHIP if you want to see any current reports.
AFTER MARKET UPDATE - WEDNESDAY, NOVEMBER 11TH, 2020
Previous After Market Report Next After Market Report >>>
|
|
|
|
DOW |
-23.29 |
29,397.63 |
-0.08% |
|
Volume |
925,449,349 |
-24% |
|
Volume |
3,820,454,100 |
-19% |
|
NASDAQ |
+232.58 |
11,786.43 |
+2.01% |
|
Advancers |
1,526 |
51% |
|
Advancers |
1,949 |
57% |
|
S&P 500 |
+27.13 |
3,572.66 |
+0.77% |
|
Decliners |
1,478 |
49% |
|
Decliners |
1,491 |
43% |
|
Russell 2000 |
-0.07 |
1,736.94 |
-0.00% |
|
52 Wk Highs |
47 |
|
|
52 Wk Highs |
97 |
|
|
S&P 600 |
-6.56 |
989.44 |
-0.66% |
|
52 Wk Lows |
7 |
|
|
52 Wk Lows |
8 |
|
|
 |
Tech Bounce Helped Nasdaq Composite Lead Major Indices
Kenneth J. Gruneisen - Passed the CAN SLIM® Master's Exam
The S&P 500 and Nasdaq Composite gained 0.8% and 2.0%, respectively. Meanwhile, the Dow fell 23 points, paring its outperformance against the Nasdaq for the week to 4.7%. The small-cap Russell 2000 snapped a two-day winning streak, slipping 0.3%. The reported volume totals were lighter than the prior session on both the NYSE and the Nasdaq exchange. Breadth was slightly positive as advancers led decliners by a narrow margin on the NYSE and by a 4-3 margin on the Nasdaq exchange. There were 27 high-ranked companies from the Leaders List that hit new 52-week highs and were listed on the BreakOuts Page, versus the total of 26 on the prior session. The new 52-week highs totals outnumbered shrinking new 52-week lows totals on both the NYSE and the Nasdaq exchange. The major indices confirmed a new uptrend (M criteria) with recent follow-through gains backed by higher volume and more leadership. Investors are reminded to always make buying and selling decisions based based on the strict criteria and rules of the fact-based investment system. 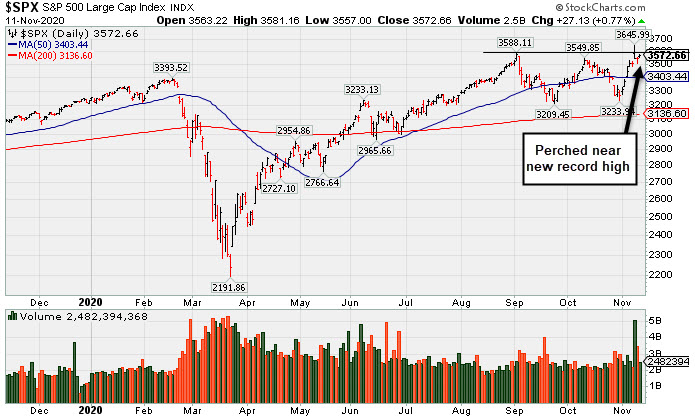 PICTURED: The S&P 500 Index recently hit a new record high.
U.S. equities finished mixed on Wednesday, as Technology-related stocks rebounded. Investors backed off a recent rotation into value- and cyclical-oriented companies, which was inspired by promising coronavirus vaccine data earlier in the week.
Sentiment continued to be bolstered by optimism surrounding a COVID-19 vaccine, but worsening virus trends remained in the peripheral. The U.S. saw a record number of hospitalized COVID-19 patients on Tuesday and logged more than 1 million new cases in the first 10 days of November. Economic data releases were subdued on Wednesday, with U.S. bond markets closed for Veterans Day. The lone update showed MBA mortgage applications slipped 0.5% in the most recent week. In commodities, WTI crude added 0.4% to $41.54/barrel, near its highest level in nearly 10 weeks. Gold lost 0.8% to $1862.40/ounce amid a stronger dollar.
Six of 11 S&P 500 sectors ended in positive territory. Technology-related stocks paced the gains, with the oft-cited FANNG group rising 2%. The Materials groups led decliners with Air Products and Chemicals (APD -9.40%) falling after its recently quarterly report disappointed Wall Street’s expectations. Other lagging groups included Energy, Industrials, and Financials. In other corporate news, Yelp (YELP +0.66%) inched higher after the user review website was the subject of an analyst upgrade. |
 Kenneth J. Gruneisen started out as a licensed stockbroker in August 1987, a couple of months prior to the historic stock market crash that took the Dow Jones Industrial Average down -22.6% in a single day. He has published daily fact-based fundamental and technical analysis on high-ranked stocks online for two decades. Through FACTBASEDINVESTING.COM, Kenneth provides educational articles, news, market commentary, and other information regarding proven investment systems that work in good times and bad.
Comments contained in the body of this report are technical opinions only and are not necessarily those of Gruneisen Growth Corp. The material herein has been obtained from sources believed to be reliable and accurate, however, its accuracy and completeness cannot be guaranteed. Our firm, employees, and customers may effect transactions, including transactions contrary to any recommendation herein, or have positions in the securities mentioned herein or options with respect thereto. Any recommendation contained in this report may not be suitable for all investors and it is not to be deemed an offer or solicitation on our part with respect to the purchase or sale of any securities. |
|
 |
Retail and Tech Indexes Rose
Kenneth J. Gruneisen - Passed the CAN SLIM® Master's Exam
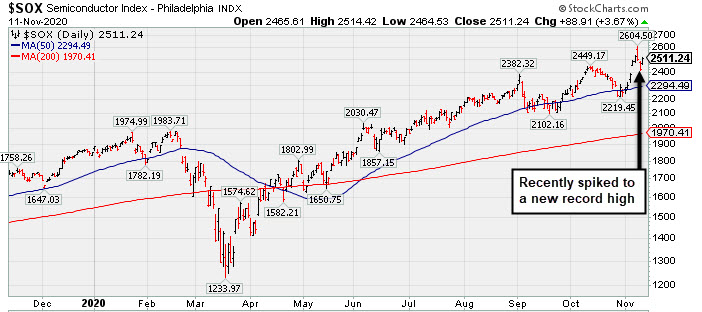
The Retail Index ($RLX +2.00%) posted an influential gain while the Broker/Dealer Index ($XBD +0.33%) inched higher but the Bank Index ($BKX -1.68%) lost ground. The tech sector had a positive bias as the Semiconductor Index ($SOX +3.68%) and Networking Index ($NWX +1.50%) both outpaced the Biotech Index ($BTK +0.66%). Commodity-linked groups had a negative bias as the Oil Services Index ($OSX -1.72%), Integrated Oil Index ($XOI -0.72%),, and the Gold & Silver Index ($XAU -1.04%) suffered unanimous losses.
PICTURED: The Semiconductor Index ($SOX +3.68%) posted a big gain today and recently spiked to a new record high. .
| Oil Services |
$OSX |
33.60 |
-0.59 |
-1.72% |
-57.08% |
| Integrated Oil |
$XOI |
692.38 |
-5.01 |
-0.72% |
-45.51% |
| Semiconductor |
$SOX |
2,511.53 |
+89.19 |
+3.68% |
+35.79% |
| Networking |
$NWX |
602.96 |
+8.89 |
+1.50% |
+3.35% |
| Broker/Dealer |
$XBD |
330.48 |
+1.10 |
+0.33% |
+13.81% |
| Retail |
$RLX |
3,439.01 |
+67.40 |
+2.00% |
+40.41% |
| Gold & Silver |
$XAU |
140.57 |
-1.48 |
-1.04% |
+31.47% |
| Bank |
$BKX |
87.66 |
-1.50 |
-1.68% |
-22.67% |
| Biotech |
$BTK |
5,490.32 |
+36.23 |
+0.66% |
+8.34% |
|
|
|
 |
Recent Gains for New Highs Lacked Great Volume Conviction
Kenneth J. Gruneisen - Passed the CAN SLIM® Master's Exam
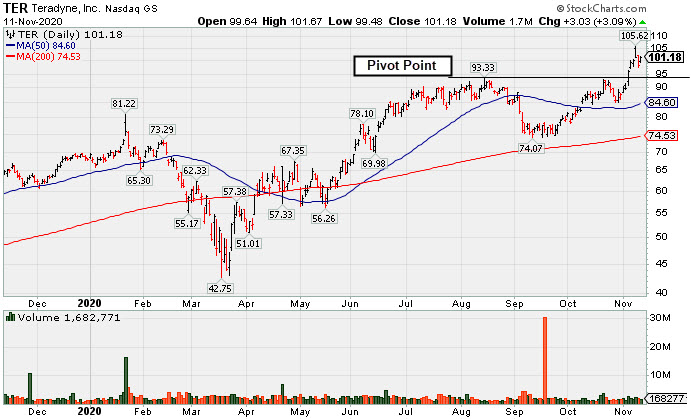
Teradyne Inc (TER +$3.03 or +3.09% to $101.18) posted a gain today with below average volume for its second best ever close and its color code was changed to green after rising back above its "max buy" level. TER was highlighted in yellow with pivot point cited based on its 8/14/20 high plus 10 cents in the 10/21/20 mid-day report (read here). Subsequent gains above the pivot point lacked the necessary +40% above average volume needed to trigger a proper technical buy signal. It was last shown in this FSU section on 10/21/20 with an annotated graph under the headline, "Challenging All-Time High With Volume-Driven Gain".
Recently it reported earnings +53% on +41% sales revenues for the Sep '20 quarter versus the year ago period, its 4th consecutive quarterly comparison with earnings above the +25% minimum earnings guideline (C criteria). Sequential comparisons show encouraging acceleration in its sales revenues growth rate. Its annual earnings (A criteria) history has been strong.
The high-ranked ELECTRONICS - Semiconductor Equipment firm has 166 million shares outstanding (S criteria). The number of top-rated funds owning its shares rise from 1,149 in Dec '19 to 1,425 in Sep '20, a reassuring sign concerning the I criteria. Its current Up/Down Volume ratio of 0.8 is an unbiased indication its shares have been under distributional pressure over the past 50 days. |
|
|
Color Codes Explained :
Y - Better candidates highlighted by our
staff of experts.
G - Previously featured
in past reports as yellow but may no longer be buyable under the
guidelines.
***Last / Change / Volume data in this table is the closing quote data***
Symbol/Exchange
Company Name
Industry Group |
PRICE |
CHANGE
(%Change) |
Day High |
Volume
(% DAV)
(% 50 day avg vol) |
52 Wk Hi
% From Hi |
Featured
Date |
Price
Featured |
Pivot Featured |
|
Max Buy |
 CRL
-
NYSE
CRL
-
NYSE
Charles River Labs Intl
DRUGS - Biotechnology
|
$235.66
|
+6.92
3.03% |
$235.86
|
314,871
88.70% of 50 DAV
50 DAV is 355,000
|
$257.88
-8.62%
|
7/15/2020
|
$192.66
|
PP = $189.95
|
|
MB = $199.45
|
 Most Recent Note - 11/11/2020 5:58:04 PM
G - After a "negative reversal" at a new new all-time high it pulled back and tested support at an upward trendline and its 50 DMA line ($228) which again acted as support. More damaging losses would raise greater concerns and may trigger a worrisome technical sell signal. Reported Sep '20 quarterly earnings +38% on +11% sales revenues versus the year ago period, above the +25% minimum earnings guideline (C criteria).
>>> FEATURED STOCK ARTICLE : Earnings Due; Consolidating Near Prior High and Above 50 DMA Line - 10/27/2020 |
View all notes |
Set NEW NOTE alert |
Company Profile |
SEC
News |
Chart |
Request a new note
C
A
S
I |
AMD
-
NASDAQ
Advanced Micro Devices
ELECTRONICS - Semiconductor - Broad Line
|
$81.28
|
+3.29
4.22% |
$81.47
|
44,511,015
81.54% of 50 DAV
50 DAV is 54,591,000
|
$94.28
-13.79%
|
8/31/2020
|
$90.42
|
PP = $87.39
|
|
MB = $91.76
|
Most Recent Note - 11/11/2020 5:56:21 PM
G - Rebounded back above its 50 DMA line ($80.71) with light volume behind today's big gain. Prior lows in the $73 area define important near term support. On 11/06 and 11/09 prior notes repeatedly cautioned members - "It has not formed a sound base pattern. Subsequent losses and deterioration below the recent low would raise greater concerns and trigger a more worrisome technical sell signal. Faces near-term resistance due to overhead supply up to the $94 level."
>>> FEATURED STOCK ARTICLE : Weak Action Raised Concern While Testing Recent Low - 11/3/2020 |
View all notes |
Set NEW NOTE alert |
Company Profile |
SEC
News |
Chart |
Request a new note
C
A
S
I |
TER
-
NASDAQ
Teradyne Inc
ELECTRONICS - Semiconductor Equipment and Mate
|
$101.18
|
+3.03
3.09% |
$101.67
|
1,682,771
69.94% of 50 DAV
50 DAV is 2,406,000
|
$105.62
-4.20%
|
10/21/2020
|
$92.22
|
PP = $93.54
|
|
MB = $98.22
|
Most Recent Note - 11/11/2020 5:52:44 PM
G - Posted a gain today with light volume for its second best ever close. Reported earnings +53% on +41% sales revenues for the Sep '20 quarter versus the year ago period, its 4th consecutive quarterly comparison with earnings above the +25% minimum earnings guideline (C criteria). Sequential comparisons show encouraging acceleration in its sales revenues growth rate. Its annual earnings (A criteria) history has been strong. See the latest FSU analysis for more details and a new annotated graph.
>>> FEATURED STOCK ARTICLE : Recent Gains for New Highs Lacked Great Volume Conviction - 11/11/2020 |
View all notes |
Set NEW NOTE alert |
Company Profile |
SEC
News |
Chart |
Request a new note
C
A
S
I |
TREX
-
NYSE
Trex Company Inc
MATERIALS and CONSTRUCTION - General Building Materials
|
$69.64
|
+1.89
2.79% |
$70.35
|
1,000,870
117.34% of 50 DAV
50 DAV is 853,000
|
$81.23
-14.27%
|
6/26/2020
|
$54.53
|
PP = $66.47
|
|
MB = $69.79
|
Most Recent Note - 11/10/2020 6:20:51 PM
G - Finished in the upper half of its intra-day range today but suffered a 2nd consecutive damaging volume-driven loss while testing the prior low ($63.32 on 9/21/20) noted as the next near-term support level to watch. Recently noted that it reported Sep '20 quarterly earnings +14% on +19% sales revenues versus the year ago period, below the +25% minimum guideline (C criteria) raising fundamental concerns.
>>> FEATURED STOCK ARTICLE : Rebound Above 50-Day Moving Average Helped Technical Stance - 11/4/2020 |
View all notes |
Set NEW NOTE alert |
Company Profile |
SEC
News |
Chart |
Request a new note
C
A
S
I |
LGIH
-
NASDAQ
L G I Homes Inc
Bldg-Resident/Comml
|
$114.14
|
+1.19
1.05% |
$115.00
|
225,177
81.59% of 50 DAV
50 DAV is 276,000
|
$132.98
-14.17%
|
10/1/2020
|
$123.17
|
PP = $124.04
|
|
MB = $130.24
|
Most Recent Note - 11/10/2020 6:03:59 PM
G - Rebounded toward its 50 DMA line ($116) which may act as resistance after a damaging volume-driven loss on the prior session. A rebound above the 50 DMA line is needed for its outlook to improve. Reported Sep '20 quarterly earnings +27% on +11% sales revenues versus the year ago period. See the latest FSU analysis for more details and a new annotated graph.
>>> FEATURED STOCK ARTICLE : Rebound Toward 50-Day Average Which May Act as Resistance - 11/10/2020 |
View all notes |
Set NEW NOTE alert |
Company Profile |
SEC
News |
Chart |
Request a new note
C
A
S
I |
Symbol/Exchange
Company Name
Industry Group |
PRICE |
CHANGE
(%Change) |
Day High |
Volume
(% DAV)
(% 50 day avg vol) |
52 Wk Hi
% From Hi |
Featured
Date |
Price
Featured |
Pivot Featured |
|
Max Buy |
NOW
-
NYSE
Servicenow Inc
Computer Sftwr-Enterprse
|
$503.36
|
+22.08
4.59% |
$508.06
|
1,577,599
116.69% of 50 DAV
50 DAV is 1,352,000
|
$537.53
-6.36%
|
8/20/2020
|
$453.34
|
PP = $454.79
|
|
MB = $477.53
|
Most Recent Note - 11/11/2020 12:33:45 PM
G - Promptly rebounding above its 50 DMA line ($489) with today's gap up gain following 2 consecutive big volume-driven losses off of its all-time high. Tested the prior low ($472 on 11/03/20) noted as important support where a damaging violation raises greater concerns. Recently reported Sep '20 quarterly earnings +22% on +30% sales revenues versus the year ago period, below the +25% minimum guideline (C criteria) of the fact-based investment system.
>>> FEATURED STOCK ARTICLE : Found Prompt Support at 50 DMA Line After Earnings News - 10/29/2020 |
View all notes |
Set NEW NOTE alert |
Company Profile |
SEC
News |
Chart |
Request a new note
C
A
S
I |
VEEV
-
NYSE
Veeva Systems Inc Cl A
Computer Sftwr-Medical
|
$272.56
|
+8.41
3.18% |
$273.75
|
629,811
75.97% of 50 DAV
50 DAV is 829,000
|
$313.99
-13.19%
|
10/6/2020
|
$287.71
|
PP = $298.86
|
|
MB = $313.80
|
Most Recent Note - 11/11/2020 5:59:39 PM
G - Posted a gain today with light volume after 2 consecutive damaging volume-driven losses violating its 50 DMA line ($282) and undercutting the prior low ($263). Only a prompt rebound above the 50 DMA line would help its outlook improve.
>>> FEATURED STOCK ARTICLE : Recently Slumped Back Below Prior Highs - 10/26/2020 |
View all notes |
Set NEW NOTE alert |
Company Profile |
SEC
News |
Chart |
Request a new note
C
A
S
I |
ALRM
-
NASDAQ
Alarm.com Holdings Inc
Security/Sfty
|
$71.50
|
+1.12
1.59% |
$72.75
|
451,322
127.49% of 50 DAV
50 DAV is 354,000
|
$79.38
-9.93%
|
11/6/2020
|
$71.88
|
PP = $74.76
|
|
MB = $78.50
|
Most Recent Note - 11/10/2020 6:08:48 PM
Y - Suffered a loss today with above average volume breaking a streak of 6 consecutive gains. After reaching a new all-time high it has been encountering distributional pressure. See the latest FSU analysis for more details and an annotated graph. Previously noted - "Subsequent gains above the pivot point may help clinch a convincing technical buy signal. Reported earnings +32% on +24% sales revenues for the Sep '20 quarter versus the year ago period, an improvement after +3% earnings in the Jun quarter. Prior quarterly comparisons were near or above the +25% minimum earnings guideline (C criteria). Annual earnings (A criteria) growth has been strong, a good match with the fact-based investment system."
>>> FEATURED STOCK ARTICLE : Encountered Distributional Pressure as it Hit a New High - 11/9/2020 |
View all notes |
Set NEW NOTE alert |
Company Profile |
SEC
News |
Chart |
Request a new note
C
A
S
I |
TEAM
-
NASDAQ
Atlassian Corp Plc Cl A
Comp Sftwr-Spec Enterprs
|
$191.76
|
+6.10
3.29% |
$196.19
|
1,722,425
99.85% of 50 DAV
50 DAV is 1,725,000
|
$216.30
-11.35%
|
10/12/2020
|
$193.77
|
PP = $199.60
|
|
MB = $209.58
|
Most Recent Note - 11/11/2020 5:54:54 PM
G - Rebounded back above its 50 DMA line ($188) with today's gain on average volume after undercutting the prior low ($180) and finding prompt support. Reported earnings +7% on +26% sales revenues for the Sep '20 quarter versus the year ago period, well below the +25% minimum earnings guideline (C criteria), raising concerns.
>>> FEATURED STOCK ARTICLE : Weak Technical Action Followed Disappointing Fundamental News - 11/2/2020 |
View all notes |
Set NEW NOTE alert |
Company Profile |
SEC
News |
Chart |
Request a new note
C
A
S
I |
YETI
-
NYSE
Yeti Holdings Inc
Leisure-Products
|
$56.14
|
+0.50
0.90% |
$56.50
|
1,203,420
93.51% of 50 DAV
50 DAV is 1,287,000
|
$62.72
-10.49%
|
11/5/2020
|
$57.25
|
PP = $55.14
|
|
MB = $57.90
|
Most Recent Note - 11/10/2020 1:13:28 PM
Y - Rebounding impressively today. Its 50 DMA line ($49.75) defines near-term support above prior lows. Suffered a big volume-driven loss on he prior session, slumping back below the pivot point and completely negating the recently noted breakout. See the latest FSU analysis for more details and an annotated graph.
>>> FEATURED STOCK ARTICLE : Finished Strong After Breakout Gain Was Noted in Mid-Day Report - 11/5/2020 |
View all notes |
Set NEW NOTE alert |
Company Profile |
SEC
News |
Chart |
Request a new note
C
A
S
I |
Symbol/Exchange
Company Name
Industry Group |
PRICE |
CHANGE
(%Change) |
Day High |
Volume
(% DAV)
(% 50 day avg vol) |
52 Wk Hi
% From Hi |
Featured
Date |
Price
Featured |
Pivot Featured |
|
Max Buy |
AAXN
-
NASDAQ
Axon Enterprise Inc
Security/Sfty
|
$118.30
|
-0.70
-0.59% |
$121.77
|
485,782
79.64% of 50 DAV
50 DAV is 610,000
|
$128.39
-7.86%
|
11/6/2020
|
$122.75
|
PP = $113.00
|
|
MB = $118.65
|
Most Recent Note - 11/10/2020 6:06:43 PM
G - Pulled back with above average volume today after a streak of 5 consecutive gains helped it hit new all-time highs. Bullish action came after reporting Sep '20 quarterly earnings +43% on +27% sales revenues versus the year ago period. It broke out of a cup-with-high-handle base with volume drying up during the handle.
>>> FEATURED STOCK ARTICLE : Breakaway Gap From Cup-With-High-Handle Pattern - 11/6/2020 |
View all notes |
Set NEW NOTE alert |
Company Profile |
SEC
News |
Chart |
Request a new note
C
A
S
I |
|
|
|
THESE ARE NOT BUY RECOMMENDATIONS!
Comments contained in the body of this report are technical
opinions only. The material herein has been obtained
from sources believed to be reliable and accurate, however,
its accuracy and completeness cannot be guaranteed.
This site is not an investment advisor, hence it does
not endorse or recommend any securities or other investments.
Any recommendation contained in this report may not
be suitable for all investors and it is not to be deemed
an offer or solicitation on our part with respect to
the purchase or sale of any securities. All trademarks,
service marks and trade names appearing in this report
are the property of their respective owners, and are
likewise used for identification purposes only.
This report is a service available
only to active Paid Premium Members.
You may opt-out of receiving report notifications
at any time. Questions or comments may be submitted
by writing to Premium Membership Services 665 S.E. 10 Street, Suite 201 Deerfield Beach, FL 33441-5634 or by calling 1-800-965-8307
or 954-785-1121.
|
|
|