You are not logged in.
This means you
CAN ONLY VIEW reports that were published prior to Sunday, February 18, 2024.
You
MUST UPGRADE YOUR MEMBERSHIP if you want to see any current reports.
AFTER MARKET UPDATE - TUESDAY, NOVEMBER 10TH, 2020
Previous After Market Report Next After Market Report >>>
|
|
|
|
DOW |
+262.95 |
29,420.92 |
+0.90% |
|
Volume |
1,222,487,037 |
-29% |
|
Volume |
4,706,019,200 |
-19% |
|
NASDAQ |
-163.61 |
11,550.18 |
-1.40% |
|
Advancers |
1,995 |
66% |
|
Advancers |
2,070 |
60% |
|
S&P 500 |
-28.79 |
3,467.31 |
-0.82% |
|
Decliners |
1,011 |
34% |
|
Decliners |
1,380 |
40% |
|
Russell 2000 |
+31.97 |
1,737.01 |
+1.88% |
|
52 Wk Highs |
68 |
|
|
52 Wk Highs |
89 |
|
|
S&P 600 |
+25.59 |
996.00 |
+2.64% |
|
52 Wk Lows |
10 |
|
|
52 Wk Lows |
22 |
|
|
 |
Tech Weakness Pressures Nasdaq Composite as Dow Notches Gains
Kenneth J. Gruneisen - Passed the CAN SLIM® Master's Exam
The Dow climbed 262 points. The small-cap Russell 2000 index rose 1.7% higher, and sits within striking distance of its August 2018 record closing level. Meanwhile, the S&P 500 slipped 0.1%, while the Nasdaq Composite shed 1.4% amid weakness in mega cap tech-centric companies. The reported volume totals were lighter than the prior session on both the NYSE and the Nasdaq exchange. Breadth was positive as advancers led decliners by almost a 2-1 margin on the NYSE and by a 3-2 margin on the Nasdaq exchange. Leadership contracted abruptly as there were 26 high-ranked companies from the Leaders List that hit new 52-week highs and were listed on the BreakOuts Page, down considerably from the total of 153 on the prior session. The new 52-week highs totals contracted yet outnumbered shrinking new 52-week lows totals on both the NYSE and the Nasdaq exchange. The major indices confirmed a new uptrend (M criteria) with recent follow-through gains backed by higher volume and more leadership. Investors are reminded to always make buying and selling decisions based based on the strict criteria and rules of the fact-based investment system. 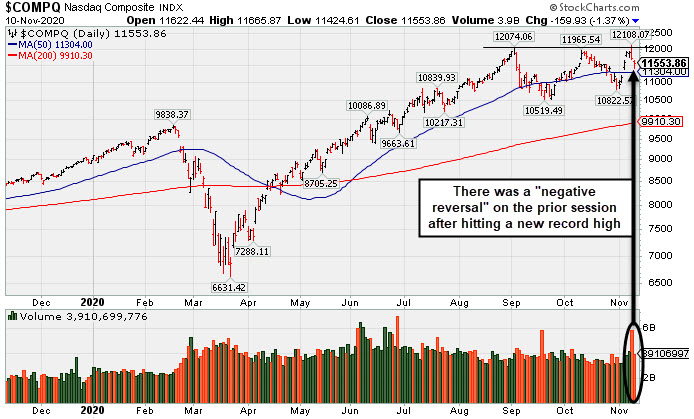 PICTURED: The Nasdaq Composite Index had a "negative reversal" on the prior session after hitting a new record high.
Stocks finished mixed on Tuesday, as a rotation within U.S. equities continued. A day after outperforming growth stocks by the most on record for a single session, value-oriented shares once again rallied amid optimism surrounding COVID-19 vaccine candidates.
Eight of 11 S&P 500 sectors ended in positive territory, with Energy, Consumer Staples and Industrials outperforming. Shares of Boeing (BA +5.20%) rose Tuesday amid speculation that regulators could lift the grounding of its 737 Max fleet as soon as next week. Information Technology and Consumer Discretionary shares lagged with Amazon (AMZN -3.46%) fell after the European Union said it suspects the ecommerce giant violated antitrust regulations. Chipmakers also weighed on the Tech sector, with Advanced Micro Devices (AMD -6.17%) and NVIDIA (NVDA -6.31%) both falling more than 6%. In earnings, D.R. Horton (DHI +9.13%) rose after the homebuilder topped Wall Street earnings expectations, while Beyond Meat (BYND -16.94%) tumbled after the plant-based protein maker missed consensus profit projections.
On the data front, a report showed that NFIB Small Business Optimism remained elevated at 104.0 in October, unchanged from the prior month’s reading. Separately, the jobs openings and turnover survey (JOLTS) showed U.S. job openings increased slightly to 6.4 million in September. Treasuries sold off for a third-straight session, with the yield on the 10-year note up three basis points to 0.95%. |
 Kenneth J. Gruneisen started out as a licensed stockbroker in August 1987, a couple of months prior to the historic stock market crash that took the Dow Jones Industrial Average down -22.6% in a single day. He has published daily fact-based fundamental and technical analysis on high-ranked stocks online for two decades. Through FACTBASEDINVESTING.COM, Kenneth provides educational articles, news, market commentary, and other information regarding proven investment systems that work in good times and bad.
Comments contained in the body of this report are technical opinions only and are not necessarily those of Gruneisen Growth Corp. The material herein has been obtained from sources believed to be reliable and accurate, however, its accuracy and completeness cannot be guaranteed. Our firm, employees, and customers may effect transactions, including transactions contrary to any recommendation herein, or have positions in the securities mentioned herein or options with respect thereto. Any recommendation contained in this report may not be suitable for all investors and it is not to be deemed an offer or solicitation on our part with respect to the purchase or sale of any securities. |
|
 |
Semiconductor Index and Gold & Silver Index Led Group Decliners
Kenneth J. Gruneisen - Passed the CAN SLIM® Master's Exam
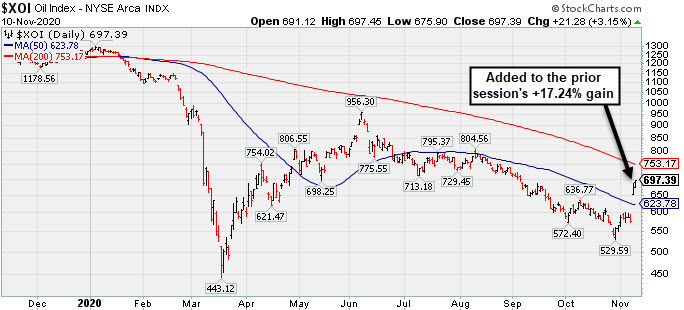
The Semiconductor Index ($SOX -3.01%) led the tech sector lower while the Networking Index ($NWX -0.50%) and Biotech Index ($BTK -0.22%) each edged lower. The Retail Index ($RLX -1.62%) created a drag on the major indices while the Broker/Dealer Index ($XBD +0.89%) helped as it posted a small gain and the Bank Index ($BKX +0.06%) finished flat. The Integrated Oil Index ($XOI +3.15%) posted a big gain while the Oil Services Index ($OSX +0.12%) finished flat. The Gold & Silver Index ($XAU -3.15%) was a standout decliner.
PICTURED: The Integrated Oil Index ($XOI +3.15%) added to the prior session's +17.24% gap up gain while rebounding further above its 50-day moving average (DMA) line toward its 200 DMA line. .
| Oil Services |
$OSX |
34.19 |
+0.04 |
+0.12% |
-56.33% |
| Integrated Oil |
$XOI |
697.39 |
+21.28 |
+3.15% |
-45.11% |
| Semiconductor |
$SOX |
2,422.33 |
-75.25 |
-3.01% |
+30.96% |
| Networking |
$NWX |
594.07 |
-2.97 |
-0.50% |
+1.83% |
| Broker/Dealer |
$XBD |
329.38 |
+2.92 |
+0.89% |
+13.43% |
| Retail |
$RLX |
3,371.61 |
-55.52 |
-1.62% |
+37.66% |
| Gold & Silver |
$XAU |
142.01 |
-4.62 |
-3.15% |
+32.82% |
| Bank |
$BKX |
89.16 |
+0.06 |
+0.06% |
-21.35% |
| Biotech |
$BTK |
5,454.09 |
-11.78 |
-0.22% |
+7.63% |
|
|
|
 |
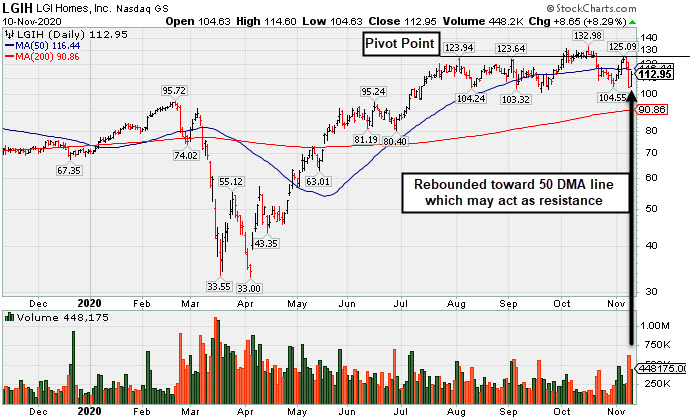
Rebound Toward 50-Day Average Which May Act as Resistance
Kenneth J. Gruneisen - Passed the CAN SLIM® Master's Exam
L G I Homes Inc's (LGIH +$8.65 or +8.29% to $112.95) rebounded toward its 50-day moving average ($116.44) which may now act as resistance. It briefly undercut the prior low as the prior session's big volume-driven loss violated its 50 DMA line and triggered a technical sell signal. Subsequent gains above the 50 DMA line are needed for its outlook to improve. Members were repeatedly cautioned with prior notes - "Recent gains above the new pivot point lacked the +40% above average volume needed to clinch a proper new (or add-on) technical buy signal."
Recently it reported Sep '20 quarterly earnings +27% on +11% sales revenues versus the year ago period. It has an Earnings Per Share Rating of 97. The latest quarter was reassuring after the company had reported Jun '20 quarterly earnings +21% on +4% sales revenues versus the year ago period, breaking a streak of 4 comparisons above the +25% minimum guideline (C criteria).
The prior low ($101.30 on 9/21/20) defines the next important near-term support. LGIH traded up as much as +34% since highlighted in yellow with pivot point cited based on its 2/21/20 high plus 10 cents in the 7/07/20 mid-day report (read here). It was last shown in this FSU section on 10/19/20 under the headline, "Hovering Near High But Recent Gains Lacked Great Volume". Its annual earnings (A criteria) history has been strong. The Building - Residential / Commercial Group Relative Strength Rating is now B- (75). In recent weeks there has been greater leadership (L criteria) noted in the industry group. It has a small supply (S criteria) of only 22.1 million shares in the public float (S criteria). The number of top-rated funds owning its shares rose from 372 in Dec '19 to 414 in Sep '20, and its current Up/Down Volume Ratio of 0.9 is an unbiased indication its shares have been encountering slight distributional pressure over the past 50 days. It has a Timeliness Rating of A and a Sponsorship Rating of D. LGIH completed its IPO at $11 on 11/07/13. Charts courtesy www.stockcharts.com
 |
|
|
Color Codes Explained :
Y - Better candidates highlighted by our
staff of experts.
G - Previously featured
in past reports as yellow but may no longer be buyable under the
guidelines.
***Last / Change / Volume data in this table is the closing quote data***
Symbol/Exchange
Company Name
Industry Group |
PRICE |
CHANGE
(%Change) |
Day High |
Volume
(% DAV)
(% 50 day avg vol) |
52 Wk Hi
% From Hi |
Featured
Date |
Price
Featured |
Pivot Featured |
|
Max Buy |
 CRL
-
NYSE
CRL
-
NYSE
Charles River Labs Intl
DRUGS - Biotechnology
|
$228.74
|
-8.52
-3.59% |
$236.00
|
436,907
124.83% of 50 DAV
50 DAV is 350,000
|
$257.88
-11.30%
|
7/15/2020
|
$192.66
|
PP = $189.95
|
|
MB = $199.45
|
 Most Recent Note - 11/10/2020 6:15:41 PM
G - After a "negative reversal" on the prior session at a new new all-time high it pulled back today and tested support at an upward trendline and its 50 DMA line ($227.92) which previously acted as support. More damaging losses would raise greater concerns and may trigger a worrisome technical sell signal. Reported Sep '20 quarterly earnings +38% on +11% sales revenues versus the year ago period, above the +25% minimum earnings guideline (C criteria).
>>> FEATURED STOCK ARTICLE : Earnings Due; Consolidating Near Prior High and Above 50 DMA Line - 10/27/2020 |
View all notes |
Set NEW NOTE alert |
Company Profile |
SEC
News |
Chart |
Request a new note
C
A
S
I |
AMD
-
NASDAQ
Advanced Micro Devices
ELECTRONICS - Semiconductor - Broad Line
|
$77.99
|
-5.13
-6.17% |
$82.13
|
66,712,087
121.16% of 50 DAV
50 DAV is 55,061,000
|
$94.28
-17.28%
|
8/31/2020
|
$90.42
|
PP = $87.39
|
|
MB = $91.76
|
Most Recent Note - 11/10/2020 6:12:23 PM
G - Gapped down today and slumped back below its 50 DMA line ($80.93) raising concerns. Prior lows in the $73 area define important near term support. On 11/06 and 11/09 prior notes repeatedly cautioned members - "It has not formed a sound base pattern. Subsequent losses and deterioration below the recent low would raise greater concerns and trigger a more worrisome technical sell signal. Faces near-term resistance due to overhead supply up to the $94 level."
>>> FEATURED STOCK ARTICLE : Weak Action Raised Concern While Testing Recent Low - 11/3/2020 |
View all notes |
Set NEW NOTE alert |
Company Profile |
SEC
News |
Chart |
Request a new note
C
A
S
I |
TER
-
NASDAQ
Teradyne Inc
ELECTRONICS - Semiconductor Equipment and Mate
|
$98.15
|
-3.38
-3.33% |
$102.07
|
1,963,619
81.85% of 50 DAV
50 DAV is 2,399,000
|
$105.62
-7.07%
|
10/21/2020
|
$92.22
|
PP = $93.54
|
|
MB = $98.22
|
Most Recent Note - 11/10/2020 6:18:01 PM
G - Pulled back from its all-time high with today's loss breaking a streak of 6 consecutive gains while slumping near its "max buy" level. Reported earnings +53% on +41% sales revenues for the Sep '20 quarter versus the year ago period, its 4th consecutive quarterly comparison with earnings above the +25% minimum earnings guideline (C criteria). Sequential comparisons show encouraging acceleration in its sales revenues growth rate. Its annual earnings (A criteria) history has been strong.
>>> FEATURED STOCK ARTICLE : Challenging All-Time High With Volume-Drive Gain - 10/21/2020 |
View all notes |
Set NEW NOTE alert |
Company Profile |
SEC
News |
Chart |
Request a new note
C
A
S
I |
TREX
-
NYSE
Trex Company Inc
MATERIALS and CONSTRUCTION - General Building Materials
|
$67.75
|
-0.32
-0.47% |
$69.75
|
1,603,387
191.79% of 50 DAV
50 DAV is 836,000
|
$81.23
-16.59%
|
6/26/2020
|
$54.53
|
PP = $66.47
|
|
MB = $69.79
|
Most Recent Note - 11/10/2020 6:20:51 PM
G - Finished in the upper half of its intra-day range today but suffered a 2nd consecutive damaging volume-driven loss while testing the prior low ($63.32 on 9/21/20) noted as the next near-term support level to watch. Recently noted that it reported Sep '20 quarterly earnings +14% on +19% sales revenues versus the year ago period, below the +25% minimum guideline (C criteria) raising fundamental concerns.
>>> FEATURED STOCK ARTICLE : Rebound Above 50-Day Moving Average Helped Technical Stance - 11/4/2020 |
View all notes |
Set NEW NOTE alert |
Company Profile |
SEC
News |
Chart |
Request a new note
C
A
S
I |
LGIH
-
NASDAQ
L G I Homes Inc
Bldg-Resident/Comml
|
$112.95
|
+8.65
8.29% |
$114.60
|
448,175
164.17% of 50 DAV
50 DAV is 273,000
|
$132.98
-15.06%
|
10/1/2020
|
$123.17
|
PP = $124.04
|
|
MB = $130.24
|
Most Recent Note - 11/10/2020 6:03:59 PM
G - Rebounded toward its 50 DMA line ($116) which may act as resistance after a damaging volume-driven loss on the prior session. A rebound above the 50 DMA line is needed for its outlook to improve. Reported Sep '20 quarterly earnings +27% on +11% sales revenues versus the year ago period. See the latest FSU analysis for more details and a new annotated graph.
>>> FEATURED STOCK ARTICLE : Rebound Toward 50-Day Average Which May Act as Resistance - 11/10/2020 |
View all notes |
Set NEW NOTE alert |
Company Profile |
SEC
News |
Chart |
Request a new note
C
A
S
I |
Symbol/Exchange
Company Name
Industry Group |
PRICE |
CHANGE
(%Change) |
Day High |
Volume
(% DAV)
(% 50 day avg vol) |
52 Wk Hi
% From Hi |
Featured
Date |
Price
Featured |
Pivot Featured |
|
Max Buy |
NOW
-
NYSE
Servicenow Inc
Computer Sftwr-Enterprse
|
$481.28
|
-20.68
-4.12% |
$499.68
|
2,497,992
187.96% of 50 DAV
50 DAV is 1,329,000
|
$537.53
-10.46%
|
8/20/2020
|
$453.34
|
PP = $454.79
|
|
MB = $477.53
|
Most Recent Note - 11/10/2020 12:56:35 PM
G - Undercutting its 50 DMA line ($489) with today's 2nd consecutive big volume-driven loss off of its all-time high, testing the prior low ($472 on 11/03/20) noted as important support where a damaging violation raises greater concerns. Recently reported Sep '20 quarterly earnings +22% on +30% sales revenues versus the year ago period, below the +25% minimum guideline (C criteria) of the fact-based investment system.
>>> FEATURED STOCK ARTICLE : Found Prompt Support at 50 DMA Line After Earnings News - 10/29/2020 |
View all notes |
Set NEW NOTE alert |
Company Profile |
SEC
News |
Chart |
Request a new note
C
A
S
I |
VEEV
-
NYSE
Veeva Systems Inc Cl A
Computer Sftwr-Medical
|
$264.15
|
-4.89
-1.82% |
$270.13
|
1,570,141
191.95% of 50 DAV
50 DAV is 818,000
|
$313.99
-15.87%
|
10/6/2020
|
$287.71
|
PP = $298.86
|
|
MB = $313.80
|
Most Recent Note - 11/10/2020 6:23:54 PM
G - Finished in the upper half of its intra-day range today but suffered a 2nd consecutive volume-driven loss violating its 50 DMA line ($283) and undercutting the prior low ($263) noted as important support. Only a prompt rebound above the 50 DMA line would help its outlook improve.
>>> FEATURED STOCK ARTICLE : Recently Slumped Back Below Prior Highs - 10/26/2020 |
View all notes |
Set NEW NOTE alert |
Company Profile |
SEC
News |
Chart |
Request a new note
C
A
S
I |
ALRM
-
NASDAQ
Alarm.com Holdings Inc
Security/Sfty
|
$70.38
|
-3.59
-4.85% |
$75.00
|
545,868
155.08% of 50 DAV
50 DAV is 352,000
|
$79.38
-11.34%
|
11/6/2020
|
$71.88
|
PP = $74.76
|
|
MB = $78.50
|
Most Recent Note - 11/10/2020 6:08:48 PM
Y - Suffered a loss today with above average volume breaking a streak of 6 consecutive gains. After reaching a new all-time high it has been encountering distributional pressure. See the latest FSU analysis for more details and an annotated graph. Previously noted - "Subsequent gains above the pivot point may help clinch a convincing technical buy signal. Reported earnings +32% on +24% sales revenues for the Sep '20 quarter versus the year ago period, an improvement after +3% earnings in the Jun quarter. Prior quarterly comparisons were near or above the +25% minimum earnings guideline (C criteria). Annual earnings (A criteria) growth has been strong, a good match with the fact-based investment system."
>>> FEATURED STOCK ARTICLE : Encountered Distributional Pressure as it Hit a New High - 11/9/2020 |
View all notes |
Set NEW NOTE alert |
Company Profile |
SEC
News |
Chart |
Request a new note
C
A
S
I |
TEAM
-
NASDAQ
Atlassian Corp Plc Cl A
Comp Sftwr-Spec Enterprs
|
$185.66
|
-1.86
-0.99% |
$186.99
|
2,110,404
122.91% of 50 DAV
50 DAV is 1,717,000
|
$216.30
-14.17%
|
10/12/2020
|
$193.77
|
PP = $199.60
|
|
MB = $209.58
|
Most Recent Note - 11/9/2020 5:42:50 PM
G - Slumped back below its 50 DMA line ($188) raising concerns with today's loss and the prior low ($180) defines the next important support level. Reported earnings +7% on +26% sales revenues for the Sep '20 quarter versus the year ago period, well below the +25% minimum earnings guideline (C criteria), raising concerns.
>>> FEATURED STOCK ARTICLE : Weak Technical Action Followed Disappointing Fundamental News - 11/2/2020 |
View all notes |
Set NEW NOTE alert |
Company Profile |
SEC
News |
Chart |
Request a new note
C
A
S
I |
YETI
-
NYSE
Yeti Holdings Inc
Leisure-Products
|
$55.64
|
+4.19
8.14% |
$56.14
|
3,338,715
267.53% of 50 DAV
50 DAV is 1,248,000
|
$62.72
-11.29%
|
11/5/2020
|
$57.25
|
PP = $55.14
|
|
MB = $57.90
|
Most Recent Note - 11/10/2020 1:13:28 PM
Y - Rebounding impressively today. Its 50 DMA line ($49.75) defines near-term support above prior lows. Suffered a big volume-driven loss on he prior session, slumping back below the pivot point and completely negating the recently noted breakout. See the latest FSU analysis for more details and an annotated graph.
>>> FEATURED STOCK ARTICLE : Finished Strong After Breakout Gain Was Noted in Mid-Day Report - 11/5/2020 |
View all notes |
Set NEW NOTE alert |
Company Profile |
SEC
News |
Chart |
Request a new note
C
A
S
I |
Symbol/Exchange
Company Name
Industry Group |
PRICE |
CHANGE
(%Change) |
Day High |
Volume
(% DAV)
(% 50 day avg vol) |
52 Wk Hi
% From Hi |
Featured
Date |
Price
Featured |
Pivot Featured |
|
Max Buy |
AAXN
-
NASDAQ
Axon Enterprise Inc
Security/Sfty
|
$119.00
|
-5.26
-4.23% |
$125.18
|
942,002
157.00% of 50 DAV
50 DAV is 600,000
|
$128.39
-7.31%
|
11/6/2020
|
$122.75
|
PP = $113.00
|
|
MB = $118.65
|
Most Recent Note - 11/10/2020 6:06:43 PM
G - Pulled back with above average volume today after a streak of 5 consecutive gains helped it hit new all-time highs. Bullish action came after reporting Sep '20 quarterly earnings +43% on +27% sales revenues versus the year ago period. It broke out of a cup-with-high-handle base with volume drying up during the handle.
>>> FEATURED STOCK ARTICLE : Breakaway Gap From Cup-With-High-Handle Pattern - 11/6/2020 |
View all notes |
Set NEW NOTE alert |
Company Profile |
SEC
News |
Chart |
Request a new note
C
A
S
I |
|
|
|
THESE ARE NOT BUY RECOMMENDATIONS!
Comments contained in the body of this report are technical
opinions only. The material herein has been obtained
from sources believed to be reliable and accurate, however,
its accuracy and completeness cannot be guaranteed.
This site is not an investment advisor, hence it does
not endorse or recommend any securities or other investments.
Any recommendation contained in this report may not
be suitable for all investors and it is not to be deemed
an offer or solicitation on our part with respect to
the purchase or sale of any securities. All trademarks,
service marks and trade names appearing in this report
are the property of their respective owners, and are
likewise used for identification purposes only.
This report is a service available
only to active Paid Premium Members.
You may opt-out of receiving report notifications
at any time. Questions or comments may be submitted
by writing to Premium Membership Services 665 S.E. 10 Street, Suite 201 Deerfield Beach, FL 33441-5634 or by calling 1-800-965-8307
or 954-785-1121.
|
|
|