You are not logged in.
This means you
CAN ONLY VIEW reports that were published prior to Sunday, February 25, 2024.
You
MUST UPGRADE YOUR MEMBERSHIP if you want to see any current reports.
AFTER MARKET UPDATE - MONDAY, NOVEMBER 9TH, 2020
Previous After Market Report Next After Market Report >>>
|
|
|
|
DOW |
+834.57 |
29,157.97 |
+2.95% |
|
Volume |
1,710,518,153 |
+85% |
|
Volume |
5,793,698,100 |
+40% |
|
NASDAQ |
-190.58 |
11,704.65 |
-1.60% |
|
Advancers |
2,394 |
78% |
|
Advancers |
2,282 |
66% |
|
S&P 500 |
-28.79 |
3,467.31 |
-0.82% |
|
Decliners |
679 |
22% |
|
Decliners |
1,162 |
34% |
|
Russell 2000 |
+60.88 |
1,705.04 |
+3.70% |
|
52 Wk Highs |
345 |
|
|
52 Wk Highs |
401 |
|
|
S&P 600 |
+45.19 |
970.41 |
+4.88% |
|
52 Wk Lows |
12 |
|
|
52 Wk Lows |
26 |
|
|
 |
Major Indices Spiked to New Record Highs
Kenneth J. Gruneisen - Passed the CAN SLIM® Master's Exam
Stocks that stood to benefit from reopening activity surged, sending the Dow 834 points higher and the S&P 500 rallying 1.2%. Meanwhile, the Nasdaq Composite reversed earlier gains, falling 1.5%, as Tech stocks that profited from stay-at-home orders weighed on the benchmark. Small-caps outperformed, with the Russell 2000 index jumping nearly 4%. The reported volume totals were higher than the prior session on the NYSE and on the Nasdaq exchange, indicative of increasing institutional buying demand. Breadth was positive as advancers led decliners by more than a 3-1 margin on the NYSE and by a 2-1 margin on the Nasdaq exchange. There were 153 high-ranked companies from the Leaders List that hit new 52-week highs and were listed on the BreakOuts Page, versus the total of 82 on the prior session. The new 52-week highs totals expanded greatly and easily outnumbered new 52-week lows on the NYSE and on the Nasdaq exchange. The major indices confirmed a new uptrend (M criteria) with Wednesday's solid follow-through day of gains backed by higher volume and more leadership. Investors are reminded to always make buying and selling decisions based based on the strict criteria and rules of the fact-based investment system. 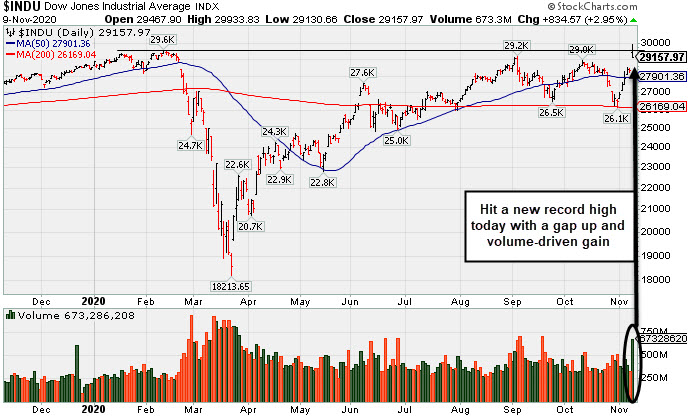 PICTURED: The Dow Jones Industrial Average gapped up and hit a new record high with a big volume-driven gain.
Stocks finished mostly higher on Monday, as investors evaluated optimistic vaccine data. Results from a late-stage study revealed a vaccine candidate from Pfizer (PFE +7.69%) and BioNTech (BNTX +13.91%) showed a 90% efficacy rate in preventing the COVID-19 virus.
Clarity on the political front also buoyed sentiment, with the Associated Press and other media outlets calling the results of the U.S. Presidential election in favor of former Vice President Joe Biden over the weekend. The CBOE Market Volatility Index (VIX), commonly referred to as Wall Street’s fear gauge, fell to the lowest level since late August. Amid the perceived risk-on mood, Treasuries declined. The yield on the 10-year note jumped 10 basis points to 0.92%, the highest level since March. In commodities, WTI crude surged 7.8% to $40.03/barrel, while gold slipped 4.5% to $1864.70/ounce amid a stronger dollar.
Seven of 11 S&P 500 sectors ended in positive territory, with Energy and Financials pacing the gains amid a jump in crude prices and Treasury yields. Industrials also outperformed, with shares of the major U.S. airliners jumping double digits. The Consumer Discretionary group lagged the most, with Amazon (AMZN -5.06%) falling. In other corporate news, Biogen (BIIB -28.11%) plunged after reports showed a U.S. FDA advisory panel criticized the efficacy of the company’s experimental Alzheimer’s disease therapy. |
 Kenneth J. Gruneisen started out as a licensed stockbroker in August 1987, a couple of months prior to the historic stock market crash that took the Dow Jones Industrial Average down -22.6% in a single day. He has published daily fact-based fundamental and technical analysis on high-ranked stocks online for two decades. Through FACTBASEDINVESTING.COM, Kenneth provides educational articles, news, market commentary, and other information regarding proven investment systems that work in good times and bad.
Comments contained in the body of this report are technical opinions only and are not necessarily those of Gruneisen Growth Corp. The material herein has been obtained from sources believed to be reliable and accurate, however, its accuracy and completeness cannot be guaranteed. Our firm, employees, and customers may effect transactions, including transactions contrary to any recommendation herein, or have positions in the securities mentioned herein or options with respect thereto. Any recommendation contained in this report may not be suitable for all investors and it is not to be deemed an offer or solicitation on our part with respect to the purchase or sale of any securities. |
|
 |
Financial and Energy Linked Groups Posted Big Gains
Kenneth J. Gruneisen - Passed the CAN SLIM® Master's Exam
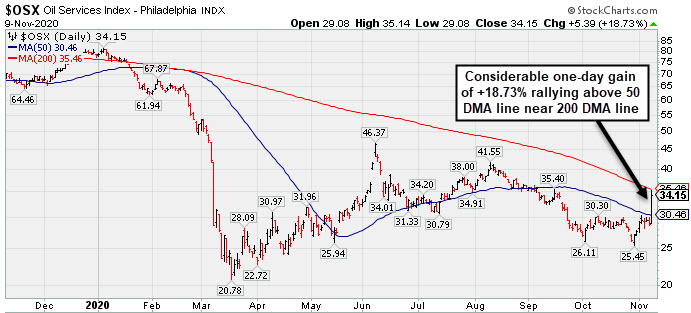
The Bank Index ($BKX +13.47%) and Broker/Dealer Index ($XBD +5.25%) posted big and influential gains while the Retail Index ($RLX -3.30%) created a drag on the major indices. The Oil Services Index ($OSX +18.73%) and Integrated Oil Index ($XOI +17.24%) posted gigantic one-day gains, meanwhile, the Gold & Silver Index ($XAU -5.63%) was a standout decliner. The Networking Index ($NWX +2.38%) posted a gain and led the tech sector while the Biotech Index ($BTK -0.28%) edged lower and the Semiconductor Index ($SOX -1.23%) fell harder.
PICTURED: The Oil Services Index ($OSX +18.73%) posted a considerable one-day gain rallying above its 50-day moving average (DMA) line and near its 200 DMA line.
| Oil Services |
$OSX |
34.15 |
+5.39 |
+18.73% |
-56.39% |
| Integrated Oil |
$XOI |
676.11 |
+99.41 |
+17.24% |
-46.79% |
| Semiconductor |
$SOX |
2,498.27 |
-31.00 |
-1.23% |
+35.07% |
| Networking |
$NWX |
597.04 |
+13.86 |
+2.38% |
+2.34% |
| Broker/Dealer |
$XBD |
326.46 |
+16.30 |
+5.25% |
+12.43% |
| Retail |
$RLX |
3,427.13 |
-116.87 |
-3.30% |
+39.92% |
| Gold & Silver |
$XAU |
146.63 |
-8.75 |
-5.63% |
+37.14% |
| Bank |
$BKX |
89.10 |
+10.58 |
+13.47% |
-21.40% |
| Biotech |
$BTK |
5,465.87 |
-15.44 |
-0.28% |
+7.86% |
|
|
|
 |
Encountered Distributional Pressure as it Hit a New High
Kenneth J. Gruneisen - Passed the CAN SLIM® Master's Exam
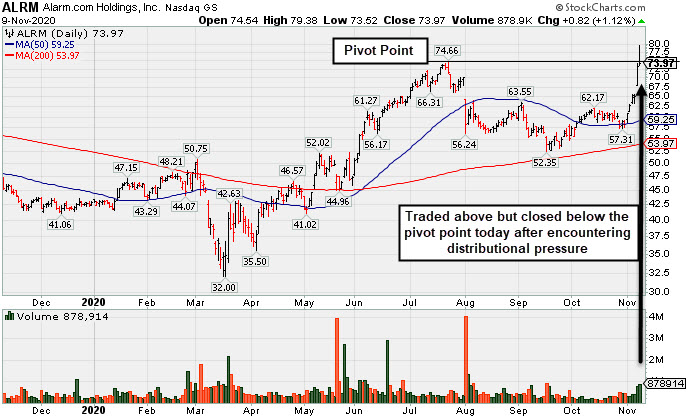
Alarm.com Holdings Inc (ALRM +$0.82 or +1.12% to $73.97) finished the session well off of earlier highs after gapping up and rallying above the pivot point cited while hitting a new all-time high. The day's action was indicative of distributional pressure. Subsequent volume-driven gains and a close above the pivot point may help clinch a convincing technical buy signal.
Recently ALRM reported earnings +32% on +24% sales revenues for the Sep '20 quarter versus the year ago period, an improvement after +3% earnings in the Jun quarter. Prior quarterly comparisons were near or above the +25% minimum earnings guideline (C criteria). Annual earnings (A criteria) growth has been strong, a good match with the fact-based investment system.
It went through a deep and choppy consolidation since last shown in this FSU section on 5/13/19 with an annotated graph under the headline, "Technical and Fundamental Concerns Both Sound Alarms". Annual earnings (A criteria) growth has been strong after a downturn in FY '15.
The number of top-rated funds owning its shares rose from 262 in Mar '18 to 402 in Sep '20, a reassuring sign concerning the I criteria. Its current Up/Down Volume Ratio of 1.2 is an unbiased indication its shares have been under accumulation over the past 50 days. It has earned a Timeliness Rating of B and a Sponsorship Rating of D.
Charts courtesy of www.stockcharts.com
 |
|
|
Color Codes Explained :
Y - Better candidates highlighted by our
staff of experts.
G - Previously featured
in past reports as yellow but may no longer be buyable under the
guidelines.
***Last / Change / Volume data in this table is the closing quote data***
Symbol/Exchange
Company Name
Industry Group |
PRICE |
CHANGE
(%Change) |
Day High |
Volume
(% DAV)
(% 50 day avg vol) |
52 Wk Hi
% From Hi |
Featured
Date |
Price
Featured |
Pivot Featured |
|
Max Buy |
 CRL
-
NYSE
CRL
-
NYSE
Charles River Labs Intl
DRUGS - Biotechnology
|
$237.26
|
-13.40
-5.35% |
$257.88
|
522,547
152.35% of 50 DAV
50 DAV is 343,000
|
$254.45
-6.76%
|
7/15/2020
|
$192.66
|
PP = $189.95
|
|
MB = $199.45
|
 Most Recent Note - 11/9/2020 5:44:48 PM
G - Hit another new all-time high today but reversed into the red for a big volume-driven loss. Found prompt support near its 50 DMA line ($227) during prior consolidations. Reported Sep '20 quarterly earnings +38% on +11% sales revenues versus the year ago period, above the +25% minimum earnings guideline (C criteria).
>>> FEATURED STOCK ARTICLE : Earnings Due; Consolidating Near Prior High and Above 50 DMA Line - 10/27/2020 |
View all notes |
Set NEW NOTE alert |
Company Profile |
SEC
News |
Chart |
Request a new note
C
A
S
I |
AMD
-
NASDAQ
Advanced Micro Devices
ELECTRONICS - Semiconductor - Broad Line
|
$83.12
|
-2.76
-3.21% |
$87.05
|
58,385,977
106.73% of 50 DAV
50 DAV is 54,704,000
|
$94.28
-11.84%
|
8/31/2020
|
$90.42
|
PP = $87.39
|
|
MB = $91.76
|
Most Recent Note - 11/9/2020 5:47:24 PM
G - There was a "negative reversal" today breaking a streak of 4 consecutive gains. Below its 50 DMA line ($81) the prior lows in the $73 area define important near term support. It has not formed a sound base pattern. Subsequent losses and deterioration below the recent low would raise greater concerns and trigger a more worrisome technical sell signal. Faces near-term resistance due to overhead supply up to the $94 level.
>>> FEATURED STOCK ARTICLE : Weak Action Raised Concern While Testing Recent Low - 11/3/2020 |
View all notes |
Set NEW NOTE alert |
Company Profile |
SEC
News |
Chart |
Request a new note
C
A
S
I |
TER
-
NASDAQ
Teradyne Inc
ELECTRONICS - Semiconductor Equipment and Mate
|
$101.53
|
+1.27
1.27% |
$105.62
|
2,207,027
92.15% of 50 DAV
50 DAV is 2,395,000
|
$100.74
0.78%
|
10/21/2020
|
$92.22
|
PP = $93.54
|
|
MB = $98.22
|
Most Recent Note - 11/9/2020 5:52:01 PM
G - Hit yet another new all-time high and rose well above its "max buy" level with today's 6th consecutive gain backed by below or near average volume, getting more extended from the prior base. Reported earnings +53% on +41% sales revenues for the Sep '20 quarter versus the year ago period, its 4th consecutive quarterly comparison with earnings above the +25% minimum earnings guideline (C criteria). Sequential comparisons show encouraging acceleration in its sales revenues growth rate. Its annual earnings (A criteria) history has been strong.
>>> FEATURED STOCK ARTICLE : Challenging All-Time High With Volume-Drive Gain - 10/21/2020 |
View all notes |
Set NEW NOTE alert |
Company Profile |
SEC
News |
Chart |
Request a new note
C
A
S
I |
TREX
-
NYSE
Trex Company Inc
MATERIALS and CONSTRUCTION - General Building Materials
|
$68.07
|
-11.54
-14.50% |
$80.71
|
2,695,152
339.01% of 50 DAV
50 DAV is 795,000
|
$81.23
-16.20%
|
6/26/2020
|
$54.53
|
PP = $66.47
|
|
MB = $69.79
|
Most Recent Note - 11/9/2020 5:32:09 PM
G - Violated its 50 DMA line ($73) and triggered a technical sell signal raising concerns with today's big volume-driven loss. Also undercut the prior low ($68.54 on 10/30/20) leaving the earlier low ($63.32 on 9/21/20) as the next near-term support level to watch. Recently noted that it reported Sep '20 quarterly earnings +14% on +19% sales revenues versus the year ago period, below the +25% minimum guideline (C criteria) raising fundamental concerns.
>>> FEATURED STOCK ARTICLE : Rebound Above 50-Day Moving Average Helped Technical Stance - 11/4/2020 |
View all notes |
Set NEW NOTE alert |
Company Profile |
SEC
News |
Chart |
Request a new note
C
A
S
I |
LGIH
-
NASDAQ
L G I Homes Inc
Bldg-Resident/Comml
|
$104.30
|
-13.04
-11.11% |
$121.29
|
620,706
232.47% of 50 DAV
50 DAV is 267,000
|
$132.98
-21.57%
|
10/1/2020
|
$123.17
|
PP = $124.04
|
|
MB = $130.24
|
Most Recent Note - 11/9/2020 5:38:23 PM
G - Slumped back below its 50 DMA line ($116) and undercut the prior low triggering a technical sell signal with today's big volume-driven loss. Reported Sep '20 quarterly earnings +27% on +11% sales revenues versus the year ago period. Members were cautioned with recent notes - "Recent gains above the new pivot point lacked the +40% above average volume needed to clinch a proper new (or add-on) technical buy signal."
>>> FEATURED STOCK ARTICLE : Hovering Near High But Recent Gains Lacked Great Volume - 10/19/2020 |
View all notes |
Set NEW NOTE alert |
Company Profile |
SEC
News |
Chart |
Request a new note
C
A
S
I |
Symbol/Exchange
Company Name
Industry Group |
PRICE |
CHANGE
(%Change) |
Day High |
Volume
(% DAV)
(% 50 day avg vol) |
52 Wk Hi
% From Hi |
Featured
Date |
Price
Featured |
Pivot Featured |
|
Max Buy |
NOW
-
NYSE
Servicenow Inc
Computer Sftwr-Enterprse
|
$501.96
|
-33.22
-6.21% |
$528.21
|
2,396,923
183.95% of 50 DAV
50 DAV is 1,303,000
|
$537.53
-6.62%
|
8/20/2020
|
$453.34
|
PP = $454.79
|
|
MB = $477.53
|
Most Recent Note - 11/9/2020 5:40:14 PM
G - Gapped down today retreating toward its 50 DMA line ($489) with today's big volume-driven loss. Prior low ($472 on 11/03/20) defines the next important support where any violations would raise greater concerns. Recently reported Sep '20 quarterly earnings +22% on +30% sales revenues versus the year ago period, below the +25% minimum guideline (C criteria) of the fact-based investment system.
>>> FEATURED STOCK ARTICLE : Found Prompt Support at 50 DMA Line After Earnings News - 10/29/2020 |
View all notes |
Set NEW NOTE alert |
Company Profile |
SEC
News |
Chart |
Request a new note
C
A
S
I |
VEEV
-
NYSE
Veeva Systems Inc Cl A
Computer Sftwr-Medical
|
$269.04
|
-30.55
-10.20% |
$298.42
|
1,497,297
182.15% of 50 DAV
50 DAV is 822,000
|
$313.99
-14.32%
|
10/6/2020
|
$287.71
|
PP = $298.86
|
|
MB = $313.80
|
Most Recent Note - 11/9/2020 5:34:16 PM
G - Violated its 50 DMA line ($283) today as another damaging loss with heavy volume triggered a technical sell signal. Fundamentals remain strong. Prior low ($263) defines the next important support level.
>>> FEATURED STOCK ARTICLE : Recently Slumped Back Below Prior Highs - 10/26/2020 |
View all notes |
Set NEW NOTE alert |
Company Profile |
SEC
News |
Chart |
Request a new note
C
A
S
I |
ALRM
-
NASDAQ
Alarm.com Holdings Inc
Security/Sfty
|
$73.97
|
+0.82
1.12% |
$79.38
|
878,914
258.50% of 50 DAV
50 DAV is 340,000
|
$74.66
-0.92%
|
11/6/2020
|
$71.88
|
PP = $74.76
|
|
MB = $78.50
|
Most Recent Note - 11/9/2020 5:28:32 PM
Y - Traded up but closed below the pivot point cited after hitting a new all-time high and encountering distributional pressure. See the latest FSU analysis for more details and a new annotated graph. Previously noted - "Subsequent gains above the pivot point may help clinch a convincing technical buy signal. Reported earnings +32% on +24% sales revenues for the Sep '20 quarter versus the year ago period, an improvement after +3% earnings in the Jun quarter. Prior quarterly comparisons were near or above the +25% minimum earnings guideline (C criteria). Annual earnings (A criteria) growth has been strong, a good match with the fact-based investment system."
>>> FEATURED STOCK ARTICLE : Encountered Distributional Pressure as it Hit a New High - 11/9/2020 |
View all notes |
Set NEW NOTE alert |
Company Profile |
SEC
News |
Chart |
Request a new note
C
A
S
I |
TEAM
-
NASDAQ
Atlassian Corp Plc Cl A
Comp Sftwr-Spec Enterprs
|
$187.52
|
-10.66
-5.38% |
$199.16
|
1,615,395
94.03% of 50 DAV
50 DAV is 1,718,000
|
$216.30
-13.31%
|
10/12/2020
|
$193.77
|
PP = $199.60
|
|
MB = $209.58
|
Most Recent Note - 11/9/2020 5:42:50 PM
G - Slumped back below its 50 DMA line ($188) raising concerns with today's loss and the prior low ($180) defines the next important support level. Reported earnings +7% on +26% sales revenues for the Sep '20 quarter versus the year ago period, well below the +25% minimum earnings guideline (C criteria), raising concerns.
>>> FEATURED STOCK ARTICLE : Weak Technical Action Followed Disappointing Fundamental News - 11/2/2020 |
View all notes |
Set NEW NOTE alert |
Company Profile |
SEC
News |
Chart |
Request a new note
C
A
S
I |
YETI
-
NYSE
Yeti Holdings Inc
Leisure-Products
|
$51.45
|
-7.30
-12.43% |
$59.75
|
4,121,552
348.69% of 50 DAV
50 DAV is 1,182,000
|
$62.72
-17.97%
|
11/5/2020
|
$57.25
|
PP = $55.14
|
|
MB = $57.90
|
Most Recent Note - 11/9/2020 5:36:25 PM
Y - Suffered a big volume-driven loss today slumping back below the pivot point and completely negating the recently noted breakout raising concerns. See the latest FSU analysis for more details and an annotated graph.
>>> FEATURED STOCK ARTICLE : Finished Strong After Breakout Gain Was Noted in Mid-Day Report - 11/5/2020 |
View all notes |
Set NEW NOTE alert |
Company Profile |
SEC
News |
Chart |
Request a new note
C
A
S
I |
Symbol/Exchange
Company Name
Industry Group |
PRICE |
CHANGE
(%Change) |
Day High |
Volume
(% DAV)
(% 50 day avg vol) |
52 Wk Hi
% From Hi |
Featured
Date |
Price
Featured |
Pivot Featured |
|
Max Buy |
AAXN
-
NASDAQ
Axon Enterprise Inc
Security/Sfty
|
$124.26
|
+1.67
1.36% |
$128.39
|
942,799
159.80% of 50 DAV
50 DAV is 590,000
|
$127.49
-2.53%
|
11/6/2020
|
$122.75
|
PP = $113.00
|
|
MB = $118.65
|
Most Recent Note - 11/9/2020 5:49:54 PM
G - Held its ground stubbornly today and posted another volume-driven gain above its "max buy" level and the color code is changed to green. Finished in the upper half of its intra-day range after hitting a new all-time high with a "breakaway gap" and volume-driven gain noted on the prior session triggering a technical buy signal. Bullish action came after reporting Sep '20 quarterly earnings +43% on +27% sales revenues versus the year ago period. It formed a cup-with-high-handle base with volume drying up during the handle. See the latest FSU analysis for more details and an annotated graph.
>>> FEATURED STOCK ARTICLE : Breakaway Gap From Cup-With-High-Handle Pattern - 11/6/2020 |
View all notes |
Set NEW NOTE alert |
Company Profile |
SEC
News |
Chart |
Request a new note
C
A
S
I |
|
|
|
THESE ARE NOT BUY RECOMMENDATIONS!
Comments contained in the body of this report are technical
opinions only. The material herein has been obtained
from sources believed to be reliable and accurate, however,
its accuracy and completeness cannot be guaranteed.
This site is not an investment advisor, hence it does
not endorse or recommend any securities or other investments.
Any recommendation contained in this report may not
be suitable for all investors and it is not to be deemed
an offer or solicitation on our part with respect to
the purchase or sale of any securities. All trademarks,
service marks and trade names appearing in this report
are the property of their respective owners, and are
likewise used for identification purposes only.
This report is a service available
only to active Paid Premium Members.
You may opt-out of receiving report notifications
at any time. Questions or comments may be submitted
by writing to Premium Membership Services 665 S.E. 10 Street, Suite 201 Deerfield Beach, FL 33441-5634 or by calling 1-800-965-8307
or 954-785-1121.
|
|
|