You are not logged in.
This means you
CAN ONLY VIEW reports that were published prior to Sunday, February 25, 2024.
You
MUST UPGRADE YOUR MEMBERSHIP if you want to see any current reports.
AFTER MARKET UPDATE - THURSDAY, NOVEMBER 8TH, 2018
Previous After Market Report Next After Market Report >>>
|
|
|
|
DOW |
+10.92 |
26,191.22 |
+0.04% |
|
Volume |
825,393,790 |
-7% |
|
Volume |
2,440,695,100 |
-8% |
|
NASDAQ |
-39.87 |
7,530.88 |
-0.53% |
|
Advancers |
1,408 |
47% |
|
Advancers |
1,408 |
46% |
|
S&P 500 |
-7.06 |
2,806.83 |
-0.25% |
|
Decliners |
1,584 |
53% |
|
Decliners |
1,653 |
54% |
|
Russell 2000 |
-3.95 |
1,578.21 |
-0.25% |
|
52 Wk Highs |
75 |
|
|
52 Wk Highs |
75 |
|
|
S&P 600 |
-2.53 |
989.53 |
-0.26% |
|
52 Wk Lows |
69 |
|
|
52 Wk Lows |
92 |
|
|
 |
Major Indices Ended Mixed With Lighter Volume on Exchanges
Kenneth J. Gruneisen - Passed the CAN SLIM® Master's Exam
Stocks finished mixed Thursday. The Dow added 10 points to 26191 while the S&P 500 was down 7 points to 2806. The Nasdaq Composite declined 39 points to 7530. The volume totals reported were lighter on the NYSE and on the Nasdaq exchange versus the prior session. Decliners led advancers by a narrow 8-7 margin on the NYSE and on the Nasdaq exchange. There were 51 high-ranked companies from the Leaders List that made new 52-week highs and were listed on the BreakOuts Page, versus the total of 46 on the prior session. New 52-week highs outnumbered new 52-week lows for a 2nd consecutive session on the NYSE, but new lows still outnumbered new 52-week highs on the Nasdaq exchange. Technically, the bullish action marked a shift in the market direction (M criteria), ending the latest correction, and moving back to a confirmed uptrend under the fact-based investment system. The Featured Stocks Page provides the most timely analysis on high-ranked leaders. Charts used courtesy of www.stockcharts.com
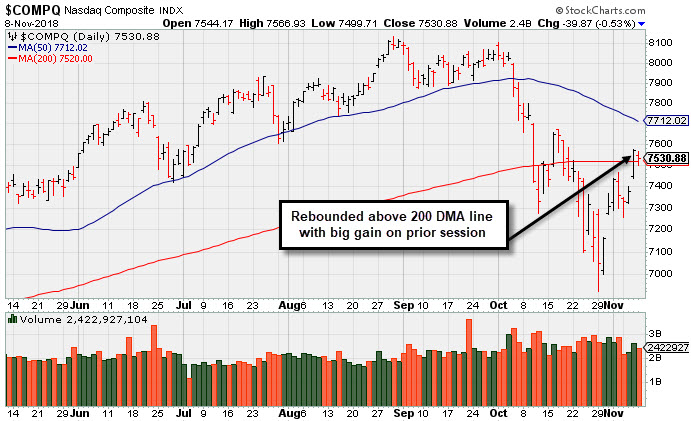
PICTURED: The Nasdaq Composite Index pulled back on Thursday. It and the other major indices posted gains of greater than +2% on Wednesday (Day 7) with higher volume on the exchanges coupled with a greater number of stocks hitting new 52-week highs. The solid follow-through day was noted as a reassuring sign, however, new buying efforts are only justified in stocks meeting all of the fundamental and technical criteria of the fact-based investment system.
The major averages were mixed as equity markets were unable to sustain the sharp rally from the prior session. Monetary policy garnered an outsized focus today as the Federal Reserve elected to keep the benchmark rate unchanged at the end of its two day FOMC meeting. In a prepared statement, the Fed indicated economic activity continues to grow at a strong pace but did note that business investment has cooled. On the data front, initial jobless claims came in at 214,000 in the most recent week.
Six of 11 S&P 500 sectors finished lower with Financials the notable outperformer. The Energy group declined 2.3% and weighed heavily on the major averages as crude oil prices have now fallen 21% from their 52-week high. The Communications group also underperformed as Facebook (FB -2.42%) and Alphabet (GOOGL -1.23%) both fell. The Technology sector provided a headwind to the market as Qualcomm (QCOM -8.16%) sank after the company revealed weaker than expected forward guidance.
Treasuries were weaker with the yield on the 10-year note up two basis points to 3.24%. In commodities, WTI crude dropped 1.8% to $60.57/barrel, and officially moved into “bear-market territory.” COMEX gold was off 0.4% to $1,224.40/ounce amid a stronger dollar. |
 Kenneth J. Gruneisen started out as a licensed stockbroker in August 1987, a couple of months prior to the historic stock market crash that took the Dow Jones Industrial Average down -22.6% in a single day. He has published daily fact-based fundamental and technical analysis on high-ranked stocks online for two decades. Through FACTBASEDINVESTING.COM, Kenneth provides educational articles, news, market commentary, and other information regarding proven investment systems that work in good times and bad.
Comments contained in the body of this report are technical opinions only and are not necessarily those of Gruneisen Growth Corp. The material herein has been obtained from sources believed to be reliable and accurate, however, its accuracy and completeness cannot be guaranteed. Our firm, employees, and customers may effect transactions, including transactions contrary to any recommendation herein, or have positions in the securities mentioned herein or options with respect thereto. Any recommendation contained in this report may not be suitable for all investors and it is not to be deemed an offer or solicitation on our part with respect to the purchase or sale of any securities. |
|
 |
Retail and Financial Groups Posted Small Gains
Kenneth J. Gruneisen - Passed the CAN SLIM® Master's Exam
The Retail Index ($RLX +0.21%) and Bank Index ($BKX +0.35%) posted small gains while the Broker/Dealer Index ($XBD +0.09%) finished flat on Thursday. The tech sector had a negative bias as the Semiconductor Index ($SOX -0.42%), Biotech Index ($BTK -1.08%), and the Networking Index ($NWX -1.55%) ended unanimously lower. The Integrated Oil Index ($XOI -2.80%) and the Oil Services Index ($OSX -3.63%) both were standout decliners. The Gold & Silver Index ($XAU -0.30%) also edged lower.
Charts courtesy of www.stockcharts.com
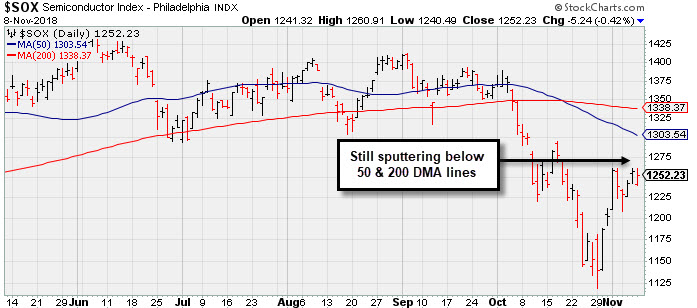 PICTURED: The Semiconductor Index ($SOX -0.42%) is still sputtering below its 200-day and 50-day moving average (DMA) lines.
| Oil Services |
$OSX |
120.04 |
-4.52 |
-3.63% |
-19.73% |
| Integrated Oil |
$XOI |
1,367.61 |
-39.39 |
-2.80% |
+2.40% |
| Semiconductor |
$SOX |
1,252.23 |
-5.24 |
-0.42% |
-0.07% |
| Networking |
$NWX |
525.60 |
-8.27 |
-1.55% |
+7.15% |
| Broker/Dealer |
$XBD |
273.03 |
+0.23 |
+0.09% |
+2.94% |
| Retail |
$RLX |
2,245.24 |
+4.76 |
+0.21% |
+29.50% |
| Gold & Silver |
$XAU |
65.39 |
-0.20 |
-0.30% |
-23.31% |
| Bank |
$BKX |
101.85 |
+0.35 |
+0.34% |
-4.55% |
| Biotech |
$BTK |
4,821.54 |
-52.62 |
-1.08% |
+14.19% |
|
|
|
 |
Volume Heavy Behind Rally to New High
Kenneth J. Gruneisen - Passed the CAN SLIM® Master's Exam
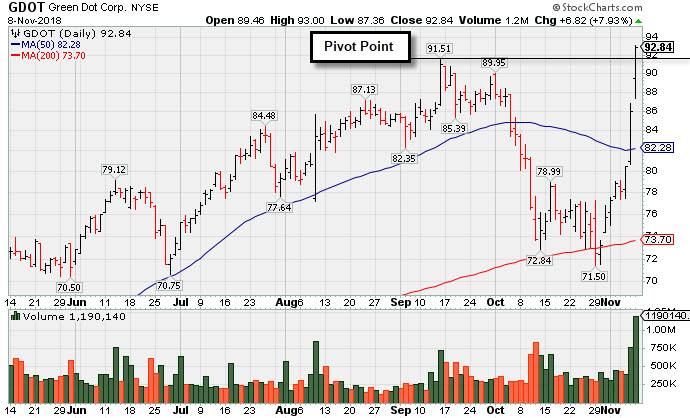
Green Dot Corp Cl A (GDOT +$6.82 or +7.93% to $92.84) finished strong after highlighted in yellow with pivot point cited based on its 9/14/18 high plus 10 cents in the earlier mid-day report (read here). The big gain with volume +213% above average and close above the pivot point clinched a technical buy signal. It hit a new all-time high with today's 3rd consecutive gain as it rallied straight up from the bottom of an 8-week base during which its 200-day moving average (DMA) line acted as support.
It reported earnings +74% on +14% sales revenues for the Sep '18 quarter versus the year ago period. Quarterly comparisons have shown strong earnings increases above the +25% minimum guideline (C criteria) with strong sales revenues growth. Its small supply of only 52.6 million outstanding shares (S criteria) can contribute to greater price volatility in the event of institutional buying or selling. Annual earnings (A criteria) history has been strong after a small downturn in FY '15.
The number of top-rated funds owning its shares rose from 455 in Dec '17 to 510 in Sep '18, a reassuring sign concerning the I criteria. It has earned a B Timeliness rating and a B Sponsorship Rating. The current Up/Down Volume ration of 1.1 is an unbiased indication its shares have been under slight accumulation over the past 50 days.
Charts courtesy of www.stockcharts.com
|
|
|
Color Codes Explained :
Y - Better candidates highlighted by our
staff of experts.
G - Previously featured
in past reports as yellow but may no longer be buyable under the
guidelines.
***Last / Change / Volume data in this table is the closing quote data***
Symbol/Exchange
Company Name
Industry Group |
PRICE |
CHANGE
(%Change) |
Day High |
Volume
(% DAV)
(% 50 day avg vol) |
52 Wk Hi
% From Hi |
Featured
Date |
Price
Featured |
Pivot Featured |
|
Max Buy |
MPX
-
NYSE
Marine Products Corp
AUTOMOTIVE - Recreational Vehicles
|
$22.17
|
+0.88
4.13% |
$22.80
|
72,384
176.55% of 50 DAV
50 DAV is 41,000
|
$24.82
-10.68%
|
10/24/2018
|
$23.00
|
PP = $24.92
|
|
MB = $26.17
|
 Most Recent Note - 11/8/2018 12:09:46 PM
Y - Color code is changed to yellow after rebounding above its 50 DMA line ($21.86) today helped its outlook improve. Very little resistance remains due to overhead supply up to the $24 level. Subsequent gains above the pivot point backed by at least +40% above average volume may trigger a technical buy signal.
>>> FEATURED STOCK ARTICLE : Weak Finish Amid Widely Negative Market Environment - 10/24/2018 |
View all notes |
Set NEW NOTE alert |
Company Profile |
SEC
News |
Chart |
Request a new note
C
A
S
I |
GMED
-
NYSE
Globus Medical Inc Cl A
CHEMICALS - Specialty Chemicals
|
$57.44
|
+0.61
1.07% |
$57.83
|
807,808
116.40% of 50 DAV
50 DAV is 694,000
|
$57.55
-0.19%
|
9/26/2018
|
$56.11
|
PP = $57.65
|
|
MB = $60.53
|
Most Recent Note - 11/7/2018 5:09:19 PM
Y - Perched near its all-time high and its color code is changed to yellow. Due to report earnings after the market close on Thursday, November 8th, 2018. Volume and volatility often increase near earnings news. Its 50 DMA line ($53.26) and 200 DMA line ($51.52) define near-term support. Subsequent gains above the pivot point backed by more than +40% above average volume are needed to trigger a proper technical buy signal.
>>> FEATURED STOCK ARTICLE : Consolidating -5.2% Off 52-Week High Ahead of Earnings News - 11/5/2018 |
View all notes |
Set NEW NOTE alert |
Company Profile |
SEC
News |
Chart |
Request a new note
C
A
S
I |
ZBRA
-
NASDAQ
Zebra Tech Corp Cl A
COMPUTER HARDWARE - Computer Peripherals
|
$182.48
|
+2.24
1.24% |
$184.71
|
605,979
143.26% of 50 DAV
50 DAV is 423,000
|
$184.75
-1.23%
|
11/6/2018
|
$170.41
|
PP = $179.57
|
|
MB = $188.55
|
Most Recent Note - 11/8/2018 5:27:25 PM
Y - Posted a 3rd consecutive volume-driven gain clinching a convincing technical buy signal as it rallied and closed above the pivot point. Volume and volatility often increase near earnings news. Reported Sep '18 earnings +54% on +17% sales revenues, continuing its strong earnings track record. See the latest FSU analysis for more details and an annotated graph.
>>> FEATURED STOCK ARTICLE : Hit New High Following Another Strong Earnings Increase - 11/6/2018 |
View all notes |
Set NEW NOTE alert |
Company Profile |
SEC
News |
Chart |
Request a new note
C
A
S
I |
CME
-
NASDAQ
C M E Group Inc
DIVERSIFIED SERVICES - Business/Management Services
|
$189.43
|
+0.74
0.39% |
$189.81
|
2,172,809
126.18% of 50 DAV
50 DAV is 1,722,000
|
$188.74
0.37%
|
10/4/2018
|
$179.29
|
PP = $177.45
|
|
MB = $186.32
|
Most Recent Note - 11/7/2018 5:15:40 PM
G - Hit yet another new all-time high and rose further above its "max buy" level with above average volume behind today's 9th consecutive small gain. Found support above its 50 DMA line ($177) after recently reporting earnings +22% on +2% sales revenues for the Sep '18 quarter, below the +25% minimum earnings guideline (C criteria), raising fundamental concerns. The 50 DMA line and prior low ($170.04 on 9/28/18) define important near-term support.
>>> FEATURED STOCK ARTICLE : Perched Near High After Latest Earnings Report Below +25% Minimum - 10/26/2018 |
View all notes |
Set NEW NOTE alert |
Company Profile |
SEC
News |
Chart |
Request a new note
C
A
S
I |
GDOT
-
NYSE
Green Dot Corp Cl A
FINANCIAL SERVICES - Credit Services
|
$92.84
|
+6.82
7.93% |
$93.00
|
1,190,140
313.19% of 50 DAV
50 DAV is 380,000
|
$91.51
1.45%
|
11/8/2018
|
$90.35
|
PP = $91.61
|
|
MB = $96.19
|
Most Recent Note - 11/8/2018 5:14:27 PM
Y - Finished strong after highlighted in yellow with pivot point cited based on its 9/14/18 high plus 10 cents in the earlier mid-day report. The big gain and strong close above the pivot point backed by +213% above average volume clinched a technical buy signal as it hit a new all-time high. Rallied straight up from the bottom of an 8-week base during which its 200 DMA line acted as support. Reported earnings +74% on +14% sales revenues for the Sep '18 quarter. Recent quarterly comparisons show strong earnings increases with strong sales revenues growth. Its small supply of only 52.6 million outstanding shares (S criteria) can contribute to greater price volatility in the event of institutional buying or selling. Annual earnings (A criteria) history has been strong after a small downturn in FY '15. See the latest FSU analysis for more details and a new annotated graph.
>>> FEATURED STOCK ARTICLE : Volume Heavy Behind Rally to New High - 11/8/2018 |
View all notes |
Set NEW NOTE alert |
Company Profile |
SEC
News |
Chart |
Request a new note
C
A
S
I |
Symbol/Exchange
Company Name
Industry Group |
PRICE |
CHANGE
(%Change) |
Day High |
Volume
(% DAV)
(% 50 day avg vol) |
52 Wk Hi
% From Hi |
Featured
Date |
Price
Featured |
Pivot Featured |
|
Max Buy |
HZO
-
NYSE
Marinemax Inc
SPECIALTY RETAIL - Specialty Retail, Other
|
$25.00
|
+0.98
4.08% |
$25.24
|
407,321
125.72% of 50 DAV
50 DAV is 324,000
|
$26.11
-4.25%
|
11/2/2018
|
$25.10
|
PP = $25.15
|
|
MB = $26.41
|
Most Recent Note - 11/7/2018 1:12:04 PM
Y - Abruptly retreated from its 52-week high and slumped back into the prior base raising concerns with today's big loss after an impressive streak of 7 consecutive volume-driven gains. Highlighted in yellow with pivot point cited based on its 6/07/18 high plus 10 cents in the 11/02/18 mid-day report. New buying efforts are discouraged until a convincing follow-through day confirms a new market rally (M criteria). Reported Sep '18 earnings +105% on +23% sales revenues, its 4th consecutive quarter with a big earnings increase versus the year ago period. Sales revenues growth has shown encouraging acceleration in sequential quarterly comparisons versus the year ago periods. See the latest FSU analysis for more details and an annotated graph.
>>> FEATURED STOCK ARTICLE : Boat Retailer Has Strong Earnings History - 11/2/2018 |
View all notes |
Set NEW NOTE alert |
Company Profile |
SEC
News |
Chart |
Request a new note
C
A
S
I |
ULTA
-
NASDAQ
Ulta Beauty Inc
SPECIALTY RETAIL - Specialty Retail, Other
|
$304.49
|
+13.98
4.81% |
$308.88
|
1,924,000
179.31% of 50 DAV
50 DAV is 1,073,000
|
$297.76
2.26%
|
11/8/2018
|
$296.36
|
PP = $290.40
|
|
MB = $304.92
|
Most Recent Note - 11/8/2018 1:07:08 PM
Y - Color code is changed to yellow with pivot point cited based on its 9/11/18 high plus 10 cents. A gain and close above the pivot point backed by at least +40% above average volume may clinch a technical buy signal. Hitting a new 52-week high today, and very little overhead supply remains to act as resistance up to the $314 level. Went through a deep consolidation since dropped from the Featured Stocks list on 6/29/17. Fundamentals remain strong as earnings increases were above the +25% minimum guideline (C criteria) in 3 of the past 4 quarterly comparisons through Jul '18 versus the year ago periods.
>>> FEATURED STOCK ARTICLE : Violation of 50-Day Moving Average and Slumping Relative Strength - 6/21/2017 |
View all notes |
Set NEW NOTE alert |
Company Profile |
SEC
News |
Chart |
Request a new note
C
A
S
I |
DPZ
-
NYSE
Dominos Pizza Inc
Retail-Restaurants
|
$273.15
|
+1.68
0.62% |
$276.50
|
481,435
82.16% of 50 DAV
50 DAV is 586,000
|
$305.34
-10.54%
|
8/13/2018
|
$288.60
|
PP = $293.91
|
|
MB = $308.61
|
Most Recent Note - 11/8/2018 5:18:04 PM
G - Volume totals have been below average while rebounding toward its 50 DMA line ($278). A rebound above the 50 DMA line is needed for its outlook to improve. The prior low ($253.63 on 7/31/18) and 200 DMA line define important near-term support to watch. Reported earnings +54% on +22% sales revenues for the Sep '18 quarter, continuing its strong earnings track record.
>>> FEATURED STOCK ARTICLE : Found Support at 200-Day Moving Average Line - 10/31/2018 |
View all notes |
Set NEW NOTE alert |
Company Profile |
SEC
News |
Chart |
Request a new note
C
A
S
I |
FIVE
-
NASDAQ
Five Below Inc
Retail-DiscountandVariety
|
$123.36
|
+1.81
1.49% |
$125.75
|
1,235,267
125.15% of 50 DAV
50 DAV is 987,000
|
$136.13
-9.38%
|
7/6/2018
|
$98.90
|
PP = $104.09
|
|
MB = $109.29
|
Most Recent Note - 11/8/2018 5:20:43 PM
G - Posted a solid gain today backed by +25% above average volume while rebounding further above its 50 DMA line ($121). Still faces resistance due to overhead supply up to the $136 level. Recently found support near the prior high ($109.09 on 7/19/18), but more damaging losses would raise greater concerns.
>>> FEATURED STOCK ARTICLE : Sputtering Below 50-Day Moving Average Near Prior High - 10/25/2018 |
View all notes |
Set NEW NOTE alert |
Company Profile |
SEC
News |
Chart |
Request a new note
C
A
S
I |
HQY
-
NASDAQ
Healthequity Inc
COMPUTER SOFTWARE and SERVICES - Healthcare Information Service
|
$98.80
|
-1.64
-1.63% |
$101.58
|
676,731
74.78% of 50 DAV
50 DAV is 905,000
|
$100.87
-2.05%
|
11/2/2018
|
$95.56
|
PP = $100.09
|
|
MB = $105.09
|
Most Recent Note - 11/7/2018 5:12:37 PM
Y - Hit a new all-time high with today's big gain backed by +20% above average volume. Color code was recently changed to yellow with new pivot point cited based on its 9/14/18 high plus 10 cents. Subsequent gains above the pivot point backed by at least +40% above average volume may clinch a convincing new (or add on) technical buy signal.
>>> FEATURED STOCK ARTICLE : Rebound Above 50-Day Average Helped Outlook Improve - 11/1/2018 |
View all notes |
Set NEW NOTE alert |
Company Profile |
SEC
News |
Chart |
Request a new note
C
A
S
I |
Symbol/Exchange
Company Name
Industry Group |
PRICE |
CHANGE
(%Change) |
Day High |
Volume
(% DAV)
(% 50 day avg vol) |
52 Wk Hi
% From Hi |
Featured
Date |
Price
Featured |
Pivot Featured |
|
Max Buy |
OLLI
-
NASDAQ
Ollie's Bargain Outlet
Retail-DiscountandVariety
|
$92.75
|
+1.02
1.11% |
$94.73
|
658,449
95.70% of 50 DAV
50 DAV is 688,000
|
$97.61
-4.98%
|
11/8/2018
|
$92.75
|
PP = $97.71
|
|
MB = $102.60
|
Most Recent Note - 11/8/2018 5:24:29 PM
Y - Posted a 3rd consecutive gain today and it has been finding support near its 50 DMA line ($90.79). Color code is changed to yellow and a new pivot point is cited based on its 10/01/18 high plus 10 cents. Subsequent volume-driven gains above the pivot point may trigger a new (or add-on) technical buy signal. The recent low ($84.66 on 10/11/18) defines the next important support to watch. Fundamentals remain strong.
>>> FEATURED STOCK ARTICLE : Finding Support Near its 50-Day Moving Average - 10/30/2018 |
View all notes |
Set NEW NOTE alert |
Company Profile |
SEC
News |
Chart |
Request a new note
C
A
S
I |
PLNT
-
NYSE
Planet Fitness Inc Cl A
Leisure-Services
|
$56.61
|
+1.04
1.87% |
$57.66
|
1,678,548
141.41% of 50 DAV
50 DAV is 1,187,000
|
$57.25
-1.12%
|
11/7/2018
|
$57.10
|
PP = $55.45
|
|
MB = $58.22
|
Most Recent Note - 11/7/2018 5:30:28 PM
Y - Finished strong after highlighted in yellow with pivot point cited based on its 9/26/18 high plus 10 cents in the earlier mid-day report. Reported earnings +47% on +40% sales revenues for the Sep '18 quarter, marking a 3rd consecutive quarterly earnings comparison above the +25% minimum guideline (C criteria). Recent comparisons showed impressive sales revenues acceleration. Annual earnings (A criteria) history included a small downturn in FY '15 but has been strong since. See the latest FSU analysis for more details and a new annotated graph.
>>> FEATURED STOCK ARTICLE : Big Gain for New High With Nearly 4 Times Average Volume - 11/7/2018 |
View all notes |
Set NEW NOTE alert |
Company Profile |
SEC
News |
Chart |
Request a new note
C
A
S
I |
|
|
|
THESE ARE NOT BUY RECOMMENDATIONS!
Comments contained in the body of this report are technical
opinions only. The material herein has been obtained
from sources believed to be reliable and accurate, however,
its accuracy and completeness cannot be guaranteed.
This site is not an investment advisor, hence it does
not endorse or recommend any securities or other investments.
Any recommendation contained in this report may not
be suitable for all investors and it is not to be deemed
an offer or solicitation on our part with respect to
the purchase or sale of any securities. All trademarks,
service marks and trade names appearing in this report
are the property of their respective owners, and are
likewise used for identification purposes only.
This report is a service available
only to active Paid Premium Members.
You may opt-out of receiving report notifications
at any time. Questions or comments may be submitted
by writing to Premium Membership Services 665 S.E. 10 Street, Suite 201 Deerfield Beach, FL 33441-5634 or by calling 1-800-965-8307
or 954-785-1121.
|
|
|

