You are not logged in.
This means you
CAN ONLY VIEW reports that were published prior to Friday, February 23, 2024.
You
MUST UPGRADE YOUR MEMBERSHIP if you want to see any current reports.
AFTER MARKET UPDATE - WEDNESDAY, NOVEMBER 7TH, 2018
Previous After Market Report Next After Market Report >>>
|
|
|
|
DOW |
+545.29 |
26,180.30 |
+2.13% |
|
Volume |
886,747,160 |
+9% |
|
Volume |
2,649,569,900 |
+16% |
|
NASDAQ |
+194.79 |
7,570.75 |
+2.64% |
|
Advancers |
2,281 |
76% |
|
Advancers |
2,158 |
70% |
|
S&P 500 |
+58.44 |
2,813.89 |
+2.12% |
|
Decliners |
733 |
24% |
|
Decliners |
929 |
30% |
|
Russell 2000 |
+26.06 |
1,582.16 |
+1.67% |
|
52 Wk Highs |
80 |
|
|
52 Wk Highs |
64 |
|
|
S&P 600 |
+11.79 |
992.06 |
+1.20% |
|
52 Wk Lows |
52 |
|
|
52 Wk Lows |
78 |
|
|
 |
Big Volume Driven Gains Signal New Confirmed Uptrend for Market
Kenneth J. Gruneisen - Passed the CAN SLIM® Master's Exam
Stocks finished firmly higher Wednesday. The Dow jumped 545 points to 26180, while the S&P 500 added 58 points to 2813. The Nasdaq Composite climbed 194 points to 7570. The volume totals reported were higher on the NYSE and on the Nasdaq exchange versus the prior session, indicative of an increase in institutional buying demand. Advancers led decliners by a 3-1 margin on the NYSE and more than 2-1 on the Nasdaq exchange. There were 46 high-ranked companies from the Leaders List that made new 52-week highs and were listed on the BreakOuts Page, more than doubling the total of 22 on the prior session. New 52-week highs outnumbered new 52-week lows on the NYSE, but new lows still outnumbered new 52-week highs on the Nasdaq exchange. Technically, the bullish action marked a shift in the market direction (M criteria), ending the latest correction, and moving back to a confirmed uptrend under the fact-based investment system. The Featured Stocks Page provides the most timely analysis on high-ranked leaders. Charts used courtesy of www.stockcharts.com
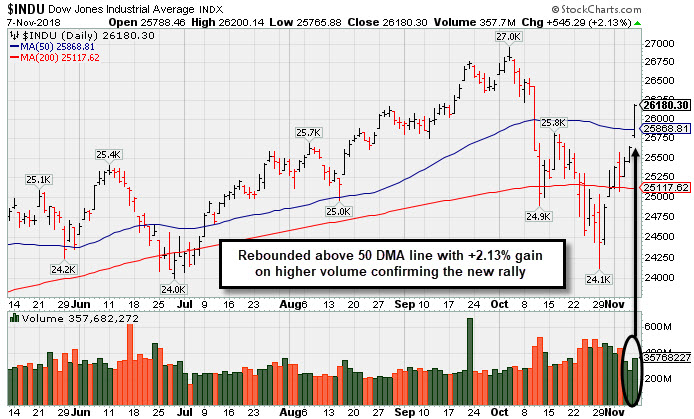
PICTURED: The Dow Jones Industrial Average and other major indices posted gains of greater than +2% on Wednesday (Day 7) with higher volume on the exchanges coupled with a greater number of stocks hitting new 52-week highs. The solid follow-through day is a reassuring sign, however, new buying efforts are only justified in stocks meeting all of the fundamental and technical criteria of the fact-based investment system.
The major averages extended their recent rebound as investors digested the outcome of the midterm elections. As expected, the Democratic Party took control of the House of Representatives, while the GOP strengthened its stronghold on the U.S. Senate. On the data front, mortgage applications dipped to the lowest level in four years in the prior week amid higher interest rates. Separately, a report showed that consumer credit rose a less-than-anticipated $10.9 billion in September, the smallest increase in three months.
All 11 S&P 500 sectors ended in positive territory, with ten sectors adding more than 1%. The Consumer Discretionary group paced gains, adding 3.2% as Amazon (AMZN +6.86%). Health Care stocks also outperformed with UnitedHealth Group (UNH +4.21%) and Pfizer (PFE +3.23%) both gaining. Technology stocks rallied with Microsoft (MSFT +3.94 %) and Salesforce (CRM +5.85%) both ending higher.
Treasuries were mixed with the yield on the 10-year note unchanged at 3.22%. In commodities, WTI crude fell 1.0% to $61.59/barrel on the NYMEX, near its lowest level since March as official government data showed U.S. stockpiles rose for the seventh consecutive week. COMEX gold was little changed at $1,226.70/ounce despite a weaker dollar. |
 Kenneth J. Gruneisen started out as a licensed stockbroker in August 1987, a couple of months prior to the historic stock market crash that took the Dow Jones Industrial Average down -22.6% in a single day. He has published daily fact-based fundamental and technical analysis on high-ranked stocks online for two decades. Through FACTBASEDINVESTING.COM, Kenneth provides educational articles, news, market commentary, and other information regarding proven investment systems that work in good times and bad.
Comments contained in the body of this report are technical opinions only and are not necessarily those of Gruneisen Growth Corp. The material herein has been obtained from sources believed to be reliable and accurate, however, its accuracy and completeness cannot be guaranteed. Our firm, employees, and customers may effect transactions, including transactions contrary to any recommendation herein, or have positions in the securities mentioned herein or options with respect thereto. Any recommendation contained in this report may not be suitable for all investors and it is not to be deemed an offer or solicitation on our part with respect to the purchase or sale of any securities. |
|
 |
Retail, Financial, Tech, and Energy-Linked Groups Helped Rally
Kenneth J. Gruneisen - Passed the CAN SLIM® Master's Exam
The Retail Index ($RLX +4.09%), Broker/Dealer Index ($XBD +2.19%), and Bank Index ($BKX +0.92%) posted unanimous gains on Wednesday. The tech sector had a positive bias as the Semiconductor Index ($SOX +1.19%) and the Biotech Index ($BTK +1.74%) both outpaced the Networking Index ($NWX +0.67%). The Integrated Oil Index ($XOI +1.82%) and the Oil Services Index ($OSX +1.21%) both posted gains, but again the Gold & Silver Index ($XAU -1.09%) was a standout decliner.
Charts courtesy of www.stockcharts.com
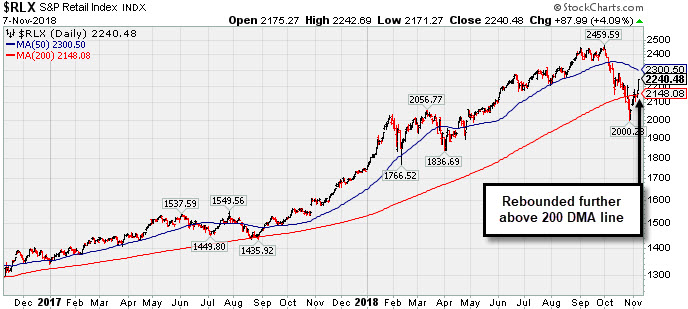 PICTURED: The Retail Index ($RLX +4.09%) was a standout gainer as it rebounded further above its 200-day moving average (DMA) line, a reassuring sign for the broader market outlook.
| Oil Services |
$OSX |
124.56 |
+1.50 |
+1.22% |
-16.71% |
| Integrated Oil |
$XOI |
1,407.00 |
+25.17 |
+1.82% |
+5.35% |
| Semiconductor |
$SOX |
1,257.47 |
+14.84 |
+1.19% |
+0.35% |
| Networking |
$NWX |
533.88 |
+3.55 |
+0.67% |
+8.84% |
| Broker/Dealer |
$XBD |
272.79 |
+5.84 |
+2.19% |
+2.85% |
| Retail |
$RLX |
2,240.48 |
+87.99 |
+4.09% |
+29.23% |
| Gold & Silver |
$XAU |
65.59 |
-0.72 |
-1.09% |
-23.08% |
| Bank |
$BKX |
101.50 |
+0.93 |
+0.92% |
-4.88% |
| Biotech |
$BTK |
4,874.15 |
+83.42 |
+1.74% |
+15.44% |
|
|
|
 |
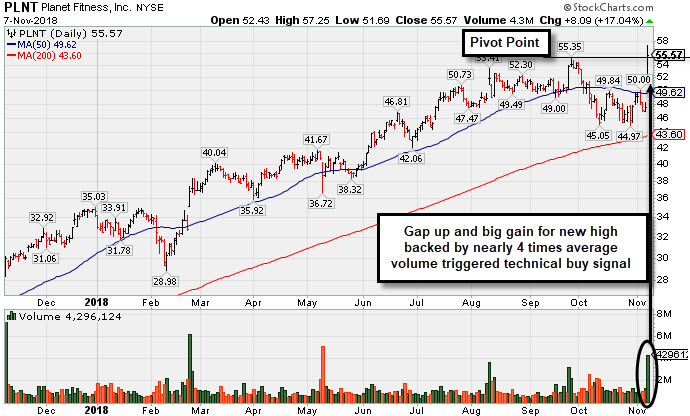
Big Gain for New High With Nearly 4 Times Average Volume
Kenneth J. Gruneisen - Passed the CAN SLIM® Master's Exam
Planet Fitness Inc Cl A (PLNT +$8.09 or +17.04% to $55.57) was highlighted in yellow with pivot point cited based on its 9/26/18 high plus 10 cents in the earlier mid-day report (read here). It gapped up today hitting a new all-time high. The big gain and close above the pivot point backed by nearly 4 times average volume triggered a technical buy signal. Recently it had met resistance and sputtered below its 50-day moving average (DMA) line ($49.62).
Bullish action came after it reported earnings +47% on +40% sales revenues for the Sep '18 quarter, marking a 3rd consecutive quarterly earnings comparison above the +25% minimum guideline (C criteria). Recent comparisons showed impressive sales revenues acceleration. Annual earnings (A criteria) history included a small downturn in FY '15 but has been strong since. Completed its Aug 2015 IPO at $14.06 and completed Secondary Offerings on 6/22/16, 9/26/16, 3/10/17 and 5/08/17.
The number of top-rated funds owning its shares rose from 373 in Dec '17 to 494 in Sep '18, a reassuring sign concerning the I criteria. The current Up/Down Volume Ratio of 1.3 is an unbiased indication its shares have been under accumulation over the past 50 days. It has earned a Timeliness Rating of A and Sponsorship Rating of B. Its small supply of 80.2 million shares in the public float can contribute to greater price volatility in the event of institutional buying or selling.
Charts courtesy of www.stockcharts.com
 |
|
|
Color Codes Explained :
Y - Better candidates highlighted by our
staff of experts.
G - Previously featured
in past reports as yellow but may no longer be buyable under the
guidelines.
***Last / Change / Volume data in this table is the closing quote data***
Symbol/Exchange
Company Name
Industry Group |
PRICE |
CHANGE
(%Change) |
Day High |
Volume
(% DAV)
(% 50 day avg vol) |
52 Wk Hi
% From Hi |
Featured
Date |
Price
Featured |
Pivot Featured |
|
Max Buy |
MPX
-
NYSE
Marine Products Corp
AUTOMOTIVE - Recreational Vehicles
|
$21.49
|
+0.29
1.37% |
$21.68
|
17,685
43.13% of 50 DAV
50 DAV is 41,000
|
$24.82
-13.42%
|
10/24/2018
|
$23.00
|
PP = $24.92
|
|
MB = $26.17
|
 Most Recent Note - 11/7/2018 5:13:52 PM
G - Volume totals have been cooling while still sputtering below its 50 DMA line ($21.79). A rebound above the 50 DMA line is needed for its outlook to improve.
>>> FEATURED STOCK ARTICLE : Weak Finish Amid Widely Negative Market Environment - 10/24/2018 |
View all notes |
Set NEW NOTE alert |
Company Profile |
SEC
News |
Chart |
Request a new note
C
A
S
I |
GMED
-
NYSE
Globus Medical Inc Cl A
CHEMICALS - Specialty Chemicals
|
$56.83
|
+0.92
1.65% |
$57.45
|
674,661
98.35% of 50 DAV
50 DAV is 686,000
|
$57.55
-1.25%
|
9/26/2018
|
$56.11
|
PP = $57.65
|
|
MB = $60.53
|
Most Recent Note - 11/7/2018 5:09:19 PM
Y - Perched near its all-time high and its color code is changed to yellow. Due to report earnings after the market close on Thursday, November 8th, 2018. Volume and volatility often increase near earnings news. Its 50 DMA line ($53.26) and 200 DMA line ($51.52) define near-term support. Subsequent gains above the pivot point backed by more than +40% above average volume are needed to trigger a proper technical buy signal.
>>> FEATURED STOCK ARTICLE : Consolidating -5.2% Off 52-Week High Ahead of Earnings News - 11/5/2018 |
View all notes |
Set NEW NOTE alert |
Company Profile |
SEC
News |
Chart |
Request a new note
C
A
S
I |
ZBRA
-
NASDAQ
Zebra Tech Corp Cl A
COMPUTER HARDWARE - Computer Peripherals
|
$180.24
|
+1.50
0.84% |
$182.24
|
671,508
161.03% of 50 DAV
50 DAV is 417,000
|
$184.75
-2.44%
|
11/6/2018
|
$170.41
|
PP = $179.57
|
|
MB = $188.55
|
Most Recent Note - 11/6/2018 5:50:08 PM
Y - Hit a new high with today's volume-driven gain but did not finish above the pivot point to clinch a convincing technical buy signal.Color code was changed to yellow with new pivot point cited based on its 9/14/18 high plus 10 cents. Volume and volatility often increase near earnings news. Reported Sep '18 earnings +54% on +17% sales revenues, continuing its strong earnings track record. Concerns also remain until a follow-through day confirms a new market rally (M criteria). Found support in recent weeks after a pullback near its 200 DMA line. See the latest FSU analysis for more details and a new annotated graph.
>>> FEATURED STOCK ARTICLE : Hit New High Following Another Strong Earnings Increase - 11/6/2018 |
View all notes |
Set NEW NOTE alert |
Company Profile |
SEC
News |
Chart |
Request a new note
C
A
S
I |
CME
-
NASDAQ
C M E Group Inc
DIVERSIFIED SERVICES - Business/Management Services
|
$188.69
|
+2.29
1.23% |
$188.74
|
2,905,093
172.72% of 50 DAV
50 DAV is 1,682,000
|
$188.49
0.11%
|
10/4/2018
|
$179.29
|
PP = $177.45
|
|
MB = $186.32
|
Most Recent Note - 11/7/2018 5:15:40 PM
G - Hit yet another new all-time high and rose further above its "max buy" level with above average volume behind today's 9th consecutive small gain. Found support above its 50 DMA line ($177) after recently reporting earnings +22% on +2% sales revenues for the Sep '18 quarter, below the +25% minimum earnings guideline (C criteria), raising fundamental concerns. The 50 DMA line and prior low ($170.04 on 9/28/18) define important near-term support.
>>> FEATURED STOCK ARTICLE : Perched Near High After Latest Earnings Report Below +25% Minimum - 10/26/2018 |
View all notes |
Set NEW NOTE alert |
Company Profile |
SEC
News |
Chart |
Request a new note
C
A
S
I |
HZO
-
NYSE
Marinemax Inc
SPECIALTY RETAIL - Specialty Retail, Other
|
$24.02
|
-1.84
-7.12% |
$26.10
|
869,019
279.43% of 50 DAV
50 DAV is 311,000
|
$26.11
-8.00%
|
11/2/2018
|
$25.10
|
PP = $25.15
|
|
MB = $26.41
|
Most Recent Note - 11/7/2018 1:12:04 PM
Y - Abruptly retreated from its 52-week high and slumped back into the prior base raising concerns with today's big loss after an impressive streak of 7 consecutive volume-driven gains. Highlighted in yellow with pivot point cited based on its 6/07/18 high plus 10 cents in the 11/02/18 mid-day report. New buying efforts are discouraged until a convincing follow-through day confirms a new market rally (M criteria). Reported Sep '18 earnings +105% on +23% sales revenues, its 4th consecutive quarter with a big earnings increase versus the year ago period. Sales revenues growth has shown encouraging acceleration in sequential quarterly comparisons versus the year ago periods. See the latest FSU analysis for more details and an annotated graph.
>>> FEATURED STOCK ARTICLE : Boat Retailer Has Strong Earnings History - 11/2/2018 |
View all notes |
Set NEW NOTE alert |
Company Profile |
SEC
News |
Chart |
Request a new note
C
A
S
I |
Symbol/Exchange
Company Name
Industry Group |
PRICE |
CHANGE
(%Change) |
Day High |
Volume
(% DAV)
(% 50 day avg vol) |
52 Wk Hi
% From Hi |
Featured
Date |
Price
Featured |
Pivot Featured |
|
Max Buy |
DPZ
-
NYSE
Dominos Pizza Inc
Retail-Restaurants
|
$271.47
|
+7.91
3.00% |
$272.07
|
547,409
93.73% of 50 DAV
50 DAV is 584,000
|
$305.34
-11.09%
|
8/13/2018
|
$288.60
|
PP = $293.91
|
|
MB = $308.61
|
Most Recent Note - 11/5/2018 5:54:09 PM
G - Volume totals have been cooling while finding support at its 200 DMA line ($257). A subsequent rebound above the 50 DMA line ($280) is needed for its outlook to improve. The prior low ($253.63 on 7/31/18) and 200 DMA line define important near-term support to watch. Reported earnings +54% on +22% sales revenues for the Sep '18 quarter, continuing its strong earnings track record.
>>> FEATURED STOCK ARTICLE : Found Support at 200-Day Moving Average Line - 10/31/2018 |
View all notes |
Set NEW NOTE alert |
Company Profile |
SEC
News |
Chart |
Request a new note
C
A
S
I |
FIVE
-
NASDAQ
Five Below Inc
Retail-DiscountandVariety
|
$121.55
|
+3.34
2.83% |
$122.03
|
752,437
76.31% of 50 DAV
50 DAV is 986,000
|
$136.13
-10.71%
|
7/6/2018
|
$98.90
|
PP = $104.09
|
|
MB = $109.29
|
Most Recent Note - 11/5/2018 5:56:12 PM
G - Slumped back below its 50 DMA line ($120) with today's loss on light volume. Recently found support near the prior high ($109.09 on 7/19/18), but more damaging losses would raise greater concerns.
>>> FEATURED STOCK ARTICLE : Sputtering Below 50-Day Moving Average Near Prior High - 10/25/2018 |
View all notes |
Set NEW NOTE alert |
Company Profile |
SEC
News |
Chart |
Request a new note
C
A
S
I |
HQY
-
NASDAQ
Healthequity Inc
COMPUTER SOFTWARE and SERVICES - Healthcare Information Service
|
$100.44
|
+5.06
5.31% |
$100.87
|
1,057,547
118.56% of 50 DAV
50 DAV is 892,000
|
$99.99
0.45%
|
11/2/2018
|
$95.56
|
PP = $100.09
|
|
MB = $105.09
|
Most Recent Note - 11/7/2018 5:12:37 PM
Y - Hit a new all-time high with today's big gain backed by +20% above average volume. Color code was recently changed to yellow with new pivot point cited based on its 9/14/18 high plus 10 cents. Subsequent gains above the pivot point backed by at least +40% above average volume may clinch a convincing new (or add on) technical buy signal.
>>> FEATURED STOCK ARTICLE : Rebound Above 50-Day Average Helped Outlook Improve - 11/1/2018 |
View all notes |
Set NEW NOTE alert |
Company Profile |
SEC
News |
Chart |
Request a new note
C
A
S
I |
OLLI
-
NASDAQ
Ollie's Bargain Outlet
Retail-DiscountandVariety
|
$91.73
|
+2.24
2.50% |
$91.95
|
973,778
142.99% of 50 DAV
50 DAV is 681,000
|
$97.61
-6.02%
|
7/12/2018
|
$74.43
|
PP = $77.60
|
|
MB = $81.48
|
Most Recent Note - 11/5/2018 12:59:30 PM
G - Slumping below its 50 DMA line ($90.27) with today's big loss on higher volume raising concerns. The recent low ($84.66 on 10/11/18) defines the next important support to watch. Fundamentals remain strong.
>>> FEATURED STOCK ARTICLE : Finding Support Near its 50-Day Moving Average - 10/30/2018 |
View all notes |
Set NEW NOTE alert |
Company Profile |
SEC
News |
Chart |
Request a new note
C
A
S
I |
PLNT
-
NYSE
Planet Fitness Inc Cl A
Leisure-Services
|
$55.57
|
+8.09
17.04% |
$57.25
|
4,296,022
387.03% of 50 DAV
50 DAV is 1,110,000
|
$55.35
0.40%
|
11/7/2018
|
$57.10
|
PP = $55.45
|
|
MB = $58.22
|
Most Recent Note - 11/7/2018 5:30:28 PM
Y - Finished strong after highlighted in yellow with pivot point cited based on its 9/26/18 high plus 10 cents in the earlier mid-day report. Reported earnings +47% on +40% sales revenues for the Sep '18 quarter, marking a 3rd consecutive quarterly earnings comparison above the +25% minimum guideline (C criteria). Recent comparisons showed impressive sales revenues acceleration. Annual earnings (A criteria) history included a small downturn in FY '15 but has been strong since. See the latest FSU analysis for more details and a new annotated graph.
>>> FEATURED STOCK ARTICLE : Big Gain for New High With Nearly 4 Times Average Volume - 11/7/2018 |
View all notes |
Set NEW NOTE alert |
Company Profile |
SEC
News |
Chart |
Request a new note
C
A
S
I |
Symbol/Exchange
Company Name
Industry Group |
PRICE |
CHANGE
(%Change) |
Day High |
Volume
(% DAV)
(% 50 day avg vol) |
52 Wk Hi
% From Hi |
Featured
Date |
Price
Featured |
Pivot Featured |
|
Max Buy |
|
|
|
THESE ARE NOT BUY RECOMMENDATIONS!
Comments contained in the body of this report are technical
opinions only. The material herein has been obtained
from sources believed to be reliable and accurate, however,
its accuracy and completeness cannot be guaranteed.
This site is not an investment advisor, hence it does
not endorse or recommend any securities or other investments.
Any recommendation contained in this report may not
be suitable for all investors and it is not to be deemed
an offer or solicitation on our part with respect to
the purchase or sale of any securities. All trademarks,
service marks and trade names appearing in this report
are the property of their respective owners, and are
likewise used for identification purposes only.
This report is a service available
only to active Paid Premium Members.
You may opt-out of receiving report notifications
at any time. Questions or comments may be submitted
by writing to Premium Membership Services 665 S.E. 10 Street, Suite 201 Deerfield Beach, FL 33441-5634 or by calling 1-800-965-8307
or 954-785-1121.
|
|
|

