You are not logged in.
This means you
CAN ONLY VIEW reports that were published prior to Monday, February 19, 2024.
You
MUST UPGRADE YOUR MEMBERSHIP if you want to see any current reports.
AFTER MARKET UPDATE - FRIDAY, NOVEMBER 6TH, 2020
Previous After Market Report Next After Market Report >>>
|
|
|
|
DOW |
-66.78 |
28,323.40 |
-0.24% |
|
Volume |
926,274,192 |
-0% |
|
Volume |
4,125,499,900 |
+8% |
|
NASDAQ |
+2.80 |
11,893.73 |
+0.02% |
|
Advancers |
1,158 |
38% |
|
Advancers |
1,336 |
39% |
|
S&P 500 |
-28.79 |
3,467.31 |
-0.82% |
|
Decliners |
1,874 |
62% |
|
Decliners |
2,132 |
61% |
|
Russell 2000 |
-15.89 |
1,644.16 |
-0.96% |
|
52 Wk Highs |
134 |
|
|
52 Wk Highs |
203 |
|
|
S&P 600 |
-9.72 |
925.22 |
-1.04% |
|
52 Wk Lows |
22 |
|
|
52 Wk Lows |
30 |
|
|
 |
Major Indices Quietly Consolidated After Post-Election Day Gains
Kenneth J. Gruneisen - Passed the CAN SLIM® Master's Exam
The Dow’s 66 point decline and the S&P 500’s less than 0.1% slide snapped a four-day streak in which each benchmark saw a daily advance of more than 1%. The Nasdaq Composite added less than 0.1%. Today’s moves capped the best weekly performance for all three major averages since April, with the Dow, S&P 500, and Nasdaq Composite jumping 6.9%, 7.3%, and 9%, respectively. The reported volume totals were mixed, slightly lighter than the prior session on the NYSE while higher on the Nasdaq exchange. Breadth was negative as decliners led advancers by a 3-2 margin on the NYSE and on the Nasdaq exchange. There were 82 high-ranked companies from the Leaders List that hit new 52-week highs and were listed on the BreakOuts Page, versus the total of 117 on the prior session. The new 52-week highs totals contracted yet easily outnumbered new 52-week lows on the NYSE and on the Nasdaq exchange. The major indices confirmed a new uptrend (M criteria) with Wednesday's solid follow-through day of gains backed by higher volume and more leadership. Investors are reminded to always make buying and selling decisions based based on the strict criteria and rules of the fact-based investment system. 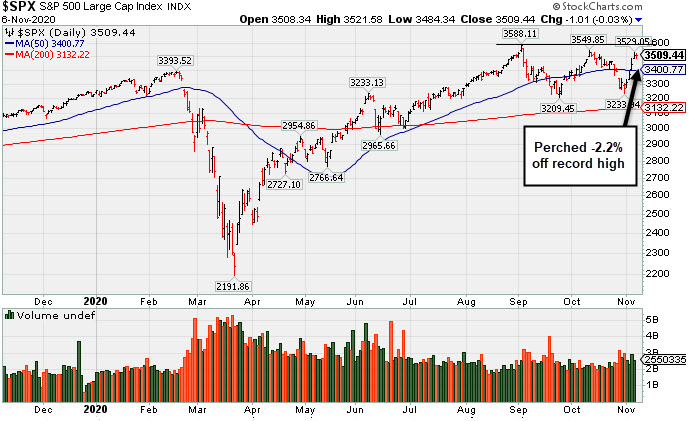 PICTURED: The benchmark S&P 500 Index has rebounded above its 50-day moving average (DMA) line and is perched -2.2% off its record high after finding support above the September low.
Stocks toggled between small gains and losses Friday, as investors monitored the evolving results of the U.S. presidential election. The latest tally showed former Vice President Joe Biden was the likely winner, as he maintained a narrow lead in several of the battleground states. Coronavirus headlines remained a market overhang, with the U.S. becoming the first country to record more than 100,000 new cases in a single day.
On the data front, the Labor Department’s monthly jobs report showed non-farm payrolls increased by 638,000 in October, higher than the 580,000 expected but slowing from September’s upwardly revised 672,000 figure. The unemployment rate fell to 6.9% from the prior month’s 7.9% reading. Treasuries declined, with the yield on the 10-year note adding five basis points to 0.82%. In commodities, WTI crude fell 3.5% to $37.42/barrel, while COMEX gold added 0.3% to $1952.90/ounce.
Six of 11 S&P 500 groups ended in negative territory, with Energy stocks lagging. In earnings, Zillow Group (Z +14.03%) rose after easily topping analysts’ earnings and revenue projections and providing upbeat forward guidance. Square (SQ +13.04%) jumped after more than doubling consensus earnings estimates. CVS Health (CVS +5.76%) after besting consensus earnings estimates and raising its full-year guidance. |
 Kenneth J. Gruneisen started out as a licensed stockbroker in August 1987, a couple of months prior to the historic stock market crash that took the Dow Jones Industrial Average down -22.6% in a single day. He has published daily fact-based fundamental and technical analysis on high-ranked stocks online for two decades. Through FACTBASEDINVESTING.COM, Kenneth provides educational articles, news, market commentary, and other information regarding proven investment systems that work in good times and bad.
Comments contained in the body of this report are technical opinions only and are not necessarily those of Gruneisen Growth Corp. The material herein has been obtained from sources believed to be reliable and accurate, however, its accuracy and completeness cannot be guaranteed. Our firm, employees, and customers may effect transactions, including transactions contrary to any recommendation herein, or have positions in the securities mentioned herein or options with respect thereto. Any recommendation contained in this report may not be suitable for all investors and it is not to be deemed an offer or solicitation on our part with respect to the purchase or sale of any securities. |
|
 |
Semi and Networking Indexes Rose; Financials and Energy Fell
Kenneth J. Gruneisen - Passed the CAN SLIM® Master's Exam
Financial shares created a slight drag on the major indices as the Bank Index ($BKX -2.05%) and Broker/Dealer Index ($XBD -0.98%) both lost ground. The Retail Index ($RLX -0.18%) ended with a tiny loss. The tech sector saw solid gains from the Semiconductor Index ($SOX +1.60%) and the Networking Index ($NWX +1.46%) while the Biotech Index ($BTK -1.89%) lost ground. Energy-linked groups lagged and lost ground as the Oil Services Index ($OSX -2.68%) and Integrated Oil Index ($XOI -1.87%) both fell.
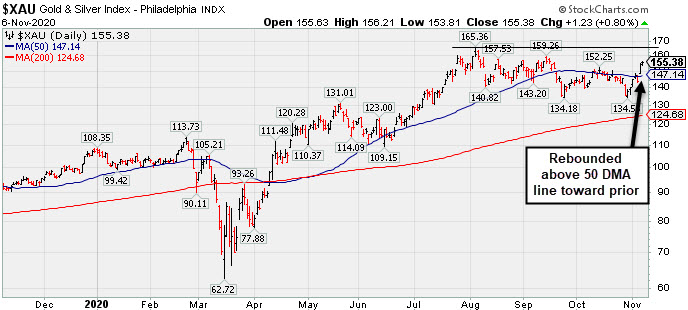
PICTURED: The Gold & Silver Index ($XAU +0.80%) found support above the prior low and rebounded above its 50-day moving average (DMA) line toward the prior high.
| Oil Services |
$OSX |
28.76 |
-0.79 |
-2.68% |
-63.27% |
| Integrated Oil |
$XOI |
576.70 |
-10.98 |
-1.87% |
-54.61% |
| Semiconductor |
$SOX |
2,529.00 |
+39.84 |
+1.60% |
+36.73% |
| Networking |
$NWX |
583.18 |
+8.37 |
+1.46% |
-0.04% |
| Broker/Dealer |
$XBD |
310.17 |
-3.07 |
-0.98% |
+6.81% |
| Retail |
$RLX |
3,544.00 |
-6.43 |
-0.18% |
+44.70% |
| Gold & Silver |
$XAU |
155.38 |
+1.23 |
+0.80% |
+45.33% |
| Bank |
$BKX |
78.52 |
-1.65 |
-2.05% |
-30.73% |
| Biotech |
$BTK |
5,481.31 |
-105.40 |
-1.89% |
+8.17% |
|
|
|
 |
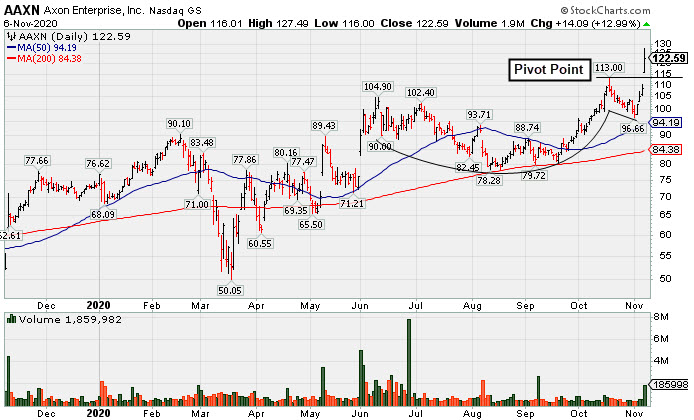
Breakaway Gap From Cup-With-High-Handle Pattern
Kenneth J. Gruneisen - Passed the CAN SLIM® Master's Exam
Axon Enterprise Inc's (AAXN +$14.09 or +12.99% to $122.59) color code was changed to yellow when highlighted in the earlier mid-day report (read here) while hitting a new all-time high today with a "breakaway gap" and volume-driven gain triggering a technical buy signal. Bullish action came after reporting Sep '20 quarterly earnings +43% on +27% sales revenues versus the year ago period. It formed a cup-with-high-handle base with volume drying up during the handle.
AAXN completed a new Pubic Offering on 6/17/20. Such offerings often hinder price progress temporarily, yet they help companies attract greater institutional ownership interest (I criteria). AAXN was first highlighted in yellow in the 5/08/20 mid-day report with pivot point cited based upon its 2/19/20 high plus 10 cents (read here). It was last shown in this FSU section on 7/14/20 with an annotated graph under the headline, "Managed Positive Reversal After Testing 50-Day Moving Average". AAXN found support at its 200 DMA line during the consolidation after dropped from the Featured Stocks list on 7/28/20.
The company has a small supply of only 63.5 million shares outstanding (S criteria) which can contribute to greater price volatility in the event of institutional buying or selling. The number of top-rated funds owning its shares rose from 400 in Sep '19 to 572 in Sep '20, a reassuring sign concerning the I criteria. AAXN has a Timeliness Rating of C and an Accumulation/Distribution Rating of A-. The Security/Safety industry group currently has a Group Relative Strength Rating of C (40).
The Jun '20 quarterly comparison was a one cent per share loss versus 14 cent per share gain on +26% sales revenues, a noted blemish on its otherwise strong record. The Sep, Dec '19 and Mar '20 quarterly comparisons versus the year ago periods showed earnings increases above the +25% minimum guideline (C criteria) with strong underlying sales revenues increases. Its annual earnings (A criteria) history has also been strong, helping it get a 86 Earnings Per Share Rating. |
|
|
Color Codes Explained :
Y - Better candidates highlighted by our
staff of experts.
G - Previously featured
in past reports as yellow but may no longer be buyable under the
guidelines.
***Last / Change / Volume data in this table is the closing quote data***
Symbol/Exchange
Company Name
Industry Group |
PRICE |
CHANGE
(%Change) |
Day High |
Volume
(% DAV)
(% 50 day avg vol) |
52 Wk Hi
% From Hi |
Featured
Date |
Price
Featured |
Pivot Featured |
|
Max Buy |
 CRL
-
NYSE
CRL
-
NYSE
Charles River Labs Intl
DRUGS - Biotechnology
|
$250.66
|
-0.92
-0.37% |
$252.70
|
208,429
60.41% of 50 DAV
50 DAV is 345,000
|
$254.45
-1.49%
|
7/15/2020
|
$192.66
|
PP = $189.95
|
|
MB = $199.45
|
Most Recent Note - 11/4/2020 5:16:38 PM
G - Hit a new all-time high with today's big volume-driven gain. Found prompt support near its 50 DMA line ($226). Reported Sep '20 quarterly earnings +38% on +11% sales revenues versus the year ago period, above the +25% minimum earnings guideline (C criteria).
>>> FEATURED STOCK ARTICLE : Earnings Due; Consolidating Near Prior High and Above 50 DMA Line - 10/27/2020 |
View all notes |
Set NEW NOTE alert |
Company Profile |
SEC
News |
Chart |
Request a new note
C
A
S
I |
AMD
-
NASDAQ
Advanced Micro Devices
ELECTRONICS - Semiconductor - Broad Line
|
$85.88
|
+2.88
3.47% |
$86.09
|
53,572,816
98.35% of 50 DAV
50 DAV is 54,471,000
|
$94.28
-8.91%
|
8/31/2020
|
$90.42
|
PP = $87.39
|
|
MB = $91.76
|
 Most Recent Note - 11/6/2020 5:10:10 PM
G - Posted a 4th consecutive gain today rebounding well above its 50 DMA line ($81.24) toward the prior high. It has not formed a sound base pattern. Subsequent losses and deterioration below the recent low would raise greater concerns and trigger a more worrisome technical sell signal. Faces near-term resistance due to overhead supply up to the $94 level.
>>> FEATURED STOCK ARTICLE : Weak Action Raised Concern While Testing Recent Low - 11/3/2020 |
View all notes |
Set NEW NOTE alert |
Company Profile |
SEC
News |
Chart |
Request a new note
C
A
S
I |
TER
-
NASDAQ
Teradyne Inc
ELECTRONICS - Semiconductor Equipment and Mate
|
$100.26
|
+0.94
0.95% |
$100.74
|
1,504,992
62.50% of 50 DAV
50 DAV is 2,408,000
|
$100.35
-0.09%
|
10/21/2020
|
$92.22
|
PP = $93.54
|
|
MB = $98.22
|
Most Recent Note - 11/5/2020 5:49:24 PM
G - Hit another new all-time high and rose above its "max buy" level with 4th consecutive gain backed by below average volume and its color code is changed to green. Gains above a stock's pivot point must be backed by at least +40% above average volume to trigger a proper technical buy signal. Reported earnings +53% on +41% sales revenues for the Sep '20 quarter versus the year ago period, its 4th consecutive quarterly comparison with earnings above the +25% minimum earnings guideline (C criteria). Sequential comparisons show encouraging acceleration in its sales revenues growth rate. Its annual earnings (A criteria) history has been strong.
>>> FEATURED STOCK ARTICLE : Challenging All-Time High With Volume-Drive Gain - 10/21/2020 |
View all notes |
Set NEW NOTE alert |
Company Profile |
SEC
News |
Chart |
Request a new note
C
A
S
I |
TREX
-
NYSE
Trex Company Inc
MATERIALS and CONSTRUCTION - General Building Materials
|
$79.61
|
+2.27
2.94% |
$79.66
|
901,851
114.16% of 50 DAV
50 DAV is 790,000
|
$81.23
-1.99%
|
6/26/2020
|
$54.53
|
PP = $66.47
|
|
MB = $69.79
|
Most Recent Note - 11/4/2020 5:12:21 PM
G - Rebounded above its 50 DMA line ($72.86) with today's volume-driven gain. Prior low ($63.32 on 9/21/20) defines the next near-term support. Reported Sep '20 quarterly earnings +14% on +19% sales revenues versus the year ago period, below the +25% minimum guideline (C criteria) raising fundamental concerns. See the latest FSU analysis for more details and a new annotated graph.
>>> FEATURED STOCK ARTICLE : Rebound Above 50-Day Moving Average Helped Technical Stance - 11/4/2020 |
View all notes |
Set NEW NOTE alert |
Company Profile |
SEC
News |
Chart |
Request a new note
C
A
S
I |
LGIH
-
NASDAQ
L G I Homes Inc
Bldg-Resident/Comml
|
$117.34
|
-5.85
-4.75% |
$124.63
|
265,937
99.98% of 50 DAV
50 DAV is 266,000
|
$132.98
-11.76%
|
10/1/2020
|
$123.17
|
PP = $124.04
|
|
MB = $130.24
|
Most Recent Note - 11/6/2020 5:11:37 PM
G - Slumped today retesting its 50 DMA line ($116.60). Reported Sep '20 quarterly earnings +27% on +11% sales revenues versus the year ago period. Members were cautioned with recent notes - "Recent gains above the new pivot point lacked the +40% above average volume needed to clinch a proper new (or add-on) technical buy signal."
>>> FEATURED STOCK ARTICLE : Hovering Near High But Recent Gains Lacked Great Volume - 10/19/2020 |
View all notes |
Set NEW NOTE alert |
Company Profile |
SEC
News |
Chart |
Request a new note
C
A
S
I |
Symbol/Exchange
Company Name
Industry Group |
PRICE |
CHANGE
(%Change) |
Day High |
Volume
(% DAV)
(% 50 day avg vol) |
52 Wk Hi
% From Hi |
Featured
Date |
Price
Featured |
Pivot Featured |
|
Max Buy |
NOW
-
NYSE
Servicenow Inc
Computer Sftwr-Enterprse
|
$535.18
|
+4.10
0.77% |
$537.53
|
825,718
62.70% of 50 DAV
50 DAV is 1,317,000
|
$533.84
0.25%
|
8/20/2020
|
$453.34
|
PP = $454.79
|
|
MB = $477.53
|
Most Recent Note - 11/4/2020 12:40:00 PM
G - Gapped up today finding prompt support and rebounding above its 50 DMA line ($487) with today's volume-driven gain helping its outlook improve. Prior low ($432.85 on 9/08/20) defines the next important support where any violation would raise greater concerns. Recently reported Sep '20 quarterly earnings +22% on +30% sales revenues versus the year ago period, below the +25% minimum guideline (C criteria) of the fact-based investment system.
>>> FEATURED STOCK ARTICLE : Found Prompt Support at 50 DMA Line After Earnings News - 10/29/2020 |
View all notes |
Set NEW NOTE alert |
Company Profile |
SEC
News |
Chart |
Request a new note
C
A
S
I |
VEEV
-
NYSE
Veeva Systems Inc Cl A
Computer Sftwr-Medical
|
$299.59
|
+2.42
0.81% |
$300.78
|
671,438
80.12% of 50 DAV
50 DAV is 838,000
|
$313.99
-4.59%
|
10/6/2020
|
$287.71
|
PP = $298.86
|
|
MB = $313.80
|
Most Recent Note - 11/5/2020 5:50:43 PM
G - Gapped up for a 2nd consecutive session, rebounding well above its 50 DMA line ($283) helping its outlook improve after damaging losses triggered a technical sell signal. Fundamentals remain strong.
>>> FEATURED STOCK ARTICLE : Recently Slumped Back Below Prior Highs - 10/26/2020 |
View all notes |
Set NEW NOTE alert |
Company Profile |
SEC
News |
Chart |
Request a new note
C
A
S
I |
ALRM
-
NASDAQ
Alarm.com Holdings Inc
Security/Sfty
|
$73.15
|
+8.03
12.33% |
$74.15
|
788,841
237.60% of 50 DAV
50 DAV is 332,000
|
$74.66
-2.02%
|
11/6/2020
|
$71.88
|
PP = $74.76
|
|
MB = $78.50
|
Most Recent Note - 11/6/2020 5:07:50 PM
Y - Finished strong after highlighted in yellow with pivot point cited based on its 7/23/20 high plus 10 cents in the earlier mid-day report. Gapped up and rallied to challenge its 52-week high with today's 5th consecutive gain backed by ever increasing volume. Subsequent gains above the pivot point may help clinch a convincing technical buy signal. Reported earnings +32% on +24% sales revenues for the Sep '20 quarter versus the year ago period, an improvement after +3% earnings in the Jun quarter. Prior quarterly comparisons were near or above the +25% minimum earnings guideline (C criteria). Annual earnings (A criteria) growth has been strong, a good match with the fact-based investment system. It is rebounding following a deep consolidation. Action has been choppy since dropped from the Featured Stocks list on 5/13/19.
>>> FEATURED STOCK ARTICLE : Technical and Fundamental Concerns Both Sound Alarms - 5/13/2019 |
View all notes |
Set NEW NOTE alert |
Company Profile |
SEC
News |
Chart |
Request a new note
C
A
S
I |
TEAM
-
NASDAQ
Atlassian Corp Plc Cl A
Comp Sftwr-Spec Enterprs
|
$198.18
|
-1.81
-0.91% |
$201.28
|
1,133,716
65.31% of 50 DAV
50 DAV is 1,736,000
|
$216.30
-8.38%
|
10/12/2020
|
$193.77
|
PP = $199.60
|
|
MB = $209.58
|
Most Recent Note - 11/5/2020 5:47:21 PM
G - Gapped up for a 2nd consecutive session today, rebounding well above its 50 DMA line ($188) and finding prompt support after damaging losses on higher volume triggered a technical sell signal. Reported earnings +7% on +26% sales revenues for the Sep '20 quarter versus the year ago period, well below the +25% minimum earnings guideline (C criteria), raising concerns.
>>> FEATURED STOCK ARTICLE : Weak Technical Action Followed Disappointing Fundamental News - 11/2/2020 |
View all notes |
Set NEW NOTE alert |
Company Profile |
SEC
News |
Chart |
Request a new note
C
A
S
I |
YETI
-
NYSE
Yeti Holdings Inc
Leisure-Products
|
$58.75
|
-1.16
-1.94% |
$62.72
|
1,710,897
145.36% of 50 DAV
50 DAV is 1,177,000
|
$60.93
-3.58%
|
11/5/2020
|
$57.25
|
PP = $55.14
|
|
MB = $57.90
|
Most Recent Note - 11/5/2020 5:45:14 PM
Y - Finished strong after highlighted in yellow with pivot point cited based on its 8/06/20 high plus 10 cents in the earlier mid-day report. It powered to a new all-time high with today's big gain backed by +390% above average volume, clearing an orderly base and triggering a technical buy signal. Bullish action came after it reported earnings +126% on +29% sales revenues for the Sep '20 quarter versus the year ago period, its 5th consecutive quarterly earnings increase above the +25% minimum earnings guideline (C criteria) of the fact-based investment system. Limited annual earnings (A criteria) history was previously noted as a concern. The number of top-rated funds owning its shares rose from 310 in Dec '19 to 480 in Sep '20, a reassuring sign concerning the I criteria. Completed Secondary Offerings on 5/12/20, 2/20/20, 11/08/19 and 5/08/19 after its $18 IPO on 10/25/18. See the latest FSU analysis for more details and a new annotated graph.
>>> FEATURED STOCK ARTICLE : Finished Strong After Breakout Gain Was Noted in Mid-Day Report - 11/5/2020 |
View all notes |
Set NEW NOTE alert |
Company Profile |
SEC
News |
Chart |
Request a new note
C
A
S
I |
Symbol/Exchange
Company Name
Industry Group |
PRICE |
CHANGE
(%Change) |
Day High |
Volume
(% DAV)
(% 50 day avg vol) |
52 Wk Hi
% From Hi |
Featured
Date |
Price
Featured |
Pivot Featured |
|
Max Buy |
AAXN
-
NASDAQ
Axon Enterprise Inc
Security/Sfty
|
$122.59
|
+14.09
12.99% |
$127.49
|
1,859,372
330.26% of 50 DAV
50 DAV is 563,000
|
$113.00
8.49%
|
11/6/2020
|
$122.75
|
PP = $113.00
|
|
MB = $118.65
|
Most Recent Note - 11/6/2020 5:06:57 PM
Y - Finished in the upper half of its intra-day range after hitting a new all-time high today with a "breakaway gap" and volume-driven gain triggering a technical buy signal. Bullish action came after reporting Sep '20 quarterly earnings +43% on +27% sales revenues versus the year ago period. It formed a cup-with-high-handle base with volume drying up during the handle. See the latest FSU analysis for more details and a new annotated graph.
>>> FEATURED STOCK ARTICLE : Breakaway Gap From Cup-With-High-Handle Pattern - 11/6/2020 |
View all notes |
Set NEW NOTE alert |
Company Profile |
SEC
News |
Chart |
Request a new note
C
A
S
I |
|
|
|
THESE ARE NOT BUY RECOMMENDATIONS!
Comments contained in the body of this report are technical
opinions only. The material herein has been obtained
from sources believed to be reliable and accurate, however,
its accuracy and completeness cannot be guaranteed.
This site is not an investment advisor, hence it does
not endorse or recommend any securities or other investments.
Any recommendation contained in this report may not
be suitable for all investors and it is not to be deemed
an offer or solicitation on our part with respect to
the purchase or sale of any securities. All trademarks,
service marks and trade names appearing in this report
are the property of their respective owners, and are
likewise used for identification purposes only.
This report is a service available
only to active Paid Premium Members.
You may opt-out of receiving report notifications
at any time. Questions or comments may be submitted
by writing to Premium Membership Services 665 S.E. 10 Street, Suite 201 Deerfield Beach, FL 33441-5634 or by calling 1-800-965-8307
or 954-785-1121.
|
|
|