You are not logged in.
This means you
CAN ONLY VIEW reports that were published prior to Sunday, February 18, 2024.
You
MUST UPGRADE YOUR MEMBERSHIP if you want to see any current reports.
AFTER MARKET UPDATE - MONDAY, NOVEMBER 5TH, 2018
Previous After Market Report Next After Market Report >>>
|
|
|
|
DOW |
+190.87 |
25,461.70 |
+0.76% |
|
Volume |
932,666,010 |
-6% |
|
Volume |
2,156,208,370 |
-25% |
|
NASDAQ |
-28.14 |
7,328.85 |
-0.38% |
|
Advancers |
1,930 |
64% |
|
Advancers |
1,461 |
47% |
|
S&P 500 |
+15.25 |
2,738.31 |
+0.56% |
|
Decliners |
1,064 |
36% |
|
Decliners |
1,647 |
53% |
|
Russell 2000 |
-0.47 |
1,547.51 |
-0.03% |
|
52 Wk Highs |
30 |
|
|
52 Wk Highs |
39 |
|
|
S&P 600 |
+1.31 |
974.74 |
+0.13% |
|
52 Wk Lows |
53 |
|
|
52 Wk Lows |
63 |
|
|
 |
Leadership Elusive as Major Indices Ended Mixed
Kenneth J. Gruneisen - Passed the CAN SLIM® Master's Exam
Stocks finished mixed Monday. The Dow climbed 190 points to 25461, while the S&P 500 gained 15 points to 2738. The Nasdaq Composite lost 28 points to 7328. The volume totals reported were lighter on the NYSE and on the Nasdaq exchange versus the prior session. Advancers led decliners by almost a 2-1 margin on the NYSE, meanwhile decliners narrowly outnumbered advancers on the Nasdaq exchange. There were 11 high-ranked companies from the Leaders List that made new 52-week highs and were listed on the BreakOuts Page, versus 15 on the prior session, as market leadership remained elusive. New 52-week lows totals still outnumbered new 52-week highs on the NYSE and Nasdaq exchange. Reports since October 10th have noted that the major indices (M criteria) have shown action indicative of a market correction. The Featured Stocks Page provides the most timely analysis on high-ranked leaders. Charts used courtesy of www.stockcharts.com
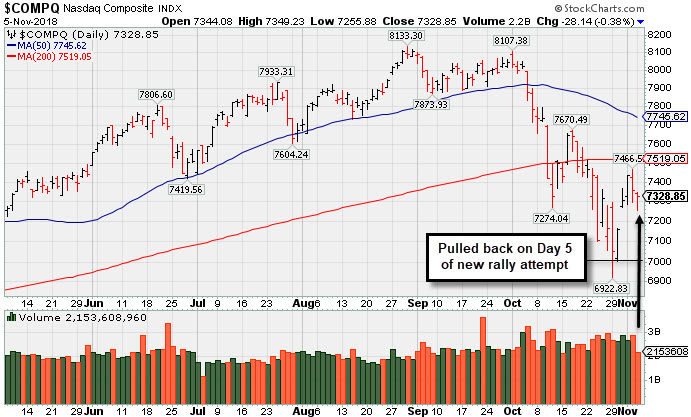
PICTURED: The Nasdaq Composite Index fell on Monday which marked Day 5 of a new rally attempt. Technically, the market remains in a "correction" under the fact-based investment system. Members have been reminded repeatedly that new buying efforts are against the rules until a convincing follow-through day occurs. Between Day 4 and Day 7 investors should watch for a "follow-through day" of solid gains (at least +1%) from one or more of the major indices, backed by higher volume, and coupled with a leadership expansion (increase in new 52-week highs). All of the above are necessary elements required to confirm a new rally. Until then, patience and discipline are paramount.
The major averages fluctuated as investors weighed strong gains in the Energy and Financial sectors against weakness in the Tech space. Market participants anticipate tomorrow’s midterm elections, as well as Thursday’s FOMC meeting in which the Fed is widely expected to leave interest rates unchanged. On the data front, the Institute for Supply Management (ISM) reported activity in the services sector eased less-than-anticipated in October after rising to a 21-year high during the prior month.
Eight of 11 S&P 500 sectors closed in positive territory. Energy shares led advancers with Chevron (CVX +3.67%) rose following an analyst upgrade. Financials also outperformed, with Berkshire Hathaway Class B (BRKB +4.68%) rose after revealing operating profit nearly doubled on lower taxes and insurance results that exceeded expectations. Apple (AAPL -2.84%) dragged down the Nasdaq following a report that the iPhone maker canceled previously planned production increases. Amazon (AMZN -2.27%) fell after the Trump administration announced an investigation into antitrust violations.
Treasuries advanced with the yield on the 10-year note down one basis point to 3.20%. In commodities, WTI crude gave back earlier gains to slip 0.6% to $62.78/barrel as worries over Iran sanctions eased. COMEX gold edged down 0.1% to $1,232.40/ounce despite a weaker dollar. |
 Kenneth J. Gruneisen started out as a licensed stockbroker in August 1987, a couple of months prior to the historic stock market crash that took the Dow Jones Industrial Average down -22.6% in a single day. He has published daily fact-based fundamental and technical analysis on high-ranked stocks online for two decades. Through FACTBASEDINVESTING.COM, Kenneth provides educational articles, news, market commentary, and other information regarding proven investment systems that work in good times and bad.
Comments contained in the body of this report are technical opinions only and are not necessarily those of Gruneisen Growth Corp. The material herein has been obtained from sources believed to be reliable and accurate, however, its accuracy and completeness cannot be guaranteed. Our firm, employees, and customers may effect transactions, including transactions contrary to any recommendation herein, or have positions in the securities mentioned herein or options with respect thereto. Any recommendation contained in this report may not be suitable for all investors and it is not to be deemed an offer or solicitation on our part with respect to the purchase or sale of any securities. |
|
 |
Financial and Energy-Linked Indexes Rose
Kenneth J. Gruneisen - Passed the CAN SLIM® Master's Exam
While the Bank Index ($BKX +0.80%) and the Broker/Dealer Index ($XBD +0.45%) rose on Monday, the Retail Index ($RLX -0.61%) and the tech sector had a negative bias. The Networking Index ($NWX -0.40%) and Semiconductor Index ($SOX -0.85%) outpaced the Biotech Index ($BTK +0.65%) to the downside. The Integrated Oil Index ($XOI +2.00%) and the Oil Services Index ($OSX +1.88%) both posted gains, meanwhile the Gold & Silver Index ($XAU -0.07%) was unchanged.
Charts courtesy of www.stockcharts.com
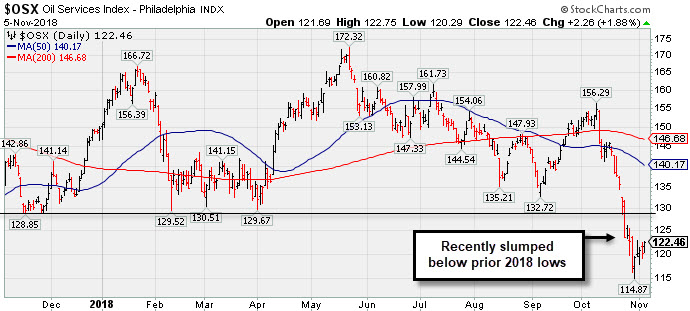 PICTURED: The Oil Services Index ($OSX +1.88%) rose on Monday. Recently it slumped below the prior 2018 lows.
| Oil Services |
$OSX |
122.46 |
+2.26 |
+1.88% |
-18.11% |
| Integrated Oil |
$XOI |
1,376.73 |
+27.06 |
+2.00% |
+3.08% |
| Semiconductor |
$SOX |
1,228.60 |
-10.56 |
-0.85% |
-1.95% |
| Networking |
$NWX |
526.71 |
-2.14 |
-0.40% |
+7.37% |
| Broker/Dealer |
$XBD |
264.74 |
+1.18 |
+0.45% |
-0.19% |
| Retail |
$RLX |
2,135.52 |
-13.01 |
-0.61% |
+23.17% |
| Gold & Silver |
$XAU |
67.14 |
-0.05 |
-0.07% |
-21.26% |
| Bank |
$BKX |
100.16 |
+0.79 |
+0.80% |
-6.14% |
| Biotech |
$BTK |
4,794.99 |
-6.98 |
-0.15% |
+13.57% |
|
|
|
 |
Consolidating -5.2% Off 52-Week High Ahead of Earnings News
Kenneth J. Gruneisen - Passed the CAN SLIM® Master's Exam
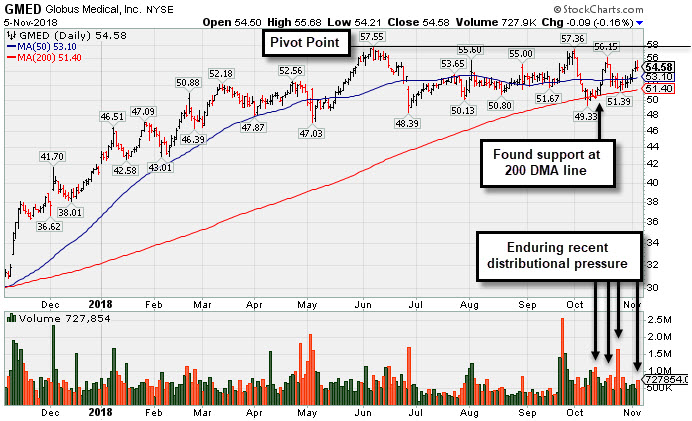
Globus Medical Inc Cl A (GMED -$0.09 or -0.16% to $54.58) is consolidating above its 50-day moving average (DMA) line ($53.10). Recent volume-driven losses have been noted as signs of distributional pressure hurting its outlook, however it has found support near its 200 DMA line. Subsequent gains above the pivot point backed by more than +40% above average volume are needed to trigger a technical buy signal. Additionally, any new buying efforts are discouraged until a follow-through day confirms a new market rally (M criteria).
Keep in mind that after the close on Thursday, on 11/08/18 it is due to report earnings news for the Sep '18 quarter. Volume and volatility often increase near earnings news. Earnings rose +38% on +14% sales revenues for the Jun '18 quarter, its 2nd strong quarterly comparison above the +25% minimum guideline (C criteria). Annual earnings (A criteria) growth has been steady.
The Medical - Products firm has technology to treat patients with spine disorders. GMED was last shown in this FSU section on 10/22/18 with an annotated graph under the headline, "Consolidating After Rally at 200-Day Moving Average Line". It was first highlighted in yellow with pivot point cited based on its 6/06/18 high plus 10 cents in the earlier mid-day report (read here).
It has 98.3 million shares outstanding (S criteria). The number of top rated funds owning its shares rose from 451 in Sep '17 to 515 in Sep '18, a reassuring sign concerning the I criteria. Its current Up/Down Volume Ratio of 1.1 is an unbiased indication its shares have been under slight accumulation over the past 50 days.
Charts courtesy of www.stockcharts.com
 |
|
|
Color Codes Explained :
Y - Better candidates highlighted by our
staff of experts.
G - Previously featured
in past reports as yellow but may no longer be buyable under the
guidelines.
***Last / Change / Volume data in this table is the closing quote data***
Symbol/Exchange
Company Name
Industry Group |
PRICE |
CHANGE
(%Change) |
Day High |
Volume
(% DAV)
(% 50 day avg vol) |
52 Wk Hi
% From Hi |
Featured
Date |
Price
Featured |
Pivot Featured |
|
Max Buy |
MPX
-
NYSE
Marine Products Corp
AUTOMOTIVE - Recreational Vehicles
|
$21.34
|
-0.02
-0.09% |
$21.51
|
41,091
102.73% of 50 DAV
50 DAV is 40,000
|
$24.82
-14.02%
|
10/24/2018
|
$23.00
|
PP = $24.92
|
|
MB = $26.17
|
Most Recent Note - 11/2/2018 5:57:22 PM
G - Still sputtering below its 50 DMA line ($21.67). A rebound above the 50 DMA line is needed for its outlook to improve.
>>> FEATURED STOCK ARTICLE : Weak Finish Amid Widely Negative Market Environment - 10/24/2018 |
View all notes |
Set NEW NOTE alert |
Company Profile |
SEC
News |
Chart |
Request a new note
C
A
S
I |
GMED
-
NYSE
Globus Medical Inc Cl A
CHEMICALS - Specialty Chemicals
|
$54.58
|
-0.09
-0.16% |
$55.68
|
727,674
108.93% of 50 DAV
50 DAV is 668,000
|
$57.55
-5.16%
|
9/26/2018
|
$56.11
|
PP = $57.65
|
|
MB = $60.53
|
Most Recent Note - 11/1/2018 10:19:33 AM
G - Consolidating near its 50 DMA line ($52.98). Subsequent gains above the pivot point backed by more than +40% above average volume are needed to trigger a proper technical buy signal.
>>> FEATURED STOCK ARTICLE : Consolidating -5.2% Off 52-Week High Ahead of Earnings News - 11/5/2018 |
View all notes |
Set NEW NOTE alert |
Company Profile |
SEC
News |
Chart |
Request a new note
C
A
S
I |
ZBRA
-
NASDAQ
Zebra Tech Corp Cl A
COMPUTER HARDWARE - Computer Peripherals
|
$168.00
|
-0.06
-0.04% |
$168.63
|
500,934
128.44% of 50 DAV
50 DAV is 390,000
|
$179.47
-6.39%
|
8/7/2018
|
$164.26
|
PP = $161.82
|
|
MB = $169.91
|
 Most Recent Note - 11/5/2018 5:52:25 PM
G - Due to report Sep '18 earnings news before the open tomorrow. Volume and volatility often increase near earnings news. Recently consolidating near its 50 DMA line ($168), and overhead supply remains up to the $179 level to act as resistance. Found support in recent weeks after a pullback near its 200 DMA line.
>>> FEATURED STOCK ARTICLE : Zebra Tech Sputtering Near 50-Day Moving Average - 10/23/2018 |
View all notes |
Set NEW NOTE alert |
Company Profile |
SEC
News |
Chart |
Request a new note
C
A
S
I |
CME
-
NASDAQ
C M E Group Inc
DIVERSIFIED SERVICES - Business/Management Services
|
$185.50
|
+1.64
0.89% |
$186.76
|
3,380,404
210.35% of 50 DAV
50 DAV is 1,607,000
|
$186.66
-0.62%
|
10/4/2018
|
$179.29
|
PP = $177.45
|
|
MB = $186.32
|
Most Recent Note - 11/5/2018 5:57:47 PM
Y - Touched yet another new all-time high with above average volume behind today's 7th consecutive small gain. Found support above its 50 DMA line ($176) after recently reporting earnings +22% on +2% sales revenues for the Sep '18 quarter, below the +25% minimum earnings guideline (C criteria), raising fundamental concerns. Broad market weakness (M criteria) is also a serious concern. The 50 DMA line and prior low ($170.04 on 9/28/18) define important near-term support.
>>> FEATURED STOCK ARTICLE : Perched Near High After Latest Earnings Report Below +25% Minimum - 10/26/2018 |
View all notes |
Set NEW NOTE alert |
Company Profile |
SEC
News |
Chart |
Request a new note
C
A
S
I |
HZO
-
NYSE
Marinemax Inc
SPECIALTY RETAIL - Specialty Retail, Other
|
$25.85
|
+1.01
4.07% |
$25.90
|
519,686
176.76% of 50 DAV
50 DAV is 294,000
|
$25.14
2.82%
|
11/2/2018
|
$25.10
|
PP = $25.15
|
|
MB = $26.41
|
Most Recent Note - 11/5/2018 12:44:57 PM
Y - Hitting a new 52-week high with today's 6th consecutive volume-driven gain. Highlighted in yellow with pivot point cited based on its 6/07/18 high plus 10 cents in the prior mid-day report. A gain and strong close above the pivot point backed by at least +40% above average volume may trigger a technical buy signal. New buying efforts are discouraged until a convincing follow-through day confirms a new market rally (M criteria). Reported Sep '18 earnings +105% on +23% sales revenues, its 4th consecutive quarter with a big earnings increase versus the year ago period. Sales revenues growth has shown encouraging acceleration in sequential quarterly comparisons versus the year ago periods. See the latest FSU analysis for more details and an annotated graph.
>>> FEATURED STOCK ARTICLE : Boat Retailer Has Strong Earnings History - 11/2/2018 |
View all notes |
Set NEW NOTE alert |
Company Profile |
SEC
News |
Chart |
Request a new note
C
A
S
I |
Symbol/Exchange
Company Name
Industry Group |
PRICE |
CHANGE
(%Change) |
Day High |
Volume
(% DAV)
(% 50 day avg vol) |
52 Wk Hi
% From Hi |
Featured
Date |
Price
Featured |
Pivot Featured |
|
Max Buy |
DPZ
-
NYSE
Dominos Pizza Inc
Retail-Restaurants
|
$260.26
|
-5.04
-1.90% |
$266.03
|
542,951
92.97% of 50 DAV
50 DAV is 584,000
|
$305.34
-14.76%
|
8/13/2018
|
$288.60
|
PP = $293.91
|
|
MB = $308.61
|
Most Recent Note - 11/5/2018 5:54:09 PM
G - Volume totals have been cooling while finding support at its 200 DMA line ($257). A subsequent rebound above the 50 DMA line ($280) is needed for its outlook to improve. The prior low ($253.63 on 7/31/18) and 200 DMA line define important near-term support to watch. Reported earnings +54% on +22% sales revenues for the Sep '18 quarter, continuing its strong earnings track record.
>>> FEATURED STOCK ARTICLE : Found Support at 200-Day Moving Average Line - 10/31/2018 |
View all notes |
Set NEW NOTE alert |
Company Profile |
SEC
News |
Chart |
Request a new note
C
A
S
I |
FIVE
-
NASDAQ
Five Below Inc
Retail-DiscountandVariety
|
$117.09
|
-3.88
-3.21% |
$120.91
|
689,363
70.20% of 50 DAV
50 DAV is 982,000
|
$136.13
-13.99%
|
7/6/2018
|
$98.90
|
PP = $104.09
|
|
MB = $109.29
|
Most Recent Note - 11/5/2018 5:56:12 PM
G - Slumped back below its 50 DMA line ($120) with today's loss on light volume. Recently found support near the prior high ($109.09 on 7/19/18), but more damaging losses would raise greater concerns.
>>> FEATURED STOCK ARTICLE : Sputtering Below 50-Day Moving Average Near Prior High - 10/25/2018 |
View all notes |
Set NEW NOTE alert |
Company Profile |
SEC
News |
Chart |
Request a new note
C
A
S
I |
HQY
-
NASDAQ
Healthequity Inc
COMPUTER SOFTWARE and SERVICES - Healthcare Information Service
|
$95.44
|
+1.43
1.52% |
$95.72
|
713,380
80.16% of 50 DAV
50 DAV is 890,000
|
$99.99
-4.55%
|
11/2/2018
|
$95.56
|
PP = $100.09
|
|
MB = $105.09
|
Most Recent Note - 11/2/2018 12:32:39 PM
Y - Color code is changed to yellow with new pivot point cited based on its 9/14/18 high plus 10 cents. Rebound above the 50 DMA line helped its outlook improve this week. Subsequent gains above the pivot point backed by at least +40% above average volume may trigger a new (or add on) technical buy signal. See the latest FSU analysis for more details and an annotated graph.
>>> FEATURED STOCK ARTICLE : Rebound Above 50-Day Average Helped Outlook Improve - 11/1/2018 |
View all notes |
Set NEW NOTE alert |
Company Profile |
SEC
News |
Chart |
Request a new note
C
A
S
I |
OLLI
-
NASDAQ
Ollie's Bargain Outlet
Retail-DiscountandVariety
|
$89.16
|
-3.57
-3.85% |
$90.38
|
1,064,718
158.20% of 50 DAV
50 DAV is 673,000
|
$97.61
-8.66%
|
7/12/2018
|
$74.43
|
PP = $77.60
|
|
MB = $81.48
|
Most Recent Note - 11/5/2018 12:59:30 PM
G - Slumping below its 50 DMA line ($90.27) with today's big loss on higher volume raising concerns. The recent low ($84.66 on 10/11/18) defines the next important support to watch. Fundamentals remain strong.
>>> FEATURED STOCK ARTICLE : Finding Support Near its 50-Day Moving Average - 10/30/2018 |
View all notes |
Set NEW NOTE alert |
Company Profile |
SEC
News |
Chart |
Request a new note
C
A
S
I |
|
|
|
THESE ARE NOT BUY RECOMMENDATIONS!
Comments contained in the body of this report are technical
opinions only. The material herein has been obtained
from sources believed to be reliable and accurate, however,
its accuracy and completeness cannot be guaranteed.
This site is not an investment advisor, hence it does
not endorse or recommend any securities or other investments.
Any recommendation contained in this report may not
be suitable for all investors and it is not to be deemed
an offer or solicitation on our part with respect to
the purchase or sale of any securities. All trademarks,
service marks and trade names appearing in this report
are the property of their respective owners, and are
likewise used for identification purposes only.
This report is a service available
only to active Paid Premium Members.
You may opt-out of receiving report notifications
at any time. Questions or comments may be submitted
by writing to Premium Membership Services 665 S.E. 10 Street, Suite 201 Deerfield Beach, FL 33441-5634 or by calling 1-800-965-8307
or 954-785-1121.
|
|
|

