You are not logged in.
This means you
CAN ONLY VIEW reports that were published prior to Saturday, February 24, 2024.
You
MUST UPGRADE YOUR MEMBERSHIP if you want to see any current reports.
AFTER MARKET UPDATE - WEDNESDAY, NOVEMBER 4TH, 2020
Previous After Market Report Next After Market Report >>>
|
|
|
|
DOW |
+367.63 |
27,847.66 |
+1.34% |
|
Volume |
994,640,832 |
+15% |
|
Volume |
3,579,868,900 |
+12% |
|
NASDAQ |
+427.12 |
11,587.69 |
+3.83% |
|
Advancers |
1,651 |
55% |
|
Advancers |
1,742 |
53% |
|
S&P 500 |
-28.79 |
3,467.31 |
-0.82% |
|
Decliners |
1,370 |
45% |
|
Decliners |
1,552 |
47% |
|
Russell 2000 |
+0.79 |
1,615.08 |
+0.05% |
|
52 Wk Highs |
92 |
|
|
52 Wk Highs |
145 |
|
|
S&P 600 |
-9.36 |
909.54 |
-1.02% |
|
52 Wk Lows |
14 |
|
|
52 Wk Lows |
33 |
|
|
The major indices confirmed a new uptrend with Wednesday's big gains on higher volume while leadership expanded.
|
 |
Major Indices Rallied With Higher Volume and Leadership Expansion
Kenneth J. Gruneisen - Passed the CAN SLIM® Master's Exam
The Dow climbed 367 points, while the S&P 500 advanced 2.2% to cap a 5% three-day rally. The Nasdaq Composite surged 3.9% amid a rally in mega cap tech stocks. The reported volume totals were higher than the prior session on the NYSE and on the Nasdaq exchange, indicative of greater institutional buying demand. Breadth was slightly positive as advancers led decliners by about an 8-7 margin on the NYSE and on the Nasdaq exchange. There were 78 high-ranked companies from the Leaders List that hit new 52-week highs and were listed on the BreakOuts Page, versus the total of 31 on the prior session. The new 52-week highs totals expanded and outnumbered new 52-week lows on the NYSE and on the Nasdaq exchange. The major indices have confirmed a new uptrend (M criteria) with a solid follow-through day of gains backed by higher volume and more leadership. Investors are reminded to always make buying and selling decisions based based on the strict criteria and rules of the fact-based investment system.  PICTURED: The Dow Jones Industrial Average found support at its 200-day moving average (DMA) line after undercutting the September low and rebounded to its 50 DMA line.
Stocks pushed higher on Wednesday as investors continued to monitor the U.S. presidential election. Equity futures fluctuated wildly overnight as momentum swung between incumbent President Donald Trump and former Vice President Joe Biden. After taking slim leads in battleground states such as Wisconsin and Michigan on Wednesday, analysts identified Biden as a slight favorite to win the White House, though several key races remained too close to call.
Seven of 11 S&P 500 sectors finished the session higher, with the Health Care group pacing the gains. Biogen (BIIB +43.97%) surged following reports pointing to a favorable FDA ruling on its Alzheimer’s drug. Communication Services and Technology stocks also rallied with Alphabet (GOOGL +6.09%), Facebook (FB +8.32%), and Microsoft (MSFT +4.82%) each jumping considerably on the day. Materials and Financials lagged, as value-oriented shares lost momentum. Meanwhile, Uber (UBER +14.6%) after California voters approved a proposition allowing ride-share companies to classify workers as independent contractors rather than employees.
Treasuries strengthened, with the yield on the benchmark 10-year note falling 12 basis points to 0.77%. Commodities were mixed, with gold falling 0.4% to $1903.60/ounce and WTI crude adding 3.6% to $39.00/barrel. On the data front, a report from ADP showed that private payrolls increased 365,000 in October, well below September’s gain of 750,000 jobs. Separately, the Institute for Supply Management Services Index eased to 56.6 in October from 57.8 the prior month. |
 Kenneth J. Gruneisen started out as a licensed stockbroker in August 1987, a couple of months prior to the historic stock market crash that took the Dow Jones Industrial Average down -22.6% in a single day. He has published daily fact-based fundamental and technical analysis on high-ranked stocks online for two decades. Through FACTBASEDINVESTING.COM, Kenneth provides educational articles, news, market commentary, and other information regarding proven investment systems that work in good times and bad.
Comments contained in the body of this report are technical opinions only and are not necessarily those of Gruneisen Growth Corp. The material herein has been obtained from sources believed to be reliable and accurate, however, its accuracy and completeness cannot be guaranteed. Our firm, employees, and customers may effect transactions, including transactions contrary to any recommendation herein, or have positions in the securities mentioned herein or options with respect thereto. Any recommendation contained in this report may not be suitable for all investors and it is not to be deemed an offer or solicitation on our part with respect to the purchase or sale of any securities. |
|
 |
Retail, Biotech, and Semiconductor Indexes Led Group Gainers
Kenneth J. Gruneisen - Passed the CAN SLIM® Master's Exam
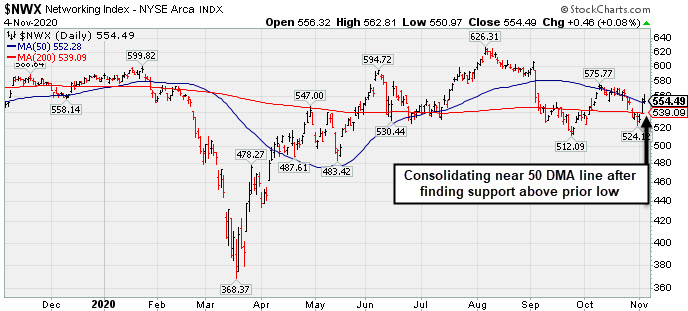
The Retail Index ($RLX +3.98%) posted a solid gain but the Broker/Dealer Index ($XBD -0.16%) sputtered for a small loss and the Bank Index ($BKX -5.03%) slumped badly. The Biotech Index ($BTK +5.88%) outpaced the Semiconductor Index ($SOX +3.54%) while the Networking Index ($NWX +0.08%) finished flat. The Gold & Silver Index ($XAU -2.72%) slumped while the energy-linked Oil Services Index ($OSX -0.55%) and Integrated Oil Index ($XOI +0.34%) were mixed and little changed.
PICTURED: The Networking Index ($NWX +0.08%) halted its slide above the prior low but it is sputtering near its 50-day moving average (DMA) line which has acted as resistance.
| Oil Services |
$OSX |
29.36 |
-0.16 |
-0.55% |
-62.50% |
| Integrated Oil |
$XOI |
587.45 |
+1.98 |
+0.34% |
-53.76% |
| Semiconductor |
$SOX |
2,384.24 |
+81.51 |
+3.54% |
+28.90% |
| Networking |
$NWX |
554.49 |
+0.46 |
+0.08% |
-4.96% |
| Broker/Dealer |
$XBD |
305.91 |
-0.49 |
-0.16% |
+5.35% |
| Retail |
$RLX |
3,478.52 |
+133.03 |
+3.98% |
+42.02% |
| Gold & Silver |
$XAU |
143.40 |
-4.01 |
-2.72% |
+34.12% |
| Bank |
$BKX |
77.00 |
-4.08 |
-5.03% |
-32.08% |
| Biotech |
$BTK |
5,620.06 |
+311.89 |
+5.88% |
+10.91% |
|
|
|
 |
Rebound Above 50-Day Moving Average Helped Technical Stance
Kenneth J. Gruneisen - Passed the CAN SLIM® Master's Exam
Trex Company Inc (TREX +$4.42 or +6.23% to $75.32) rebounded above its 50-day moving average (DMA) line ($72.83) today with a big volume-driven gain helping its technical stance and outlook improve. The prior low ($63.32 on 9/21/20) defines the next near-term support. Recently it reported Sep '20 quarterly earnings +14% on +19% sales revenues versus the year ago period, below the +25% minimum guideline (C criteria) raising fundamental concerns while breaking a streak of 4 consecutive quarterly comparisons above the +25% minimum earnings guideline (C criteria).
TREX last appeared in this FSU section on 10/16/20 with an annotated graph under the headline, "Recently Wedged Into New High Territory". It has a 96 Earnings Per Share Rating. Annual earnings (A criteria) growth has been strong. The company hails from the General Building Materials industry group which currently has a Group Relative Strength Rating of (84) A.
The company has a new CEO as of 4/29/20. After a 2:1 share split effective 9/15/20 it now has a supply (S criteria) of 115.8 million shares outstanding. The number of top-rated funds owning its shares rose from 540 in Jun '19 to 771 in Sep '20, a reassuring sign concerning the I criteria. Its current Up/Down Volume Ratio of 0.7 is an unbiased indication its shares have been under distributional pressure over the past 50 days. It has a Timeliness rating of B and a Sponsorship Rating of C.
|
|
|
Color Codes Explained :
Y - Better candidates highlighted by our
staff of experts.
G - Previously featured
in past reports as yellow but may no longer be buyable under the
guidelines.
***Last / Change / Volume data in this table is the closing quote data***
Symbol/Exchange
Company Name
Industry Group |
PRICE |
CHANGE
(%Change) |
Day High |
Volume
(% DAV)
(% 50 day avg vol) |
52 Wk Hi
% From Hi |
Featured
Date |
Price
Featured |
Pivot Featured |
|
Max Buy |
 CRL
-
NYSE
CRL
-
NYSE
Charles River Labs Intl
DRUGS - Biotechnology
|
$249.27
|
+11.82
4.98% |
$252.12
|
679,273
203.99% of 50 DAV
50 DAV is 333,000
|
$250.29
-0.41%
|
7/15/2020
|
$192.66
|
PP = $189.95
|
|
MB = $199.45
|
 Most Recent Note - 11/4/2020 5:16:38 PM
G - Hit a new all-time high with today's big volume-driven gain. Found prompt support near its 50 DMA line ($226). Reported Sep '20 quarterly earnings +38% on +11% sales revenues versus the year ago period, above the +25% minimum earnings guideline (C criteria).
>>> FEATURED STOCK ARTICLE : Earnings Due; Consolidating Near Prior High and Above 50 DMA Line - 10/27/2020 |
View all notes |
Set NEW NOTE alert |
Company Profile |
SEC
News |
Chart |
Request a new note
C
A
S
I |
AMD
-
NASDAQ
Advanced Micro Devices
ELECTRONICS - Semiconductor - Broad Line
|
$81.35
|
+4.77
6.23% |
$81.85
|
66,258,096
122.39% of 50 DAV
50 DAV is 54,137,000
|
$94.28
-13.71%
|
8/31/2020
|
$90.42
|
PP = $87.39
|
|
MB = $91.76
|
Most Recent Note - 11/4/2020 5:15:29 PM
G - Gapped up and rebounded near its 50 DMA line ($81.26) with today's volume-driven gain. Subsequent losses and deterioration below the recent low would raise greater concerns and trigger a more worrisome technical sell signal. Faces near-term resistance due to overhead supply up to the $94 level. See the latest FSU analysis for more details and an annotated graph.
>>> FEATURED STOCK ARTICLE : Weak Action Raised Concern While Testing Recent Low - 11/3/2020 |
View all notes |
Set NEW NOTE alert |
Company Profile |
SEC
News |
Chart |
Request a new note
C
A
S
I |
TER
-
NASDAQ
Teradyne Inc
ELECTRONICS - Semiconductor Equipment and Mate
|
$95.85
|
+6.02
6.70% |
$96.43
|
2,551,409
108.20% of 50 DAV
50 DAV is 2,358,000
|
$93.44
2.58%
|
10/21/2020
|
$92.22
|
PP = $93.54
|
|
MB = $98.22
|
Most Recent Note - 11/4/2020 5:22:42 PM
Y - Hit a new all-time high with today's big gain backed by only +8% above average volume. Gains above a stock's pivot point must be backed by at least +40% above average volume to trigger a proper technical buy signal. Reported earnings +53% on +41% sales revenues for the Sep '20 quarter versus the year ago period, its 4th consecutive quarterly comparison with earnings above the +25% minimum earnings guideline (C criteria). Sequential comparisons show encouraging acceleration in its sales revenues growth rate. Its annual earnings (A criteria) history has been strong.
>>> FEATURED STOCK ARTICLE : Challenging All-Time High With Volume-Drive Gain - 10/21/2020 |
View all notes |
Set NEW NOTE alert |
Company Profile |
SEC
News |
Chart |
Request a new note
C
A
S
I |
TREX
-
NYSE
Trex Company Inc
MATERIALS and CONSTRUCTION - General Building Materials
|
$75.32
|
+4.42
6.23% |
$76.30
|
1,028,248
129.34% of 50 DAV
50 DAV is 795,000
|
$81.23
-7.28%
|
6/26/2020
|
$54.53
|
PP = $66.47
|
|
MB = $69.79
|
Most Recent Note - 11/4/2020 5:12:21 PM
G - Rebounded above its 50 DMA line ($72.86) with today's volume-driven gain. Prior low ($63.32 on 9/21/20) defines the next near-term support. Reported Sep '20 quarterly earnings +14% on +19% sales revenues versus the year ago period, below the +25% minimum guideline (C criteria) raising fundamental concerns. See the latest FSU analysis for more details and a new annotated graph.
>>> FEATURED STOCK ARTICLE : Rebound Above 50-Day Moving Average Helped Technical Stance - 11/4/2020 |
View all notes |
Set NEW NOTE alert |
Company Profile |
SEC
News |
Chart |
Request a new note
C
A
S
I |
LGIH
-
NASDAQ
L G I Homes Inc
Bldg-Resident/Comml
|
$120.98
|
+6.19
5.39% |
$122.81
|
364,682
139.72% of 50 DAV
50 DAV is 261,000
|
$132.98
-9.02%
|
10/1/2020
|
$123.17
|
PP = $124.04
|
|
MB = $130.24
|
Most Recent Note - 11/4/2020 5:18:32 PM
G - Reported Sep '20 quarterly earnings +27% on +11% sales revenues versus the year ago period. Posted a 3rd consecutive gain today with above average volume, rising and closing back above the 50 DMA line ($116.35) helping its outlook to improve. Members were cautioned with recent notes - "Recent gains above the new pivot point lacked the +40% above average volume needed to clinch a proper new (or add-on) technical buy signal."
>>> FEATURED STOCK ARTICLE : Hovering Near High But Recent Gains Lacked Great Volume - 10/19/2020 |
View all notes |
Set NEW NOTE alert |
Company Profile |
SEC
News |
Chart |
Request a new note
C
A
S
I |
Symbol/Exchange
Company Name
Industry Group |
PRICE |
CHANGE
(%Change) |
Day High |
Volume
(% DAV)
(% 50 day avg vol) |
52 Wk Hi
% From Hi |
Featured
Date |
Price
Featured |
Pivot Featured |
|
Max Buy |
NOW
-
NYSE
Servicenow Inc
Computer Sftwr-Enterprse
|
$513.58
|
+33.53
6.98% |
$518.23
|
2,212,810
168.15% of 50 DAV
50 DAV is 1,316,000
|
$533.37
-3.71%
|
8/20/2020
|
$453.34
|
PP = $454.79
|
|
MB = $477.53
|
Most Recent Note - 11/4/2020 12:40:00 PM
G - Gapped up today finding prompt support and rebounding above its 50 DMA line ($487) with today's volume-driven gain helping its outlook improve. Prior low ($432.85 on 9/08/20) defines the next important support where any violation would raise greater concerns. Recently reported Sep '20 quarterly earnings +22% on +30% sales revenues versus the year ago period, below the +25% minimum guideline (C criteria) of the fact-based investment system.
>>> FEATURED STOCK ARTICLE : Found Prompt Support at 50 DMA Line After Earnings News - 10/29/2020 |
View all notes |
Set NEW NOTE alert |
Company Profile |
SEC
News |
Chart |
Request a new note
C
A
S
I |
VEEV
-
NYSE
Veeva Systems Inc Cl A
Computer Sftwr-Medical
|
$284.40
|
+13.46
4.97% |
$287.92
|
860,856
102.73% of 50 DAV
50 DAV is 838,000
|
$313.99
-9.42%
|
10/6/2020
|
$287.71
|
PP = $298.86
|
|
MB = $313.80
|
Most Recent Note - 11/4/2020 5:24:01 PM
G - Rebounded above its 50 DMA line ($282) today helping its outlook improve after damaging losses triggered a technical sell signal. Fundamentals remain strong.
>>> FEATURED STOCK ARTICLE : Recently Slumped Back Below Prior Highs - 10/26/2020 |
View all notes |
Set NEW NOTE alert |
Company Profile |
SEC
News |
Chart |
Request a new note
C
A
S
I |
TEAM
-
NASDAQ
Atlassian Corp Plc Cl A
Comp Sftwr-Spec Enterprs
|
$188.82
|
+6.76
3.71% |
$193.95
|
1,960,663
113.86% of 50 DAV
50 DAV is 1,722,000
|
$216.30
-12.70%
|
10/12/2020
|
$193.77
|
PP = $199.60
|
|
MB = $209.58
|
Most Recent Note - 11/4/2020 5:20:38 PM
G - Gapped up today and rebounded above its 50 DMA line ($188) finding support after damaging losses on higher volume triggered a technical sell signal. Reported earnings +7% on +26% sales revenues for the Sep '20 quarter versus the year ago period, well below the +25% minimum earnings guideline (C criteria), raising concerns.
>>> FEATURED STOCK ARTICLE : Weak Technical Action Followed Disappointing Fundamental News - 11/2/2020 |
View all notes |
Set NEW NOTE alert |
Company Profile |
SEC
News |
Chart |
Request a new note
C
A
S
I |
|
|
|
THESE ARE NOT BUY RECOMMENDATIONS!
Comments contained in the body of this report are technical
opinions only. The material herein has been obtained
from sources believed to be reliable and accurate, however,
its accuracy and completeness cannot be guaranteed.
This site is not an investment advisor, hence it does
not endorse or recommend any securities or other investments.
Any recommendation contained in this report may not
be suitable for all investors and it is not to be deemed
an offer or solicitation on our part with respect to
the purchase or sale of any securities. All trademarks,
service marks and trade names appearing in this report
are the property of their respective owners, and are
likewise used for identification purposes only.
This report is a service available
only to active Paid Premium Members.
You may opt-out of receiving report notifications
at any time. Questions or comments may be submitted
by writing to Premium Membership Services 665 S.E. 10 Street, Suite 201 Deerfield Beach, FL 33441-5634 or by calling 1-800-965-8307
or 954-785-1121.
|
|
|