Help Lines 954-785-1121


You are not logged in. Upgrade Here
 <<<Previous Mid Day Report     Next Mid Day Report >>> 
 <<<Previous After Market Report Next After Market Report >>> 
You are not logged in.
This means you CAN ONLY VIEW reports that were published prior to Sunday, February 25, 2024.
You MUST UPGRADE YOUR MEMBERSHIP if you want to see any current reports.

AFTER MARKET UPDATE - MONDAY, NOVEMBER 4TH, 2019
Previous After Market Report Next After Market Report >>>
Indices NYSE Nasdaq
DOW  +114.75 27,462.11 +0.42% Volume 951,747,680 +11% Volume 2,136,234,750 +4%
NASDAQ +46.80 8,433.20 +0.56% Advancers 1,771 62% Advancers 1,893 61%
S&P 500 +11.36 3,078.27 +0.37% Decliners 1,082 38% Decliners 1,227 39%
Russell 2000 +8.07 1,597.40 +0.51% 52 Wk Highs 214   52 Wk Highs 248  
S&P 600 +8.39 988.81 +0.86% 52 Wk Lows 11   52 Wk Lows 45  

Major Indices Hit New Record Highs

The Dow climbed 114 points, notching its first all-time high since mid-July and now on course for its best one-year advance since 2017. The S&P 500 added 0.4%, while the Nasdaq Composite was up 0.6%. Advancers led decliners by a 3-2 margin on the NYSE and on the Nasdaq exchange. There were 104 high-ranked companies from the Leaders List that hit a new 52-week high and were listed on the BreakOuts Page, versus the total of 81 on the prior session. New 52-week highs totals expanded and easily outnumbered shrinking new 52-week lows totals on the NYSE and on the Nasdaq exchange. The major indices (M criteria) are in a "confirmed uptrend" after enduring distributional pressure in recent weeks. The Featured Stocks Page provides the most timely analysis on high-ranked leaders.
Charts used courtesy of www.stockcharts.com

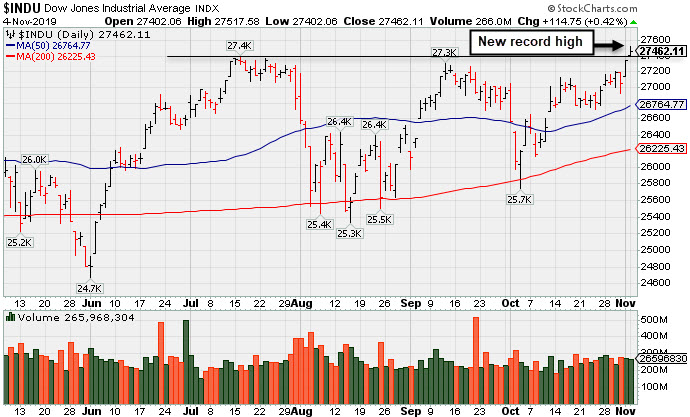
PICTURED: The Dow Jones Industrial Average hit a new record high. 

Stocks finished higher Monday, with the Dow, S&P 500, and Nasdaq Composite all closing at record levels. U.S.-China trade optimism fueled the gains, as expectations remain elevated for a partial trade deal to be signed later this month. 

On the trade front, U.S. Commerce Secretary Wilbur Ross commented over the weekend that Washington and Beijing are making “good progress” in negotiations, and that American companies should be provided licenses to conduct business with Chinese telecom giant Huawei Technologies “very shortly.”

Seven of 11 S&P 500 sectors closed in positive territory. Energy shares paced gains, jumping more than 3% as WTI crude rose 0.6% to $56.54/barrel. The laggards included the Utilities and Real Estate groups, each down at least 1.1%. In earnings, Berkshire Hathaway (BRKB +1.00%) after delivering profit and revenue figures above consensus forecasts. Despite positive quarterly results, Under Armour (UA -18.35%) fell on news the company is undergoing a Federal investigation of its accounting practices. In other corporate news, Wright Medical Group (WMGI +31.94%) after agreeing to be purchased by Stryker for roughly $4 billion. Shares of McDonald’s (MCD -2.72%) following the unexpected firing of its CEO.

Treasuries slumped, sending the yield on the benchmark 10-year note up six basis points to 1.78%. On the data front, factory and durable goods orders both fell more than expected in September, down 0.6% and 1.2%, respectively.

Kenneth J. Gruneisen started out as a licensed stockbroker in August 1987, a couple of months prior to the historic stock market crash that took the Dow Jones Industrial Average down -22.6% in a single day. He has published daily fact-based fundamental and technical analysis on high-ranked stocks online for two decades. Through FACTBASEDINVESTING.COM, Kenneth provides educational articles, news, market commentary, and other information regarding proven investment systems that work in good times and bad.

Comments contained in the body of this report are technical opinions only and are not necessarily those of Gruneisen Growth Corp. The material herein has been obtained from sources believed to be reliable and accurate, however, its accuracy and completeness cannot be guaranteed. Our firm, employees, and customers may effect transactions, including transactions contrary to any recommendation herein, or have positions in the securities mentioned herein or options with respect thereto. Any recommendation contained in this report may not be suitable for all investors and it is not to be deemed an offer or solicitation on our part with respect to the purchase or sale of any securities.


Energy, Financial, and Semiconductor Indexes Led Group Gainers

The Bank Index ($BKX +1.96%) and the Broker/Dealer Index ($XBD +1.56%) both posted solid gains and outpaced the Retail Index ($RLX +0.27%). The tech sector was mixed as the Semiconductor Index ($SOX +2.19%) outpaced the Networking Index ($NWX +0.35%) while the Biotech Index ($BTK -0.25%) ended slightly lower. The Oil Services Index ($OSX +4.63%) was a standout gainer and the Integrated Oil Index ($XOI +2.25%), meanwhile, the Gold & Silver Index ($XAU -1.35%) fell.
Charts courtesy of www.stockcharts.com

PICTURED: The Biotech Index ($BTK -0.25%) found support above its Dec '18 low and has recently rebounded above its 50-day moving average (DMA) line, however there is a lot of overhead supply to act as resistance.

Industry Index Symbol Close Change % Change YTD % Change
Oil Services $OSX  71.44 +3.16 +4.63% -11.36%
Integrated Oil $XOI  1,274.26 +28.09 +2.25% +9.94%
Semiconductor $SOX  1,726.92 +36.99 +2.19% +49.49%
Networking $NWX  545.87 +1.88 +0.35% +11.70%
Broker/Dealer $XBD  273.17 +4.19 +1.56% +15.09%
Retail $RLX  2,423.07 +6.44 +0.27% +24.17%
Gold & Silver $XAU  94.65 -1.29 -1.34% +33.95%
Bank $BKX  107.87 +2.07 +1.96% +25.74%
Biotech $BTK  4,515.61 -11.29 -0.25% +6.98%


Testing 50-Day Moving Average With Loss on Above Average Volume

Lululemon Athletica (LULU -$4.21 or -2.10% to $196.48) pulled back for a 3rd consecutive loss today with higher volume while testing support at its 50-day moving average (DMA) line. More damaging losses may trigger a technical sell signal.

Recent gains into new high territory were lacking great volume conviction indicative of institutional buying demand. It was last shown in this FSU section was on 10/18/19 with an annotated graph under the headline, "LULU Stretches to Hit New Record High". The recent low ($185.36 on 10/03/19) defines important near-term support where any violation would raise serious concerns and trigger a worrisome technical sell signal.

LULU reported earnings +35% on +22% sales revenues for the Jul '19 quarter, marking its 7th consecutive quarterly comparison above the +25% minimum guideline (C criteria). Recent quarterly comparisons showed stronger sales revenues and earnings improvement helping it match with the fact-based investment system's fundamental guidelines. It has a new CEO as of 8/20/18. It currently has a 96 Earnings Per Share Rating. Its Timeliness rating is A and Sponsorship rating is C.

The number of top-rated funds owning its shares rose from 1,041 in Jun '18 to 1,432 in Sep '19, a good sign concerning the I criteria. LULU was first featured in yellow at $23.83 (split adjusted after 2:1 split effective 7/21/11) in the October 8, 2010 mid-day report (read here) and it traded up as much as +163.7% in a little more than 9 months. As previously noted - "In a bullish market, many high-ranked leaders offer multiple opportunities to accumulate their shares under the fact-based system's strict guidelines. Patience may often allow another ideal base or secondary buy point to possibly develop and be noted."  

Charts courtesy of www.stockcharts.com


Color Codes Explained :
Y - Better candidates highlighted by our staff of experts.
G - Previously featured in past reports as yellow but may no longer be buyable under the guidelines.

***Last / Change / Volume data in this table is the closing quote data***
Symbol/Exchange
Company Name
Industry Group
PRICE CHANGE
(%Change)
Day High Volume
(% DAV)
(% 50 day avg vol)
52 Wk Hi
% From Hi
Featured
Date
Price
Featured
Pivot Featured
Max Buy
StockCharts.com Latest Chart for MLR MLR - NYSE
Miller Industries Inc
AUTOMOTIVE - Auto Parts  
$36.08 +0.31
0.87%

$36.38

57,807
160.58% of 50 DAV
50 DAV is 36,000
$36.34
-0.72%
9/24/2019 $34.00 PP = $35.36
MB = $37.13
Most Recent Note - 11/4/2019 12:23:11 PM
Y - Holding its ground stubbornly near its 52-week high following volume-driven gains last week which triggered a technical buy signal. Fundamentals remain strong.
>>> FEATURED STOCK ARTICLE : Hit New High But Did Not Close Session Above Pivot Point - 10/29/2019
 |  View all notes | Set NEW NOTE alert | Company Profile | SEC News | Chart | Request a new note C A  S  I 
StockCharts.com Latest Chart for CCBG CCBG - NASDAQ
Capital City Bk Gp
BANKING - Regional - Mid-Atlantic Banks  
$29.79 +0.67
2.28%

$30.09

59,806
192.92% of 50 DAV
50 DAV is 31,000
$29.23
1.92%
9/13/2019 $27.03 PP = $27.05
MB = $28.40
Most Recent Note - 11/4/2019 12:00:54 PM
G - Hitting another new 52-week high with today's gap up gain, getting more extended from the prior base. Prior highs define important support to watch along with its 50 DMA line ($26.71).
>>> FEATURED STOCK ARTICLE : Noted "Positive Reversal" on Volatile Session After Earnings - 10/31/2019
 |  View all notes | Set NEW NOTE alert | Company Profile | SEC News | Chart | Request a new note C A  S  I 
StockCharts.com Latest Chart for AUDC AUDC - NASDAQ
Audiocodes Ltd
ELECTRONICS - Scientific and Technical Instrum  
$21.37 +0.48
2.30%

$21.60

267,022
116.10% of 50 DAV
50 DAV is 230,000
$22.50
-5.02%
9/13/2019 $19.68 PP = $19.84
MB = $20.83
Most Recent Note - 11/4/2019 5:22:35 PM
Y - Posted a gain today with slightly above average volume. Reported earnings +26% on +15% sales revenues for the Sep '19 quarter. Rallied above the prior pivot point with last week's volume driven gains. Recent low ($17.54 on 10/08/19) defines the next important support.
>>> FEATURED STOCK ARTICLE : Consolidating Above 50-Day Average But Below Prior Pivot Point - 10/21/2019
 |  View all notes | Set NEW NOTE alert | Company Profile | SEC News | Chart | Request a new note C A  S  I 
StockCharts.com Latest Chart for CHDN CHDN - NASDAQ
Churchill Downs Inc
LEISURE - Gaming Activities  
$124.27 -4.84
-3.75%

$128.98

463,701
173.67% of 50 DAV
50 DAV is 267,000
$135.32
-8.17%
10/8/2019 $129.77 PP = $132.83
MB = $139.47
Most Recent Note - 11/4/2019 5:19:06 PM
G - Retreating from its all-time high, it violated its 50 DMA line ($126) with today's volume-driven loss and its color code is changed to green. Reported Sep '19 earnings +4% on +38% sales revenues versus the year ago period, its 2nd consecutive quarterly comparison below the +25% minimum earnings guideline (C criteria), raising greater fundamental concerns. See the latest FSU analysis for more details and an annotated graph.
>>> FEATURED STOCK ARTICLE : Perched at Record High at Time of Quarterly Report - 10/30/2019
 |  View all notes | Set NEW NOTE alert | Company Profile | SEC News | Chart | Request a new note C A  S  I 
StockCharts.com Latest Chart for LULU LULU - NASDAQ
Lululemon Athletica
MANUFACTURING - Textile Manufacturing  
$196.48 -4.21
-2.10%

$204.00

2,638,192
139.07% of 50 DAV
50 DAV is 1,897,000
$209.02
-6.00%
9/6/2019 $201.25 PP = $194.35
MB = $204.07
Most Recent Note - 11/4/2019 5:16:56 PM
G - After wedging higher with gains lacking great volume conviction it is testing its 50 DMA line ($195.60) with losses on higher volume. The prior low ($185.36 on 10/03/19) defines the next important near-term support. See the latest FSU analysis for more details and a new annotated graph.
>>> FEATURED STOCK ARTICLE : Testing 50-Day Moving Average With Loss on Above Average Volume - 11/4/2019
 |  View all notes | Set NEW NOTE alert | Company Profile | SEC News | Chart | Request a new note C A  S  I 
Symbol/Exchange
Company Name
Industry Group
PRICE CHANGE
(%Change)
Day High Volume
(% DAV)
(% 50 day avg vol)
52 Wk Hi
% From Hi
Featured
Date
Price
Featured
Pivot Featured
Max Buy
StockCharts.com Latest Chart for CPRT CPRT - NASDAQ
Copart Inc
SPECIALTY RETAIL - Auto Dealerships  
$82.14 -0.77
-0.93%

$84.19

1,329,625
87.48% of 50 DAV
50 DAV is 1,520,000
$85.31
-3.72%
9/5/2019 $79.13 PP = $79.84
MB = $83.83
Most Recent Note - 11/4/2019 5:21:12 PM
G - Consolidating above its 50 DMA line ($80.76) which defines near-term support above the prior low ($76.35 on 10/03/19). Wedged to new all-time highs with recent gains lacking great volume conviction.
>>> FEATURED STOCK ARTICLE : Reversed Into Red Today After Hitting New All-Time High - 10/22/2019
 |  View all notes | Set NEW NOTE alert | Company Profile | SEC News | Chart | Request a new note C A  S  I 
StockCharts.com Latest Chart for BLD BLD - NYSE
Topbuild Corp
Bldg-Constr Prds/Misc  
$108.28 -1.99
-1.80%

$110.57

475,075
172.75% of 50 DAV
50 DAV is 275,000
$110.29
-1.82%
5/17/2019 $82.19 PP = $87.31
MB = $91.68
Most Recent Note - 11/4/2019 5:24:04 PM
G - Pulled back today after getting very extended from any sound base and powering to all-time highs with volume-driven gains. Reported earnings +24% on +5% sales revenues for the Sep '19 quarter versus the year ago period, just below the +25% minimum guideline (C criteria). Found prompt support near its 50 DMA line ($96) during its ongoing ascent.
>>> FEATURED STOCK ARTICLE : Pulling Back After Recently Wedging Into New High Territory - 10/23/2019
 |  View all notes | Set NEW NOTE alert | Company Profile | SEC News | Chart | Request a new note C A  S  I 

THESE ARE NOT BUY RECOMMENDATIONS!  Comments contained in the body of this report are technical opinions only. The material herein has been obtained from sources believed to be reliable and accurate, however, its accuracy and completeness cannot be guaranteed. This site is not an investment advisor, hence it does not endorse or recommend any securities or other investments. Any recommendation contained in this report may not be suitable for all investors and it is not to be deemed an offer or solicitation on our part with respect to the purchase or sale of any securities. All trademarks, service marks and trade names appearing in this report are the property of their respective owners, and are likewise used for identification purposes only.

This report is a service available only to active Paid Premium Members. You may opt-out of receiving report notifications at any time.  Questions or comments may be submitted by writing to Premium Membership Services 665 S.E. 10 Street, Suite 201 Deerfield Beach, FL 33441-5634 or by calling 1-800-965-8307 or 954-785-1121.

Kenneth J. Gruneisen founded Gruneisen Growth Corp. (2003), which prior to May 11, 2015, operated CANSLIM.net and CANSLIM.com both under license from Data Analysis Inc. / Investor's Business Daily. Kenneth has passed the CAN SLIM® Master's Exam. Gruneisen Growth Corp. now continues over two decades of fact based market analysis via FactBasedInvesting.com.

Copyright © 1996-2024 Gruneisen Growth Corp. All rights reserved. Protected by the copyright laws of the United States and Canada and by international treaties

Privacy Policy | Terms of Use | Contact Us