You are not logged in.
This means you
CAN ONLY VIEW reports that were published prior to Sunday, February 25, 2024.
You
MUST UPGRADE YOUR MEMBERSHIP if you want to see any current reports.
AFTER MARKET UPDATE - TUESDAY, NOVEMBER 3RD, 2020
Previous After Market Report Next After Market Report >>>
|
|
|
|
DOW |
+554.98 |
27,480.03 |
+2.06% |
|
Volume |
861,857,024 |
-3% |
|
Volume |
3,199,026,300 |
+1% |
|
NASDAQ |
+204.14 |
11,161.75 |
+1.86% |
|
Advancers |
2,407 |
80% |
|
Advancers |
2,680 |
79% |
|
S&P 500 |
-28.79 |
3,467.31 |
-0.82% |
|
Decliners |
606 |
20% |
|
Decliners |
699 |
21% |
|
Russell 2000 |
+45.70 |
1,614.30 |
+2.91% |
|
52 Wk Highs |
62 |
|
|
52 Wk Highs |
52 |
|
|
S&P 600 |
+23.51 |
918.90 |
+2.63% |
|
52 Wk Lows |
13 |
|
|
52 Wk Lows |
27 |
|
|
The major indices have clearly seen the latest uptrend come under heavy distributional pressure while leadership has waned. Disciplined investors limit exposure in rough markets and always raise cash by selling individual holdings on a case by case basis as technical weakness is noted.
|
 |
Breadth Positive as Major Indices Rallied with Greater Leadership
Kenneth J. Gruneisen - Passed the CAN SLIM® Master's Exam
The S&P 500 finished 1.8% higher, with value-oriented stocks continuing their recent run of outperformance. The Dow added 554 points while the Nasdaq Composite advanced 1.9%. The reported volume totals were mixed, lighter than the prior session on the NYSE and higher on the Nasdaq exchange. Breadth was positive as advancers led decliners by almost a 4-1 margin on the NYSE and on the Nasdaq exchange. There were 31 high-ranked companies from the Leaders List that hit new 52-week highs and were listed on the BreakOuts Page, versus the total of 19 on the prior session. The new 52-week highs expanded and outnumbered new 52-week lows on the NYSE and on the Nasdaq exchange. The major indices have seen their uptrend come under heavier pressure (M criteria) with uncertainty raising some concerns of a more serious market correction. Investors are reminded to always make buying and selling decisions based based on the strict criteria and rules of the fact-based investment system. 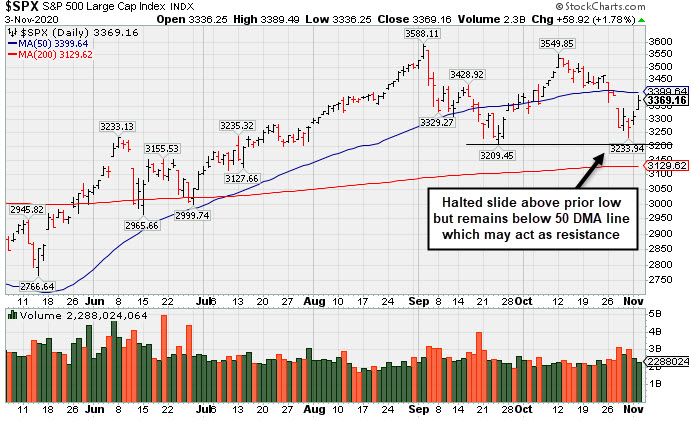 PICTURED: The S&P 500 Index recently undercut its 50-day moving average (DMA) line slumping toward the September low.
U.S. stocks rallied on Tuesday as Americans headed to the polls to vote in the 2020 U.S. election. While polling data is expected to begin trickling in Tuesday evening, a delayed result in the presidential election remains a distinct possibility amid COVID-related changes to the voting process.
Ten of 11 sectors in the S&P 500 finished the session in positive territory, with Industrials and Financials pacing the gains and Energy stocks lagging. In earnings, PayPal Holdings (PYPL -4.23%) fell as the digital payment facilitator issued tepid forward guidance. Arista Networks (ANET +15.44%) rallied for its best session in three years after the cloud-computing company raised its full-year outlook. McKesson (MCK +5.25%) and Humana (HUM +3.63%) rose after both health care companies topped analyst profit and sales projections. In other corporate news, Twitter (TWTR +5.73%) rose amid news the social media giant plans to retain CEO Jack Dorsey.
Treasuries slumped on Election Day, with the yield on the benchmark 10-year note rising four basis points to 0.89%, the highest closing level since June. Commodities advanced, with COMEX gold climbing 0.8% to $1908.10 and WTI crude adding 3% to $37.92/barrel. On the data front, a release revealed that core capital goods orders increased 1.0% to a six-year high in September. |
 Kenneth J. Gruneisen started out as a licensed stockbroker in August 1987, a couple of months prior to the historic stock market crash that took the Dow Jones Industrial Average down -22.6% in a single day. He has published daily fact-based fundamental and technical analysis on high-ranked stocks online for two decades. Through FACTBASEDINVESTING.COM, Kenneth provides educational articles, news, market commentary, and other information regarding proven investment systems that work in good times and bad.
Comments contained in the body of this report are technical opinions only and are not necessarily those of Gruneisen Growth Corp. The material herein has been obtained from sources believed to be reliable and accurate, however, its accuracy and completeness cannot be guaranteed. Our firm, employees, and customers may effect transactions, including transactions contrary to any recommendation herein, or have positions in the securities mentioned herein or options with respect thereto. Any recommendation contained in this report may not be suitable for all investors and it is not to be deemed an offer or solicitation on our part with respect to the purchase or sale of any securities. |
|
 |
Financial, Retail, Tech, and Commodity-Linked Groups Rose
Kenneth J. Gruneisen - Passed the CAN SLIM® Master's Exam
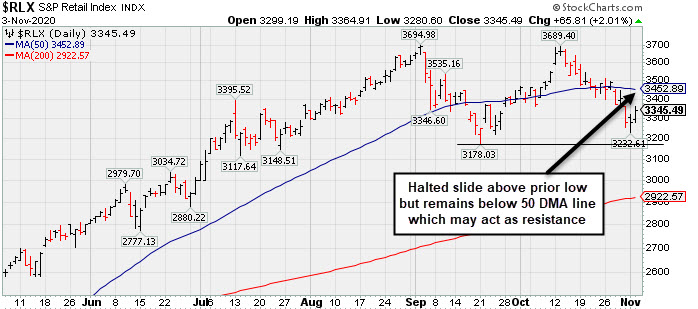
The major indices were boosted by strength in financial shares as the Broker/Dealer Index ($XBD +2.34%) and Bank Index ($BKX +2.71%) both notched solid gains and the Retail Index ($RLX +2.01%) also rose for a considerable gain. The Networking Index ($NWX +4.13%) led the tech sector higher while the Semiconductor Index ($SOX +1.94%) and Biotech Index ($BTK +1.58%) both posted solid gains. Commodity-linked groups also had a positive bias as the Gold & Silver Index ($XAU +1.88%) and Oil Services Index ($OSX +1.31%) both outpaced the Integrated Oil Index ($XOI -0.10%).
PICTURED: The Retail Index ($RLX +2.01%) halted its slide above the prior low but it has been sputtering below its 50-day moving average (DMA) line again.
| Oil Services |
$OSX |
29.52 |
+0.38 |
+1.31% |
-62.29% |
| Integrated Oil |
$XOI |
585.47 |
-0.57 |
-0.10% |
-53.92% |
| Semiconductor |
$SOX |
2,303.91 |
+43.84 |
+1.94% |
+24.56% |
| Networking |
$NWX |
554.03 |
+21.99 |
+4.13% |
-5.04% |
| Broker/Dealer |
$XBD |
306.40 |
+7.00 |
+2.34% |
+5.52% |
| Retail |
$RLX |
3,345.49 |
+65.81 |
+2.01% |
+36.59% |
| Gold & Silver |
$XAU |
147.41 |
+2.72 |
+1.88% |
+37.87% |
| Bank |
$BKX |
81.07 |
+2.14 |
+2.71% |
-28.48% |
| Biotech |
$BTK |
5,308.17 |
+82.66 |
+1.58% |
+4.75% |
|
|
|
 |
Weak Action Raised Concern While Testing Recent Low
Kenneth J. Gruneisen - Passed the CAN SLIM® Master's Exam
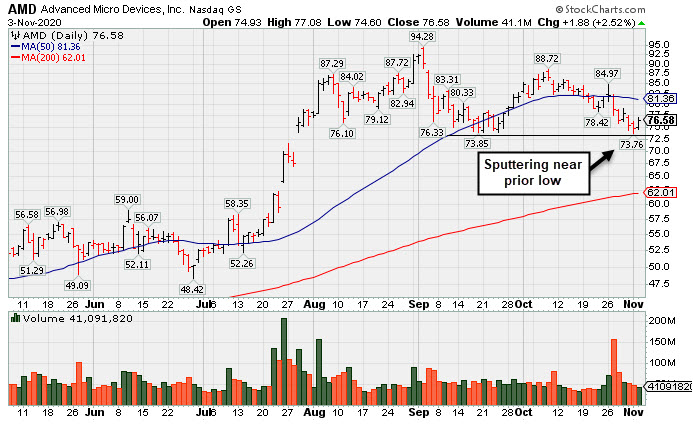
Advanced Micro Devices (AMD $76.58 +$1.88 +2.52%) posted a gain today with light volume. Losses with heavy volume raised concerns recently while slumping and testing the prior low ($73.85 on 9/18/20). Weak action came after it reported earnings +128% on +56% sales revenues for the Sep '20 quarter versus the year ago period and announced plans to acquire Xilinx Inc (XLNX). Any more damaging losses would raise greater concerns and trigger a more worrisome technical sell signal. Meanwhile, it faces near-term resistance due to overhead supply up to the $94 level.
The 5 latest quarterly comparisons through Sep '20 showed very strong earnings increases well above the +25% minimum guideline (C criteria) with strong underlying sales revenues growth versus the year ago periods. Annual earnings growth (A criteria) has been very strong after losses in FY '15 and '16. it has a highest possible 99 Earnings Per Share Rating.
AMD traded up more than +70% since highlighted in yellow in the 6/09/20 mid-day report (read here). A new pivot point had been cited in late August after an advanced "3-weeks tight" base pattern, but the rally above it was short lived. It was last shown in this FSU section on 10/14/20 with an annotated graph under the headline, "Consolidating Just Above 50-Day Moving Average".
AMD hails from the Electronics - Semiconductor Fabless industry which has a Group Relative Strength Rating of 90 (L criteria). It has a large supply of 1.20 billion shares outstanding (S criteria), which makes it less likely to be a quick sprinter. However, the number of top-rated funds owning its shares rose from 1,669 in Jun '19 to 2,242 in Sep '20, a reassuring sign concerning the I criteria. Its current Up/Down Volume Ratio of 0.8 is an unbiased indication its shares have been under slight distributional pressure over the past 50 days. It has a Timeliness Rating of B, a Sponsorship Rating of B, and an Accumulation/Distribution rating of C-.
|
|
|
Color Codes Explained :
Y - Better candidates highlighted by our
staff of experts.
G - Previously featured
in past reports as yellow but may no longer be buyable under the
guidelines.
***Last / Change / Volume data in this table is the closing quote data***
Symbol/Exchange
Company Name
Industry Group |
PRICE |
CHANGE
(%Change) |
Day High |
Volume
(% DAV)
(% 50 day avg vol) |
52 Wk Hi
% From Hi |
Featured
Date |
Price
Featured |
Pivot Featured |
|
Max Buy |
 CRL
-
NYSE
CRL
-
NYSE
Charles River Labs Intl
DRUGS - Biotechnology
|
$237.45
|
+4.63
1.99% |
$238.42
|
252,173
76.19% of 50 DAV
50 DAV is 331,000
|
$250.29
-5.13%
|
7/15/2020
|
$192.66
|
PP = $189.95
|
|
MB = $199.45
|
Most Recent Note - 11/2/2020 5:35:45 PM
G - Found prompt support near its 50 DMA line ($224.91) and posted volume-driven gains. Reported Sep '20 quarterly earnings +38% on +11% sales revenues versus the year ago period, above the +25% minimum earnings guideline (C criteria). Volume and volatility often increase near earnings news.
>>> FEATURED STOCK ARTICLE : Earnings Due; Consolidating Near Prior High and Above 50 DMA Line - 10/27/2020 |
View all notes |
Set NEW NOTE alert |
Company Profile |
SEC
News |
Chart |
Request a new note
C
A
S
I |
AMD
-
NASDAQ
Advanced Micro Devices
ELECTRONICS - Semiconductor - Broad Line
|
$76.58
|
+1.88
2.52% |
$77.08
|
41,092,685
75.99% of 50 DAV
50 DAV is 54,073,000
|
$94.28
-18.77%
|
8/31/2020
|
$90.42
|
PP = $87.39
|
|
MB = $91.76
|
 Most Recent Note - 11/3/2020 6:04:24 PM
G - Posted a gain today with light volume. Losses with heavy volume raised concerns while slumping toward the prior low ($73.85 on 9/18/20) . Weak action came after it reported earnings +128% on +56% sales revenues for the Sep '20 quarter versus the year ago period and announced plans to acquire Xilinx Inc (XLNX). More deterioration would raise greater concerns and trigger a more worrisome technical sell signal. Faces near-term resistance due to overhead supply up to the $94 level. See the latest FSU analysis for more details and a new annotated graph.
>>> FEATURED STOCK ARTICLE : Weak Action Raised Concern While Testing Recent Low - 11/3/2020 |
View all notes |
Set NEW NOTE alert |
Company Profile |
SEC
News |
Chart |
Request a new note
C
A
S
I |
TER
-
NASDAQ
Teradyne Inc
ELECTRONICS - Semiconductor Equipment and Mate
|
$89.83
|
+0.13
0.14% |
$91.71
|
1,081,805
45.98% of 50 DAV
50 DAV is 2,353,000
|
$93.44
-3.86%
|
10/21/2020
|
$92.22
|
PP = $93.54
|
|
MB = $98.22
|
Most Recent Note - 11/3/2020 6:06:11 PM
Y - Remains quietly perched within close striking distance of its all-time high. A subsequent gain above the pivot point backed by at least +40% above average volume may trigger a technical buy signal. Reported earnings +53% on +41% sales revenues for the Sep '20 quarter versus the year ago period, its 4th consecutive quarterly comparison with earnings above the +25% minimum earnings guideline (C criteria). Sequential comparisons show encouraging acceleration in its sales revenues growth rate. Its annual earnings (A criteria) history has been strong.
>>> FEATURED STOCK ARTICLE : Challenging All-Time High With Volume-Drive Gain - 10/21/2020 |
View all notes |
Set NEW NOTE alert |
Company Profile |
SEC
News |
Chart |
Request a new note
C
A
S
I |
TREX
-
NYSE
Trex Company Inc
MATERIALS and CONSTRUCTION - General Building Materials
|
$70.90
|
-0.84
-1.17% |
$74.55
|
1,333,005
170.03% of 50 DAV
50 DAV is 784,000
|
$81.23
-12.72%
|
6/26/2020
|
$54.53
|
PP = $66.47
|
|
MB = $69.79
|
Most Recent Note - 11/3/2020 6:09:14 PM
G - Erased an early gain today and slumped to close again below its 50 DMA line ($72.83) with a volume-driven loss. Prior low ($63.32 on 9/21/20) defines the next near-term support. Reported Sep '20 quarterly earnings +14% on +19% sales revenues versus the year ago period, below the +25% minimum guideline (C criteria) raising fundamental concerns. Volume and volatility often increase near earnings news.
>>> FEATURED STOCK ARTICLE : Recently Wedged Into New High Territory - 10/16/2020 |
View all notes |
Set NEW NOTE alert |
Company Profile |
SEC
News |
Chart |
Request a new note
C
A
S
I |
LGIH
-
NASDAQ
L G I Homes Inc
Bldg-Resident/Comml
|
$114.79
|
+2.84
2.54% |
$119.10
|
489,736
190.56% of 50 DAV
50 DAV is 257,000
|
$132.98
-13.68%
|
10/1/2020
|
$123.17
|
PP = $124.04
|
|
MB = $130.24
|
Most Recent Note - 11/3/2020 12:57:26 PM
G - Reported Sep '20 quarterly earnings +27% on +11% sales revenues versus the year ago period. Posting a 2nd consecutive gain today with higher volume but meeting resistance, meanwhile, a rebound and close back above the 50 DMA line ($116.25) is needed for its outlook to improve. Members were cautioned with recent notes - "Recent gains above the new pivot point lacked the +40% above average volume needed to clinch a proper new (or add-on) technical buy signal."
>>> FEATURED STOCK ARTICLE : Hovering Near High But Recent Gains Lacked Great Volume - 10/19/2020 |
View all notes |
Set NEW NOTE alert |
Company Profile |
SEC
News |
Chart |
Request a new note
C
A
S
I |
Symbol/Exchange
Company Name
Industry Group |
PRICE |
CHANGE
(%Change) |
Day High |
Volume
(% DAV)
(% 50 day avg vol) |
52 Wk Hi
% From Hi |
Featured
Date |
Price
Featured |
Pivot Featured |
|
Max Buy |
NOW
-
NYSE
Servicenow Inc
Computer Sftwr-Enterprse
|
$480.05
|
+4.05
0.85% |
$484.71
|
1,782,149
134.30% of 50 DAV
50 DAV is 1,327,000
|
$533.37
-10.00%
|
8/20/2020
|
$453.34
|
PP = $454.79
|
|
MB = $477.53
|
Most Recent Note - 11/2/2020 5:40:28 PM
G - Violated its 50 DMA line ($485) with today's volume-driven loss triggering a technical sell signal. Only a prompt rebound above the 50 DMA line would help its outlook improve. Prior low ($432.85 on 9/08/20) defines the next important support where any violation would raise greater concerns. Recently reported Sep '20 quarterly earnings +22% on +30% sales revenues versus the year ago period, below the +25% minimum guideline (C criteria) of the fact-based investment system.
>>> FEATURED STOCK ARTICLE : Found Prompt Support at 50 DMA Line After Earnings News - 10/29/2020 |
View all notes |
Set NEW NOTE alert |
Company Profile |
SEC
News |
Chart |
Request a new note
C
A
S
I |
VEEV
-
NYSE
Veeva Systems Inc Cl A
Computer Sftwr-Medical
|
$270.94
|
+2.90
1.08% |
$276.22
|
799,828
95.44% of 50 DAV
50 DAV is 838,000
|
$313.99
-13.71%
|
10/6/2020
|
$287.71
|
PP = $298.86
|
|
MB = $313.80
|
Most Recent Note - 11/3/2020 6:10:51 PM
G - Posted a quiet gain today after damaging volume-driven losses violated its 50 DMA line ($281) and triggered a technical sell signal. Fundamentals remain strong.
>>> FEATURED STOCK ARTICLE : Recently Slumped Back Below Prior Highs - 10/26/2020 |
View all notes |
Set NEW NOTE alert |
Company Profile |
SEC
News |
Chart |
Request a new note
C
A
S
I |
TEAM
-
NASDAQ
Atlassian Corp Plc Cl A
Comp Sftwr-Spec Enterprs
|
$182.06
|
-2.23
-1.21% |
$185.81
|
2,062,686
120.13% of 50 DAV
50 DAV is 1,717,000
|
$216.30
-15.83%
|
10/12/2020
|
$193.77
|
PP = $199.60
|
|
MB = $209.58
|
Most Recent Note - 11/2/2020 5:33:58 PM
G - Weak action negated the prior breakout and violated its 50 DMA line ($187.43) triggering a technical sell signal. Reported earnings +7% on +26% sales revenues for the Sep '20 quarter versus the year ago period, well below the +25% minimum earnings guideline (C criteria), raising concerns. See the latest FSU analysis for more details and a new annotated graph.
>>> FEATURED STOCK ARTICLE : Weak Technical Action Followed Disappointing Fundamental News - 11/2/2020 |
View all notes |
Set NEW NOTE alert |
Company Profile |
SEC
News |
Chart |
Request a new note
C
A
S
I |
|
|
|
THESE ARE NOT BUY RECOMMENDATIONS!
Comments contained in the body of this report are technical
opinions only. The material herein has been obtained
from sources believed to be reliable and accurate, however,
its accuracy and completeness cannot be guaranteed.
This site is not an investment advisor, hence it does
not endorse or recommend any securities or other investments.
Any recommendation contained in this report may not
be suitable for all investors and it is not to be deemed
an offer or solicitation on our part with respect to
the purchase or sale of any securities. All trademarks,
service marks and trade names appearing in this report
are the property of their respective owners, and are
likewise used for identification purposes only.
This report is a service available
only to active Paid Premium Members.
You may opt-out of receiving report notifications
at any time. Questions or comments may be submitted
by writing to Premium Membership Services 665 S.E. 10 Street, Suite 201 Deerfield Beach, FL 33441-5634 or by calling 1-800-965-8307
or 954-785-1121.
|
|
|