You are not logged in.
This means you
CAN ONLY VIEW reports that were published prior to Tuesday, February 20, 2024.
You
MUST UPGRADE YOUR MEMBERSHIP if you want to see any current reports.
AFTER MARKET UPDATE - FRIDAY, NOVEMBER 2ND, 2018
Previous After Market Report Next After Market Report >>>
|
|
|
|
DOW |
-109.91 |
25,270.83 |
-0.43% |
|
Volume |
988,911,170 |
-4% |
|
Volume |
2,880,548,200 |
+8% |
|
NASDAQ |
-77.07 |
7,356.99 |
-1.04% |
|
Advancers |
1,285 |
43% |
|
Advancers |
1,573 |
52% |
|
S&P 500 |
-17.31 |
2,723.06 |
-0.63% |
|
Decliners |
1,704 |
57% |
|
Decliners |
1,478 |
48% |
|
Russell 2000 |
+3.00 |
1,547.98 |
+0.19% |
|
52 Wk Highs |
27 |
|
|
52 Wk Highs |
44 |
|
|
S&P 600 |
+4.55 |
973.43 |
+0.47% |
|
52 Wk Lows |
85 |
|
|
52 Wk Lows |
77 |
|
|
 |
Major Indices Fell on Day 4 of New Rally Attempt
Kenneth J. Gruneisen - Passed the CAN SLIM® Master's Exam
For the week, the Dow gained 2.4%, while the Nasdaq Composite advanced 2.7% to end a four-week losing streak. The S&P 500 climbed 2.4%, notching its best week in six months. Stocks finished lower Friday. The Dow fell 109 points to 25270, while the S&P 500 lost 17 points to 2723. The Nasdaq Composite dropped 77 points to 7357.The volume totals reported were mixed, lighter on the NYSE and higher on the Nasdaq exchange versus the prior session. Decliners led advancers by almost a 3-2 margin on the NYSE, meanwhile advancers narrowly outnumbered decliners on the Nasdaq exchange. There were 15 high-ranked companies from the Leaders List that made new 52-week highs and were listed on the BreakOuts Page, versus 12 on the prior session, as market leadership improved. New 52-week lows totals still outnumbered new 52-week highs on the NYSE and Nasdaq exchange. Recent reports have noted that the major indices (M criteria) have shown action indicative of a market correction. The Featured Stocks Page provides the most timely analysis on high-ranked leaders. Charts used courtesy of www.stockcharts.com
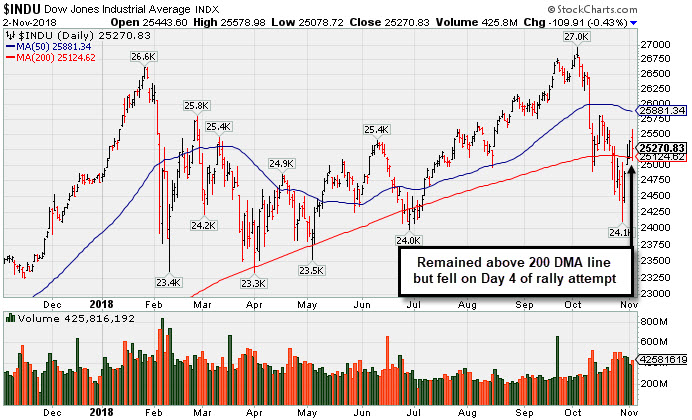
PICTURED: The Dow Jones Industrial Average and other major indices fell on Friday, marking Day 4 of a new rally attempt. Technically, the market remains in a "correction" under the fact-based investment system. Members have been reminded repeatedly that new buying efforts are against the rules until a convincing follow-through day occurs. Between Day 4 and Day 7 investors should watch for a "follow-through day" of solid gains (at least +1%) from one or more of the major indices, backed by higher volume, and coupled with a leadership expansion (increase in new 52-week highs). All of the above are necessary elements required to confirm a new rally. Until then, patience and discipline are paramount.
The major averages gave back early session gains as weakness in the Tech sector offset positive economic updates. On the data front, non-farm payrolls increased 250,000 in October, well above projections of 200,000. The unemployment rate remained at 3.7%, the lowest in 48 years. Meanwhile, average hourly earnings advanced 3.1% year-over-year in October, the highest reading since 2009. The robust wage growth has triggered renewed weakness in Treasuries with the yield on the benchmark 10-year note spiking eight basis points to 3.22%.
Nine of 11 S&P 500 sectors closed in negative territory with Technology shares falling 1.9%. Apple (AAPL - 6.63%) experienced its worst session since January 2014, retreating after offering weak forward guidance. In other earnings, Kraft Heinz (KHC -9.70%) fell following a disappointing quarterly report. Elsewhere, Starbucks (SBUX +9.70%) rallied to a new all-time high after the coffee chain topped earnings estimates and revealed strong same-store sales growth.
In commodities, WTI crude was down 1.3% to $62.88/barrel, sliding 6.8% on the week. COMEX gold edged 0.3% lower to $1234.40. |
 Kenneth J. Gruneisen started out as a licensed stockbroker in August 1987, a couple of months prior to the historic stock market crash that took the Dow Jones Industrial Average down -22.6% in a single day. He has published daily fact-based fundamental and technical analysis on high-ranked stocks online for two decades. Through FACTBASEDINVESTING.COM, Kenneth provides educational articles, news, market commentary, and other information regarding proven investment systems that work in good times and bad.
Comments contained in the body of this report are technical opinions only and are not necessarily those of Gruneisen Growth Corp. The material herein has been obtained from sources believed to be reliable and accurate, however, its accuracy and completeness cannot be guaranteed. Our firm, employees, and customers may effect transactions, including transactions contrary to any recommendation herein, or have positions in the securities mentioned herein or options with respect thereto. Any recommendation contained in this report may not be suitable for all investors and it is not to be deemed an offer or solicitation on our part with respect to the purchase or sale of any securities. |
|
 |
Retail, Networking, and Biotech Indexes Rose
Kenneth J. Gruneisen - Passed the CAN SLIM® Master's Exam
The Retail Index ($RLX +0.02%) and the Bank Index ($BKX -0.05%) both finished flat while the Broker/Dealer Index ($XBD +0.97%) rose on Friday. The tech sector was mixed as the Biotech Index ($BTK +0.65%) and the Networking Index ($NWX +0.49%) posted modest gains but the Semiconductor Index ($SOX -1.50%) fell. The Gold & Silver Index ($XAU +0.00%) was unchanged while the Integrated Oil Index ($XOI -1.28%) and the Oil Services Index ($OSX -0.41%) lost ground.
Charts courtesy of www.stockcharts.com
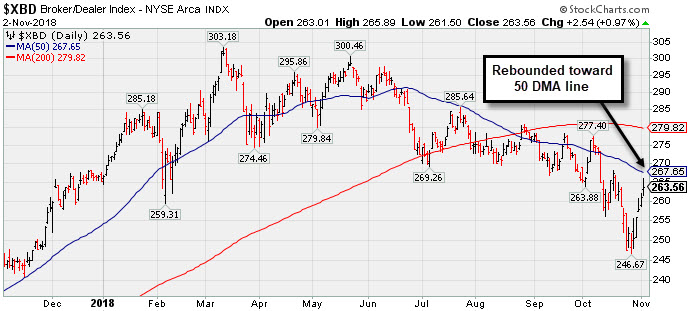 PICTURED: The Broker/Dealer Index ($XBD +0.97%) rebounded toward its 50-day moving average (DMA) line.
| Oil Services |
$OSX |
120.20 |
-0.49 |
-0.41% |
-19.63% |
| Integrated Oil |
$XOI |
1,349.67 |
-17.51 |
-1.28% |
+1.06% |
| Semiconductor |
$SOX |
1,239.16 |
-18.92 |
-1.50% |
-1.11% |
| Networking |
$NWX |
528.84 |
+2.57 |
+0.49% |
+7.81% |
| Broker/Dealer |
$XBD |
263.56 |
+2.54 |
+0.97% |
-0.63% |
| Retail |
$RLX |
2,148.53 |
+0.50 |
+0.02% |
+23.92% |
| Gold & Silver |
$XAU |
67.19 |
+0.00 |
+0.00% |
-21.20% |
| Bank |
$BKX |
99.37 |
-0.05 |
-0.05% |
-6.88% |
| Biotech |
$BTK |
4,801.97 |
+30.87 |
+0.65% |
+13.73% |
|
|
|
 |
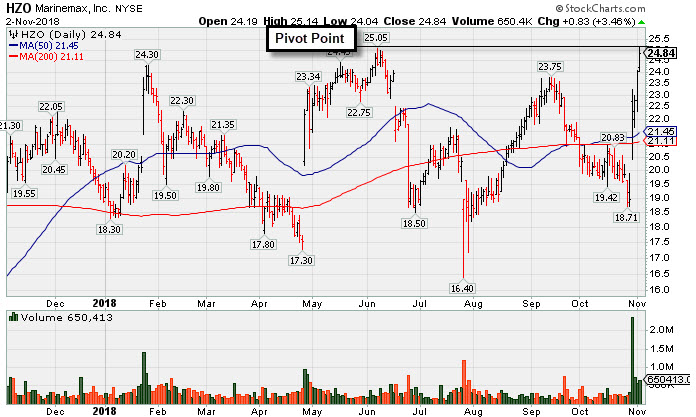
Boat Retailer Has Strong Earnings History
Kenneth J. Gruneisen - Passed the CAN SLIM® Master's Exam
Marinemax Inc (HZO +$0.83 or +3.46% to $24.84) was highlighted in yellow with pivot point cited based on its 6/07/18 high plus 10 cents in the earlier mid-day report (read here). It rebounded above its 50-day moving average (DMA) line with a streak of volume-driven gains this week. Subsequent gains and a strong close above the pivot point backed by at least +40% above average volume may trigger a technical buy signal.
Recently it reported Sep '18 earnings +105% on +23% sales revenues, its 4th consecutive quarter with a big earnings increase more than the +25% minimum (C criteria) versus the year ago period. Sales revenues growth has shown encouraging acceleration in sequential quarterly comparisons versus the year ago periods. Its annual earnings (A criteria) history has been strong and steady.
The number of top-rated funds owning its shares rose from 250 in Dec '17 to 279 in Sep '18, a reassuring sign concerning the I criteria. The current Up/Down Volume Ratio of 1.4 is an unbiased indication its shares have been under accumulation over the past 50 days. Its Timeliness Rating is A and Sponsorship Rating is B.
|
|
|
Color Codes Explained :
Y - Better candidates highlighted by our
staff of experts.
G - Previously featured
in past reports as yellow but may no longer be buyable under the
guidelines.
***Last / Change / Volume data in this table is the closing quote data***
Symbol/Exchange
Company Name
Industry Group |
PRICE |
CHANGE
(%Change) |
Day High |
Volume
(% DAV)
(% 50 day avg vol) |
52 Wk Hi
% From Hi |
Featured
Date |
Price
Featured |
Pivot Featured |
|
Max Buy |
MPX
-
NYSE
Marine Products Corp
AUTOMOTIVE - Recreational Vehicles
|
$21.36
|
+0.69
3.34% |
$21.37
|
40,108
100.27% of 50 DAV
50 DAV is 40,000
|
$24.82
-13.94%
|
10/24/2018
|
$23.00
|
PP = $24.92
|
|
MB = $26.17
|
 Most Recent Note - 11/2/2018 5:57:22 PM
G - Still sputtering below its 50 DMA line ($21.67). A rebound above the 50 DMA line is needed for its outlook to improve.
>>> FEATURED STOCK ARTICLE : Weak Finish Amid Widely Negative Market Environment - 10/24/2018 |
View all notes |
Set NEW NOTE alert |
Company Profile |
SEC
News |
Chart |
Request a new note
C
A
S
I |
GMED
-
NYSE
Globus Medical Inc Cl A
CHEMICALS - Specialty Chemicals
|
$54.67
|
+0.55
1.02% |
$55.46
|
463,022
69.73% of 50 DAV
50 DAV is 664,000
|
$57.55
-5.00%
|
9/26/2018
|
$56.11
|
PP = $57.65
|
|
MB = $60.53
|
Most Recent Note - 11/1/2018 10:19:33 AM
G - Consolidating near its 50 DMA line ($52.98). Subsequent gains above the pivot point backed by more than +40% above average volume are needed to trigger a proper technical buy signal.
>>> FEATURED STOCK ARTICLE : Consolidating After Rally at 200-Day Moving Average Line - 10/22/2018 |
View all notes |
Set NEW NOTE alert |
Company Profile |
SEC
News |
Chart |
Request a new note
C
A
S
I |
ZBRA
-
NASDAQ
Zebra Tech Corp Cl A
COMPUTER HARDWARE - Computer Peripherals
|
$168.06
|
-0.94
-0.56% |
$171.56
|
432,434
111.45% of 50 DAV
50 DAV is 388,000
|
$179.47
-6.36%
|
8/7/2018
|
$164.26
|
PP = $161.82
|
|
MB = $169.91
|
Most Recent Note - 10/30/2018 5:12:03 PM
G - Rebounded toward its 50 DMA line ($168). Overhead supply remains up to the $179 level. Found support in recent weeks after a pullback near its 200 DMA line.
>>> FEATURED STOCK ARTICLE : Zebra Tech Sputtering Near 50-Day Moving Average - 10/23/2018 |
View all notes |
Set NEW NOTE alert |
Company Profile |
SEC
News |
Chart |
Request a new note
C
A
S
I |
CME
-
NASDAQ
C M E Group Inc
DIVERSIFIED SERVICES - Business/Management Services
|
$183.86
|
+0.11
0.06% |
$186.66
|
1,759,388
110.51% of 50 DAV
50 DAV is 1,592,000
|
$186.59
-1.46%
|
10/4/2018
|
$179.29
|
PP = $177.45
|
|
MB = $186.32
|
Most Recent Note - 11/1/2018 5:07:27 PM
Y - Touched another new all-time high with today's 5th consecutive small gain. Found support above its 50 DMA line ($175) after recently reporting earnings +22% on +2% sales revenues for the Sep '18 quarter, below the +25% minimum earnings guideline (C criteria), raising fundamental concerns. Broad market weakness (M criteria) is also a serious concern. The 50 DMA line and prior low ($170.04 on 9/28/18) define important near-term support.
>>> FEATURED STOCK ARTICLE : Perched Near High After Latest Earnings Report Below +25% Minimum - 10/26/2018 |
View all notes |
Set NEW NOTE alert |
Company Profile |
SEC
News |
Chart |
Request a new note
C
A
S
I |
HZO
-
NYSE
Marinemax Inc
SPECIALTY RETAIL - Specialty Retail, Other
|
$24.84
|
+0.83
3.46% |
$25.14
|
650,619
229.09% of 50 DAV
50 DAV is 284,000
|
$25.05
-0.84%
|
11/2/2018
|
$25.10
|
PP = $25.15
|
|
MB = $26.41
|
Most Recent Note - 11/2/2018 12:36:07 PM
Y - Color code is changed to yellow with pivot point cited based on its 6/07/18 high plus 10 cents. Rebounded above its 50 DMA line with a streak of volume-driven gains this week. A gain and strong close above the pivot point backed by at least +40% above average volume may trigger a technical buy signal. Reported Sep '18 earnings +105% on +23% sales revenues, its 4th consecutive quarter with a big earnings increase versus the year ago period. Sales revenues growth has shown encouraging acceleration in sequential quarterly comparisons versus the year ago periods.
>>> FEATURED STOCK ARTICLE : Boat Retailer Has Strong Earnings History - 11/2/2018 |
View all notes |
Set NEW NOTE alert |
Company Profile |
SEC
News |
Chart |
Request a new note
C
A
S
I |
Symbol/Exchange
Company Name
Industry Group |
PRICE |
CHANGE
(%Change) |
Day High |
Volume
(% DAV)
(% 50 day avg vol) |
52 Wk Hi
% From Hi |
Featured
Date |
Price
Featured |
Pivot Featured |
|
Max Buy |
DPZ
-
NYSE
Dominos Pizza Inc
Retail-Restaurants
|
$265.30
|
-0.75
-0.28% |
$272.08
|
537,767
92.88% of 50 DAV
50 DAV is 579,000
|
$305.34
-13.11%
|
8/13/2018
|
$288.60
|
PP = $293.91
|
|
MB = $308.61
|
Most Recent Note - 10/31/2018 5:21:22 PM
G - Posted a 2nd consecutive gain after finding support at its 200 DMA line. A subsequent rebound above the 50 DMA line is needed for its outlook to improve. The prior low ($253.63 on 7/31/18) and 200 DMA line define important near-term support to watch. Reported earnings +54% on +22% sales revenues for the Sep '18 quarter, continuing its strong earnings track record. See the latest FSU analysis for more details and a new annotated graph.
>>> FEATURED STOCK ARTICLE : Found Support at 200-Day Moving Average Line - 10/31/2018 |
View all notes |
Set NEW NOTE alert |
Company Profile |
SEC
News |
Chart |
Request a new note
C
A
S
I |
FIVE
-
NASDAQ
Five Below Inc
Retail-DiscountandVariety
|
$120.97
|
+0.66
0.55% |
$123.98
|
956,006
97.75% of 50 DAV
50 DAV is 978,000
|
$136.13
-11.14%
|
7/6/2018
|
$98.90
|
PP = $104.09
|
|
MB = $109.29
|
Most Recent Note - 11/1/2018 10:17:14 AM
G - Halted its slide near the prior high ($109.09 on 7/19/18), however a rebound above the 50 DMA line ($120) still is needed for its outlook to improve. More damaging losses would raise greater concerns.
>>> FEATURED STOCK ARTICLE : Sputtering Below 50-Day Moving Average Near Prior High - 10/25/2018 |
View all notes |
Set NEW NOTE alert |
Company Profile |
SEC
News |
Chart |
Request a new note
C
A
S
I |
HQY
-
NASDAQ
Healthequity Inc
COMPUTER SOFTWARE and SERVICES - Healthcare Information Service
|
$94.01
|
-0.73
-0.77% |
$96.75
|
1,062,772
121.32% of 50 DAV
50 DAV is 876,000
|
$99.99
-5.98%
|
11/2/2018
|
$95.56
|
PP = $100.09
|
|
MB = $105.09
|
Most Recent Note - 11/2/2018 12:32:39 PM
Y - Color code is changed to yellow with new pivot point cited based on its 9/14/18 high plus 10 cents. Rebound above the 50 DMA line helped its outlook improve this week. Subsequent gains above the pivot point backed by at least +40% above average volume may trigger a new (or add on) technical buy signal. See the latest FSU analysis for more details and an annotated graph.
>>> FEATURED STOCK ARTICLE : Rebound Above 50-Day Average Helped Outlook Improve - 11/1/2018 |
View all notes |
Set NEW NOTE alert |
Company Profile |
SEC
News |
Chart |
Request a new note
C
A
S
I |
OLLI
-
NASDAQ
Ollie's Bargain Outlet
Retail-DiscountandVariety
|
$92.73
|
+0.54
0.59% |
$95.00
|
612,625
91.71% of 50 DAV
50 DAV is 668,000
|
$97.61
-5.00%
|
7/12/2018
|
$74.43
|
PP = $77.60
|
|
MB = $81.48
|
Most Recent Note - 10/30/2018 5:14:09 PM
G - Found support near the 50 DMA line ($89.28). The recent low ($84.66 on 10/11/18) defines the next important support to watch. Fundamentals remain strong. See the latest FSU analysis for more details and a new annotated graph.
>>> FEATURED STOCK ARTICLE : Finding Support Near its 50-Day Moving Average - 10/30/2018 |
View all notes |
Set NEW NOTE alert |
Company Profile |
SEC
News |
Chart |
Request a new note
C
A
S
I |
|
|
|
THESE ARE NOT BUY RECOMMENDATIONS!
Comments contained in the body of this report are technical
opinions only. The material herein has been obtained
from sources believed to be reliable and accurate, however,
its accuracy and completeness cannot be guaranteed.
This site is not an investment advisor, hence it does
not endorse or recommend any securities or other investments.
Any recommendation contained in this report may not
be suitable for all investors and it is not to be deemed
an offer or solicitation on our part with respect to
the purchase or sale of any securities. All trademarks,
service marks and trade names appearing in this report
are the property of their respective owners, and are
likewise used for identification purposes only.
This report is a service available
only to active Paid Premium Members.
You may opt-out of receiving report notifications
at any time. Questions or comments may be submitted
by writing to Premium Membership Services 665 S.E. 10 Street, Suite 201 Deerfield Beach, FL 33441-5634 or by calling 1-800-965-8307
or 954-785-1121.
|
|
|