You are not logged in.
This means you
CAN ONLY VIEW reports that were published prior to Sunday, February 25, 2024.
You
MUST UPGRADE YOUR MEMBERSHIP if you want to see any current reports.
AFTER MARKET UPDATE - THURSDAY, OCTOBER 31ST, 2019
Previous After Market Report Next After Market Report >>>
|
|
|
|
DOW |
-140.46 |
27,046.23 |
-0.52% |
|
Volume |
1,156,785,580 |
+38% |
|
Volume |
2,248,020,260 |
+19% |
|
NASDAQ |
-11.62 |
8,292.36 |
-0.14% |
|
Advancers |
1,086 |
38% |
|
Advancers |
1,152 |
37% |
|
S&P 500 |
-9.21 |
3,037.56 |
-0.30% |
|
Decliners |
1,765 |
62% |
|
Decliners |
1,948 |
63% |
|
Russell 2000 |
-10.40 |
1,562.45 |
-0.66% |
|
52 Wk Highs |
165 |
|
|
52 Wk Highs |
109 |
|
|
S&P 600 |
-10.56 |
965.35 |
-1.08% |
|
52 Wk Lows |
68 |
|
|
52 Wk Lows |
84 |
|
|
 |
Breadth Negative as Major Indices Retreat
Kenneth J. Gruneisen - Passed the CAN SLIM® Master's Exam
The Dow slid 140 points, capping its monthly gain to 0.5%. The S&P 500 lost 0.3%, but ended October 2% higher. The Nasdaq Composite fell 0.1%, but advanced 3.7% for the month. Volume totals reported were much higher than the prior session totals on the Nasdaq exchange and the NYSE. Decliners led advancers by a 9-5 margin on the NYSE and on the Nasdaq exchange. There were 53 high-ranked companies from the Leaders List that hit a new 52-week high and were listed on the BreakOuts Page, versus the total of 47 on the prior session. New 52-week highs outnumbered new 52-week lows on the NYSE and on the Nasdaq exchange. The major indices (M criteria) are in a "confirmed uptrend" after enduring distributional pressure in recent weeks. The Featured Stocks Page provides the most timely analysis on high-ranked leaders. Charts used courtesy of www.stockcharts.com
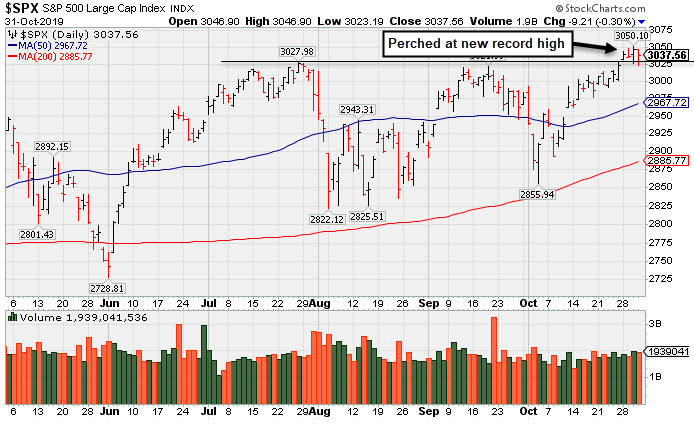
PICTURED: The S&P 500 Index is perched near its new record high.
U.S. stocks finished lower on Thursday, as fading trade optimism and disappointing data updates offset solid corporate earnings reports. A report indicated Chinese officials are skeptical that Washington and Beijing could reach a long-term trade deal. However, President Trump attempted to alleviate concerns by signaling that the “Phase One” trade deal will be signed next month. On the data front, the Fed’s preferred proxy for inflation, the PCE Core deflator, showed a 1.7% gain year-over-year, below last month’s figure of 1.8%, and matching the slowest pace since 2016. Another release revealed business activity in the Chicago region remained in contractionary territory in October, with the gauge falling to the lowest level since 2015. Treasuries extended gains, with the yield on the benchmark 10-year note down nine basis points to 1.68%. In commodities, WTI crude fell 1.6% to $54.18/barrel, but posted its first monthly gain since July.
Nine of 11 S&P 500 sectors finished in negative territory. The Industrials sector, which has widely been viewed as a proxy of the trade dispute, lead the laggards. In earnings, Apple (AAPL +2.28%) after the iPhone maker beat analysts’ earnings per share estimates citing wearables and payment services as key drivers. Facebook (FB +1.81%) rose after the social media company beat profit estimates and Wall Street’s revenue per user forecasts. Kraft Heinz (KHC +13.44%) after beating profit estimates and organic growth declining less than expected.
|
 Kenneth J. Gruneisen started out as a licensed stockbroker in August 1987, a couple of months prior to the historic stock market crash that took the Dow Jones Industrial Average down -22.6% in a single day. He has published daily fact-based fundamental and technical analysis on high-ranked stocks online for two decades. Through FACTBASEDINVESTING.COM, Kenneth provides educational articles, news, market commentary, and other information regarding proven investment systems that work in good times and bad.
Comments contained in the body of this report are technical opinions only and are not necessarily those of Gruneisen Growth Corp. The material herein has been obtained from sources believed to be reliable and accurate, however, its accuracy and completeness cannot be guaranteed. Our firm, employees, and customers may effect transactions, including transactions contrary to any recommendation herein, or have positions in the securities mentioned herein or options with respect thereto. Any recommendation contained in this report may not be suitable for all investors and it is not to be deemed an offer or solicitation on our part with respect to the purchase or sale of any securities. |
|
 |
Financial, Retail, Tech, and Energy-Linked Groups Fell
Kenneth J. Gruneisen - Passed the CAN SLIM® Master's Exam
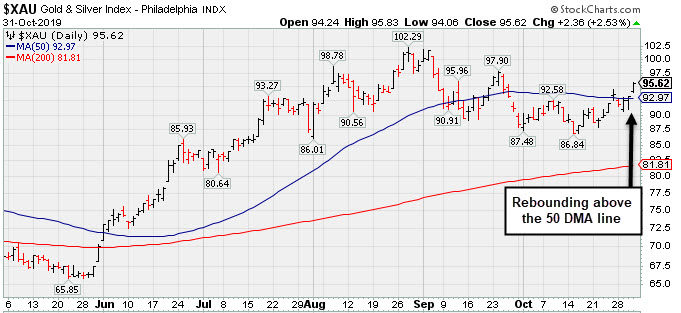
The Bank Index ($BKX -0.97%) and the Broker/Dealer Index ($XBD -0.96%) slumped worse than the Retail Index ($RLX -0.41%). The tech sector also had a slight negative bias as the Semiconductor Index ($SOX -0.62%), Networking Index ($NWX -0.31%), and the Biotech Index ($BTK -0.89%) each ended lower. Commodity-linked groups were mixed as the Oil Services Index ($OSX -1.52%) and the Integrated Oil Index ($XOI -0.63%) both fell while the Gold & Silver Index ($XAU +2.53%) posted a standout gain.
PICTURED: The Gold & Silver Index ($XAU +2.53%) has rebounded above its 50-day moving average (DMA) line.
| Oil Services |
$OSX |
64.80 |
-1.00 |
-1.52% |
-19.60% |
| Integrated Oil |
$XOI |
1,217.86 |
-7.71 |
-0.63% |
+5.07% |
| Semiconductor |
$SOX |
1,651.22 |
-10.24 |
-0.62% |
+42.94% |
| Networking |
$NWX |
553.61 |
-1.72 |
-0.31% |
+13.29% |
| Broker/Dealer |
$XBD |
264.71 |
-2.57 |
-0.96% |
+11.53% |
| Retail |
$RLX |
2,396.22 |
-9.85 |
-0.41% |
+22.79% |
| Gold & Silver |
$XAU |
95.62 |
+2.36 |
+2.53% |
+35.32% |
| Bank |
$BKX |
103.79 |
-1.02 |
-0.97% |
+20.98% |
| Biotech |
$BTK |
4,422.72 |
-39.53 |
-0.89% |
+4.78% |
|
|
|
 |
Noted "Positive Reversal" on Volatile Session After Earnings
Kenneth J. Gruneisen - Passed the CAN SLIM® Master's Exam
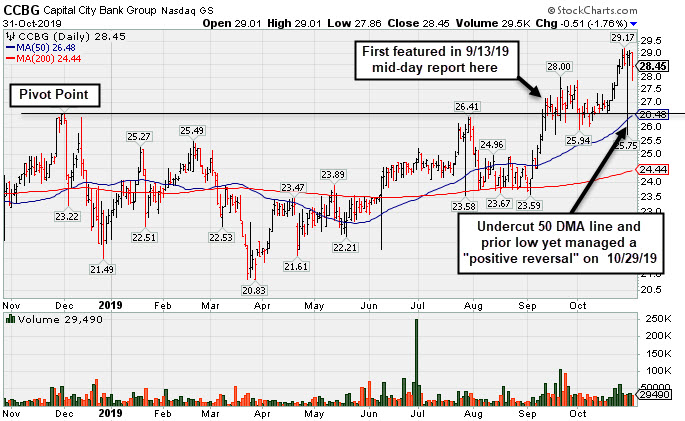
Capital City Bk Gp (CCBG -$0.51 or -1.76% to $28.45) is still hovering near its 52-week high. Prior highs define important support to watch along with its 50-day moving average (DMA) line ($25.45). It managed a "positive reversal" on 10/29/19 following another solid earnings report. CCBG was highlighted in yellow with pivot point cited based on its 12/03/18 high plus 10 cents in the 9/13/19 mid-day report (read here). It hit a new 52-week high on 9/20/19 with a solid gain above the pivot point backed by +339% above average volume triggering a technical buy signal. It was last shown in this FSU section on 10/14/19 with an annotated graph under the headline, "Perched Near High With Earnings News Due Next Week".
Earnings increases in the 4 latest quarterly comparisons through Sep '19 were above the +25% minimum guideline (C criteria) as its sales revenues growth rate was in the 9-13% range versus the year ago periods. It has a Timeliness Rating of A, but a Sponsorship Rating of E.
Its small supply of only 16.7 million shares outstanding (S criteria) can contribute to greater price volatility in the event of institutional buying or selling. The number of top-rated funds owning its shares rose from 159 on Sep '18 to 188 in Sep '19, a reassuring sign concerning the I criteria. Its current Up/Down Volume Ratio of 1.7 is an unbiased indication its shares have been under accumulation over the past 50 days.
|
|
|
Color Codes Explained :
Y - Better candidates highlighted by our
staff of experts.
G - Previously featured
in past reports as yellow but may no longer be buyable under the
guidelines.
***Last / Change / Volume data in this table is the closing quote data***
Symbol/Exchange
Company Name
Industry Group |
PRICE |
CHANGE
(%Change) |
Day High |
Volume
(% DAV)
(% 50 day avg vol) |
52 Wk Hi
% From Hi |
Featured
Date |
Price
Featured |
Pivot Featured |
|
Max Buy |
 MLR
-
NYSE
MLR
-
NYSE
Miller Industries Inc
AUTOMOTIVE - Auto Parts
|
$35.95
|
-0.09
-0.25% |
$36.29
|
47,810
136.60% of 50 DAV
50 DAV is 35,000
|
$36.34
-1.07%
|
9/24/2019
|
$34.00
|
PP = $35.36
|
|
MB = $37.13
|
Most Recent Note - 10/30/2019 12:37:41 PM
Y - Hitting another new high with today's 4th consecutive gain backed by ever-increasing volume. Prior reports repeatedly noted - "Subsequent gains and a close above the pivot point backed by at least +40% above average volume may trigger a convincing technical buy signal. Fundamentals remain strong."
>>> FEATURED STOCK ARTICLE : Hit New High But Did Not Close Session Above Pivot Point - 10/29/2019 |
View all notes |
Set NEW NOTE alert |
Company Profile |
SEC
News |
Chart |
Request a new note
C
A
S
I |
CCBG
-
NASDAQ
Capital City Bk Gp
BANKING - Regional - Mid-Atlantic Banks
|
$28.45
|
-0.51
-1.76% |
$29.01
|
29,490
98.30% of 50 DAV
50 DAV is 30,000
|
$29.17
-2.47%
|
9/13/2019
|
$27.03
|
PP = $27.05
|
|
MB = $28.40
|
 Most Recent Note - 10/31/2019 6:34:45 PM
G - Hovering near its 52-week high. Managed a "positive reversal" on 10/29/19 following another strong earnings report. Prior highs define important support to watch along with its 50 DMA line ($26.50). See the latest FSU analysis for more details and a new annotated graph.
>>> FEATURED STOCK ARTICLE : Noted "Positive Reversal" on Volatile Session After Earnings - 10/31/2019 |
View all notes |
Set NEW NOTE alert |
Company Profile |
SEC
News |
Chart |
Request a new note
C
A
S
I |
AUDC
-
NASDAQ
Audiocodes Ltd
ELECTRONICS - Scientific and Technical Instrum
|
$21.14
|
-0.82
-3.73% |
$21.73
|
370,498
166.14% of 50 DAV
50 DAV is 223,000
|
$22.50
-6.04%
|
9/13/2019
|
$19.68
|
PP = $19.84
|
|
MB = $20.83
|
Most Recent Note - 10/31/2019 6:41:39 PM
Y - Pulled back today with above average volume breaking a streak of 4 consecutive gains marked by some heavier volume. Reported earnings +26% on +15% sales revenues for the Sep '19 quarter. Rallying above the prior pivot point with this week's volume driven gains. Recent low ($17.54 on 10/08/19) defines the next important support.
>>> FEATURED STOCK ARTICLE : Consolidating Above 50-Day Average But Below Prior Pivot Point - 10/21/2019 |
View all notes |
Set NEW NOTE alert |
Company Profile |
SEC
News |
Chart |
Request a new note
C
A
S
I |
CHDN
-
NASDAQ
Churchill Downs Inc
LEISURE - Gaming Activities
|
$129.99
|
-3.38
-2.53% |
$134.20
|
589,247
229.28% of 50 DAV
50 DAV is 257,000
|
$135.32
-3.94%
|
10/8/2019
|
$129.77
|
PP = $132.83
|
|
MB = $139.47
|
Most Recent Note - 10/31/2019 6:38:58 PM
Y - Retreated from its all-time high with a volume-driven loss today and tested its 50 DMA line ($126) which acted as support in recent months. Reported Sep '19 earnings +4% on +38% sales revenues versus the year ago period, its 2nd consecutive quarterly comparison below the +25% minimum earnings guideline (C criteria), raising greater fundamental concerns. See the latest FSU analysis for more details and an annotated graph.
>>> FEATURED STOCK ARTICLE : Perched at Record High at Time of Quarterly Report - 10/30/2019 |
View all notes |
Set NEW NOTE alert |
Company Profile |
SEC
News |
Chart |
Request a new note
C
A
S
I |
LULU
-
NASDAQ
Lululemon Athletica
MANUFACTURING - Textile Manufacturing
|
$204.27
|
-1.58
-0.77% |
$207.40
|
1,790,906
96.23% of 50 DAV
50 DAV is 1,861,000
|
$209.02
-2.27%
|
9/6/2019
|
$201.25
|
PP = $194.35
|
|
MB = $204.07
|
Most Recent Note - 10/28/2019 12:31:21 PM
G - Holding its ground near its all-time high after wedging higher with gains lacking great volume conviction. Its 50 DMA line ($193.44) and recent low ($185.36 on 10/03/19) define important near-term support.
>>> FEATURED STOCK ARTICLE : LULU Stretches to Hit New Record High - 10/18/2019 |
View all notes |
Set NEW NOTE alert |
Company Profile |
SEC
News |
Chart |
Request a new note
C
A
S
I |
Symbol/Exchange
Company Name
Industry Group |
PRICE |
CHANGE
(%Change) |
Day High |
Volume
(% DAV)
(% 50 day avg vol) |
52 Wk Hi
% From Hi |
Featured
Date |
Price
Featured |
Pivot Featured |
|
Max Buy |
CPRT
-
NASDAQ
Copart Inc
SPECIALTY RETAIL - Auto Dealerships
|
$82.64
|
-1.36
-1.62% |
$84.40
|
1,266,213
84.64% of 50 DAV
50 DAV is 1,496,000
|
$85.31
-3.13%
|
9/5/2019
|
$79.13
|
PP = $79.84
|
|
MB = $83.83
|
Most Recent Note - 10/30/2019 5:45:05 PM
G - Wedged to new all-time highs with recent gains lacking great volume conviction. Its 50 DMA line ($80.34) defines near-term support above the prior low ($76.35 on 10/03/19).
>>> FEATURED STOCK ARTICLE : Reversed Into Red Today After Hitting New All-Time High - 10/22/2019 |
View all notes |
Set NEW NOTE alert |
Company Profile |
SEC
News |
Chart |
Request a new note
C
A
S
I |
BLD
-
NYSE
Topbuild Corp
Bldg-Constr Prds/Misc
|
$103.93
|
+7.41
7.68% |
$106.82
|
932,222
371.40% of 50 DAV
50 DAV is 251,000
|
$102.81
1.09%
|
5/17/2019
|
$82.19
|
PP = $87.31
|
|
MB = $91.68
|
Most Recent Note - 10/31/2019 12:35:40 PM
G - Powering to a new all-time high with today's volume-driven gain. Reported earnings +24% on +5% sales revenues for the Sep '19 quarter versus the year ago period, just below the +25% minimum guideline (C criteria). Found prompt support near its 50 DMA line ($95) during its ongoing ascent and while it recently stayed above its prior low ($91.31 on 10/03/19).
>>> FEATURED STOCK ARTICLE : Pulling Back After Recently Wedging Into New High Territory - 10/23/2019 |
View all notes |
Set NEW NOTE alert |
Company Profile |
SEC
News |
Chart |
Request a new note
C
A
S
I |
|
|
|
THESE ARE NOT BUY RECOMMENDATIONS!
Comments contained in the body of this report are technical
opinions only. The material herein has been obtained
from sources believed to be reliable and accurate, however,
its accuracy and completeness cannot be guaranteed.
This site is not an investment advisor, hence it does
not endorse or recommend any securities or other investments.
Any recommendation contained in this report may not
be suitable for all investors and it is not to be deemed
an offer or solicitation on our part with respect to
the purchase or sale of any securities. All trademarks,
service marks and trade names appearing in this report
are the property of their respective owners, and are
likewise used for identification purposes only.
This report is a service available
only to active Paid Premium Members.
You may opt-out of receiving report notifications
at any time. Questions or comments may be submitted
by writing to Premium Membership Services 665 S.E. 10 Street, Suite 201 Deerfield Beach, FL 33441-5634 or by calling 1-800-965-8307
or 954-785-1121.
|
|
|