You are not logged in.
This means you
CAN ONLY VIEW reports that were published prior to Saturday, February 24, 2024.
You
MUST UPGRADE YOUR MEMBERSHIP if you want to see any current reports.
AFTER MARKET UPDATE - WEDNESDAY, OCTOBER 31ST, 2018
Previous After Market Report Next After Market Report >>>
|
|
|
|
DOW |
+241.12 |
25,115.76 |
+0.97% |
|
Volume |
1,286,692,380 |
+10% |
|
Volume |
2,882,779,300 |
+8% |
|
NASDAQ |
+144.25 |
7,305.90 |
+2.01% |
|
Advancers |
1,806 |
60% |
|
Advancers |
1,908 |
61% |
|
S&P 500 |
+29.11 |
2,711.74 |
+1.09% |
|
Decliners |
1,206 |
40% |
|
Decliners |
1,197 |
39% |
|
Russell 2000 |
+4.78 |
1,511.41 |
+0.32% |
|
52 Wk Highs |
25 |
|
|
52 Wk Highs |
46 |
|
|
S&P 600 |
-0.94 |
949.96 |
-0.10% |
|
52 Wk Lows |
142 |
|
|
52 Wk Lows |
138 |
|
|
 |
Leadership Improved as Major Indices Posted 2nd Consecutive Gains
Kenneth J. Gruneisen - Passed the CAN SLIM® Master's Exam
For the month, the Dow fell 5.1% while S&P 500 lost 6.9%. The Nasdaq declined 9.2%. Stocks finished higher Wednesday. The Dow rose 241 points to 25115, while the S&P 500 gained 29 points to 2711. The Nasdaq Composite added 144 points to 7305. The volume totals reported were higher on the NYSE and near the prior session on the Nasdaq exchange versus the prior session. Advancers led decliners by a 3-2 margin on the NYSE and on the Nasdaq exchange. There were 13 high-ranked companies from the Leaders List that made new 52-week highs and were listed on the BreakOuts Page, versus 9 on the prior session, as market leadership remained thin but improved. New 52-week lows totals easily outnumbered new 52-week highs on the NYSE and Nasdaq exchange. Recent reports have noted that the major indices (M criteria) have shown action indicative of a market correction while leadership disappeared. During market corrections investors should have a bias toward selling stocks on a case-by-case basis as technical sell signals occur, raising cash levels while reducing market exposure. The Featured Stocks Page provides the most timely analysis on high-ranked leaders. Charts used courtesy of www.stockcharts.com
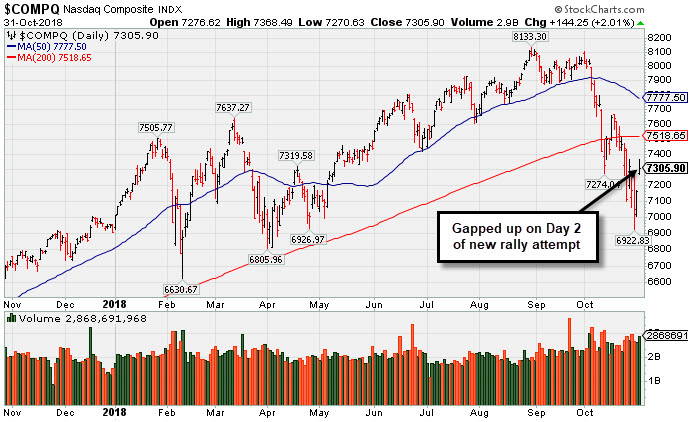
PICTURED: The Nasdaq Composite Index and other major indices rose on Wednesday, marking Day 2 on a new rally attempt. Technically, the market remains in a "correction" under the fact-based investment system. Members have been reminded repeatedly that new buying efforts are against the rules until a convincing follow-through day occurs. A "follow-through day" of solid gains (at least +1%) from one or more of the major indices, backed by higher volume, and coupled with a leadership expansion (increase in new 52-week highs), are all of the necessary elements required to confirm a new rally. Until then, patience and discipline are paramount.
The major averages advanced with the S&P 500 posting its second consecutive daily gain for the first time in October. On the data front, a report showed private payrolls increased 227,000 in October, above the expected 187,000 uptick. Separately, private-sector wages climbed by 3.1% year-over-year in the third quarter, the largest increase in a decade.
Eight of 11 S&P 500 sectors ended higher with Technology stocks pacing gains. The oft-cited “FAANG” group advanced 4.1% for the day, with Facebook (FB +3.81%) after exceeding Wall Street profit estimates. General Motors (GM +9.09%) helped lift the Consumer Discretionary group as the car marker posted a robust quarterly earnings report. Meanwhile, the Consumer Staples sector lagged. Kellogg (K -8.88%) and Clorox (CLX -2.86%) as both companies cited higher input costs and a stronger dollar for lowering their forward guidance.
Treasuries weakened with the yield on the 10-year note up four basis points to 3.15% following the Treasury Department’s announcement to increase long-term debt auctions this quarter. In commodities, WTI crude lost 1.7% to $65.09/barrel. COMEX gold slipped 0.6% to $1,217.70/ounce amid a stronger dollar. |
 Kenneth J. Gruneisen started out as a licensed stockbroker in August 1987, a couple of months prior to the historic stock market crash that took the Dow Jones Industrial Average down -22.6% in a single day. He has published daily fact-based fundamental and technical analysis on high-ranked stocks online for two decades. Through FACTBASEDINVESTING.COM, Kenneth provides educational articles, news, market commentary, and other information regarding proven investment systems that work in good times and bad.
Comments contained in the body of this report are technical opinions only and are not necessarily those of Gruneisen Growth Corp. The material herein has been obtained from sources believed to be reliable and accurate, however, its accuracy and completeness cannot be guaranteed. Our firm, employees, and customers may effect transactions, including transactions contrary to any recommendation herein, or have positions in the securities mentioned herein or options with respect thereto. Any recommendation contained in this report may not be suitable for all investors and it is not to be deemed an offer or solicitation on our part with respect to the purchase or sale of any securities. |
|
 |
Retail, Financial, and Tech Groups Rose
Kenneth J. Gruneisen - Passed the CAN SLIM® Master's Exam
The Bank Index ($BKX +1.50%), Broker/Dealer Index ($XBD +0.88%) and the Retail Index ($RLX +1.86%) ended higher on Wednesday. The tech sector had a positive bias as the Semiconductor Index ($SOX +1.24%), Networking Index ($NWX +1.95%) and Biotech Index ($BTK +0.83%) posted unanimous gains. Commodity-linked groups were mixed as the Integrated Oil Index ($XOI +0.33%) and the Oil Services Index ($OSX +0.19%) both posted small gains but the Gold & Silver Index ($XAU -1.77%) was a standout decliner.
Charts courtesy of www.stockcharts.com
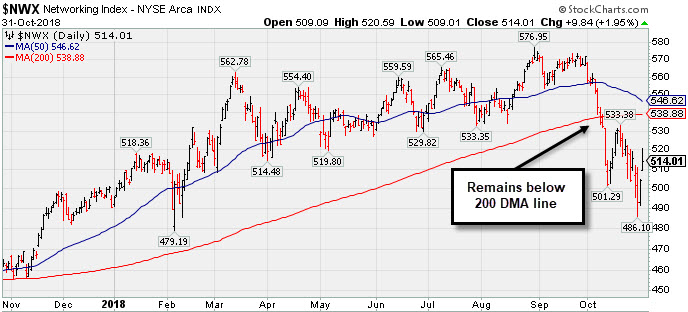 PICTURED: The Networking Index ($NWX +1.95%) recently slumped below its 200-day moving average (DMA) line near the prior 2018 low.
| Oil Services |
$OSX |
119.56 |
+0.22 |
+0.18% |
-20.05% |
| Integrated Oil |
$XOI |
1,359.62 |
+4.47 |
+0.33% |
+1.80% |
| Semiconductor |
$SOX |
1,202.30 |
+14.73 |
+1.24% |
-4.05% |
| Networking |
$NWX |
514.01 |
+9.84 |
+1.95% |
+4.79% |
| Broker/Dealer |
$XBD |
257.95 |
+2.24 |
+0.88% |
-2.75% |
| Retail |
$RLX |
2,091.02 |
+38.13 |
+1.86% |
+20.61% |
| Gold & Silver |
$XAU |
64.28 |
-1.16 |
-1.77% |
-24.62% |
| Bank |
$BKX |
98.89 |
+1.46 |
+1.50% |
-7.33% |
| Biotech |
$BTK |
4,543.18 |
+37.31 |
+0.83% |
+7.60% |
|
|
|
 |
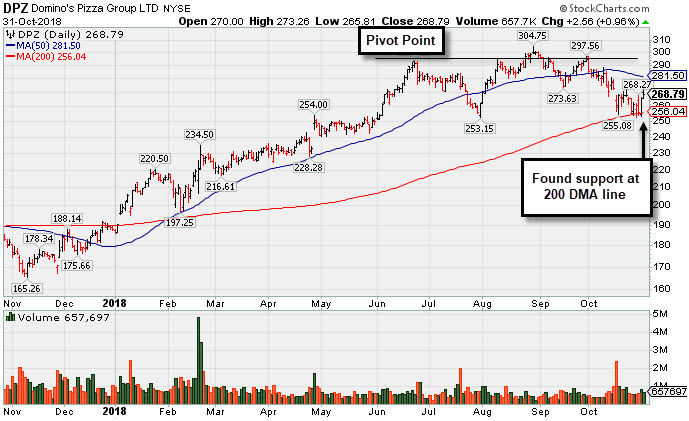
Found Support at 200-Day Moving Average Line
Kenneth J. Gruneisen - Passed the CAN SLIM® Master's Exam
Dominos Pizza Inc (DPZ +$2.56 or +0.96% to $268.79) posted a 2nd consecutive gain on near average volume after finding support at its 200-day moving average (DMA) line ($256.04). A subsequent rebound above the 50 DMA line ($281.50) is needed for its outlook to improve. The prior low ($253.63 on 7/31/18) and 200 DMA line define important near-term support to watch.
The popular pizza firm recently it reported earnings +54% on +22% sales revenues for the Sep '18 quarter, continuing its strong earnings track record. That marked its 9th consecutive quarterly comparison above the +25% minimum earnings guideline (C criteria). Annual earnings (A criteria) growth has been good. The company has a new CEO effective 7/02/18.
It was shown in this FSU section on 10/15/18 with an annotated graph under the headline, "Sank Below 50 DMA Line Ahead of Earnings News". DPZ was highlighted in the 2/20/18 mid-day report with pivot point cited based on its 1/25/18 high plus 10 cents (read here). The number of top-rated funds owning its shares rose from 772 in Mar '17 to 978 in Sep '18 a reassuring sign concerning the I criteria. Its current Up/Down Volume Ratio of 0.9 is an unbiased indication its shares have been under accumulation over the past 50 days. It has a small supply of only 41.6 million shares outstanding (S criteria). The Retail - Restaurants industry group currently has a Relative Strength rating of 91, and leadership (L criteria) from others in the group is also a reassuring sign. |
|
|
Color Codes Explained :
Y - Better candidates highlighted by our
staff of experts.
G - Previously featured
in past reports as yellow but may no longer be buyable under the
guidelines.
***Last / Change / Volume data in this table is the closing quote data***
Symbol/Exchange
Company Name
Industry Group |
PRICE |
CHANGE
(%Change) |
Day High |
Volume
(% DAV)
(% 50 day avg vol) |
52 Wk Hi
% From Hi |
Featured
Date |
Price
Featured |
Pivot Featured |
|
Max Buy |
MPX
-
NYSE
Marine Products Corp
AUTOMOTIVE - Recreational Vehicles
|
$20.37
|
-0.64
-3.05% |
$21.57
|
45,804
117.45% of 50 DAV
50 DAV is 39,000
|
$24.82
-17.93%
|
10/24/2018
|
$23.00
|
PP = $24.92
|
|
MB = $26.17
|
 Most Recent Note - 10/31/2018 5:25:18 PM
G - Still sputtering below its 50 DMA line ($21.60). A rebound above the 50 DMA line is needed for its outlook to improve. Finished weak after highlighted in yellow with pivot point cited based on its 9/12/18 high plus 10 cents in the 10/24/18 mid-day report.
>>> FEATURED STOCK ARTICLE : Weak Finish Amid Widely Negative Market Environment - 10/24/2018 |
View all notes |
Set NEW NOTE alert |
Company Profile |
SEC
News |
Chart |
Request a new note
C
A
S
I |
GMED
-
NYSE
Globus Medical Inc Cl A
CHEMICALS - Specialty Chemicals
|
$52.85
|
+0.43
0.82% |
$53.57
|
545,763
83.32% of 50 DAV
50 DAV is 655,000
|
$57.55
-8.17%
|
9/26/2018
|
$56.11
|
PP = $57.65
|
|
MB = $60.53
|
Most Recent Note - 10/25/2018 5:54:22 PM
G - Sputtering below its 50 DMA line ($52.91) after recent volume-driven losses hurt its outlook. A rebound and subsequent gains above the pivot point backed by more than +40% above average volume are needed to trigger a proper technical buy signal.
>>> FEATURED STOCK ARTICLE : Consolidating After Rally at 200-Day Moving Average Line - 10/22/2018 |
View all notes |
Set NEW NOTE alert |
Company Profile |
SEC
News |
Chart |
Request a new note
C
A
S
I |
ZBRA
-
NASDAQ
Zebra Tech Corp Cl A
COMPUTER HARDWARE - Computer Peripherals
|
$166.30
|
+2.88
1.76% |
$171.42
|
387,116
100.29% of 50 DAV
50 DAV is 386,000
|
$179.47
-7.34%
|
8/7/2018
|
$164.26
|
PP = $161.82
|
|
MB = $169.91
|
Most Recent Note - 10/30/2018 5:12:03 PM
G - Rebounded toward its 50 DMA line ($168). Overhead supply remains up to the $179 level. Found support in recent weeks after a pullback near its 200 DMA line.
>>> FEATURED STOCK ARTICLE : Zebra Tech Sputtering Near 50-Day Moving Average - 10/23/2018 |
View all notes |
Set NEW NOTE alert |
Company Profile |
SEC
News |
Chart |
Request a new note
C
A
S
I |
CME
-
NASDAQ
C M E Group Inc
DIVERSIFIED SERVICES - Business/Management Services
|
$183.24
|
+0.77
0.42% |
$185.11
|
3,028,145
201.21% of 50 DAV
50 DAV is 1,505,000
|
$183.79
-0.30%
|
10/4/2018
|
$179.29
|
PP = $177.45
|
|
MB = $186.32
|
Most Recent Note - 10/31/2018 12:25:41 PM
Y - Perched at a new all-time high with today's 4th consecutive small gain. Found support above its 50 DMA line ($175) after recently reporting earnings +22% on +2% sales revenues for the Sep '18 quarter, below the +25% minimum earnings guideline (C criteria), raising fundamental concerns. Broad market weakness (M criteria) is also a serious concern. The 50 DMA line and prior low ($170.04 on 9/28/18) define important near-term support.
>>> FEATURED STOCK ARTICLE : Perched Near High After Latest Earnings Report Below +25% Minimum - 10/26/2018 |
View all notes |
Set NEW NOTE alert |
Company Profile |
SEC
News |
Chart |
Request a new note
C
A
S
I |
DPZ
-
NYSE
Dominos Pizza Inc
Retail-Restaurants
|
$268.79
|
+2.56
0.96% |
$273.26
|
675,894
118.79% of 50 DAV
50 DAV is 569,000
|
$305.34
-11.97%
|
8/13/2018
|
$288.60
|
PP = $293.91
|
|
MB = $308.61
|
Most Recent Note - 10/31/2018 5:21:22 PM
G - Posted a 2nd consecutive gain after finding support at its 200 DMA line. A subsequent rebound above the 50 DMA line is needed for its outlook to improve. The prior low ($253.63 on 7/31/18) and 200 DMA line define important near-term support to watch. Reported earnings +54% on +22% sales revenues for the Sep '18 quarter, continuing its strong earnings track record. See the latest FSU analysis for more details and a new annotated graph.
>>> FEATURED STOCK ARTICLE : Found Support at 200-Day Moving Average Line - 10/31/2018 |
View all notes |
Set NEW NOTE alert |
Company Profile |
SEC
News |
Chart |
Request a new note
C
A
S
I |
Symbol/Exchange
Company Name
Industry Group |
PRICE |
CHANGE
(%Change) |
Day High |
Volume
(% DAV)
(% 50 day avg vol) |
52 Wk Hi
% From Hi |
Featured
Date |
Price
Featured |
Pivot Featured |
|
Max Buy |
FIVE
-
NASDAQ
Five Below Inc
Retail-DiscountandVariety
|
$113.82
|
-1.50
-1.30% |
$117.72
|
762,087
78.40% of 50 DAV
50 DAV is 972,000
|
$136.13
-16.39%
|
7/6/2018
|
$98.90
|
PP = $104.09
|
|
MB = $109.29
|
Most Recent Note - 10/25/2018 5:59:33 PM
G - A rebound above the 50 DMA line ($120) still is needed for its outlook to improve. Sputtering above the prior high ($109.09 on 7/19/18) which defines the next important support level to watch. See the latest FSU analysis for more details and a new annotated graph.
>>> FEATURED STOCK ARTICLE : Sputtering Below 50-Day Moving Average Near Prior High - 10/25/2018 |
View all notes |
Set NEW NOTE alert |
Company Profile |
SEC
News |
Chart |
Request a new note
C
A
S
I |
HQY
-
NASDAQ
Healthequity Inc
COMPUTER SOFTWARE and SERVICES - Healthcare Information Service
|
$91.80
|
+4.28
4.89% |
$92.20
|
1,565,941
186.87% of 50 DAV
50 DAV is 838,000
|
$99.99
-8.19%
|
8/13/2018
|
$82.39
|
PP = $83.44
|
|
MB = $87.61
|
Most Recent Note - 10/31/2018 5:23:55 PM
G - Gapped up today and posted a big gain with above average volume, rebounding above the 50 DMA line ($90.40) and helping its outlook to improve. Still faces resistance due to overhead supply up to the $99 level.
>>> FEATURED STOCK ARTICLE : Below 50-Day Moving Average Which May Act as Resistance - 10/16/2018 |
View all notes |
Set NEW NOTE alert |
Company Profile |
SEC
News |
Chart |
Request a new note
C
A
S
I |
OLLI
-
NASDAQ
Ollie's Bargain Outlet
Retail-DiscountandVariety
|
$92.90
|
+0.18
0.19% |
$96.30
|
798,868
119.77% of 50 DAV
50 DAV is 667,000
|
$97.61
-4.83%
|
7/12/2018
|
$74.43
|
PP = $77.60
|
|
MB = $81.48
|
Most Recent Note - 10/30/2018 5:14:09 PM
G - Found support near the 50 DMA line ($89.28). The recent low ($84.66 on 10/11/18) defines the next important support to watch. Fundamentals remain strong. See the latest FSU analysis for more details and a new annotated graph.
>>> FEATURED STOCK ARTICLE : Finding Support Near its 50-Day Moving Average - 10/30/2018 |
View all notes |
Set NEW NOTE alert |
Company Profile |
SEC
News |
Chart |
Request a new note
C
A
S
I |
|
|
|
THESE ARE NOT BUY RECOMMENDATIONS!
Comments contained in the body of this report are technical
opinions only. The material herein has been obtained
from sources believed to be reliable and accurate, however,
its accuracy and completeness cannot be guaranteed.
This site is not an investment advisor, hence it does
not endorse or recommend any securities or other investments.
Any recommendation contained in this report may not
be suitable for all investors and it is not to be deemed
an offer or solicitation on our part with respect to
the purchase or sale of any securities. All trademarks,
service marks and trade names appearing in this report
are the property of their respective owners, and are
likewise used for identification purposes only.
This report is a service available
only to active Paid Premium Members.
You may opt-out of receiving report notifications
at any time. Questions or comments may be submitted
by writing to Premium Membership Services 665 S.E. 10 Street, Suite 201 Deerfield Beach, FL 33441-5634 or by calling 1-800-965-8307
or 954-785-1121.
|
|
|