You are not logged in.
This means you
CAN ONLY VIEW reports that were published prior to Tuesday, February 20, 2024.
You
MUST UPGRADE YOUR MEMBERSHIP if you want to see any current reports.
AFTER MARKET UPDATE - FRIDAY, OCTOBER 30TH, 2020
Previous After Market Report Next After Market Report >>>
|
|
|
|
DOW |
-157.51 |
26,501.60 |
-0.59% |
|
Volume |
1,199,028,283 |
+20% |
|
Volume |
3,650,048,200 |
+14% |
|
NASDAQ |
-269.05 |
10,916.55 |
-2.41% |
|
Advancers |
1,167 |
39% |
|
Advancers |
973 |
29% |
|
S&P 500 |
-28.79 |
3,467.31 |
-0.82% |
|
Decliners |
1,807 |
61% |
|
Decliners |
2,423 |
71% |
|
Russell 2000 |
-23.10 |
1,538.48 |
-1.48% |
|
52 Wk Highs |
19 |
|
|
52 Wk Highs |
25 |
|
|
S&P 600 |
-12.07 |
876.59 |
-1.36% |
|
52 Wk Lows |
64 |
|
|
52 Wk Lows |
101 |
|
|
The major indices have clearly seen the latest uptrend come under heavy distributional pressure while leadership has waned. Disciplined investors limit exposure in rough markets and always raise cash by selling individual holdings on a case by case basis as technical weakness is noted.
|
 |
Major Indices Slumped With Heavier Volume and Breadth Negative
Kenneth J. Gruneisen - Passed the CAN SLIM® Master's Exam
The Dow lost 157 points while the S&P 500 declined 1.2% and the Nasdaq Composite fell by 2.5%. All 3 major averages posted their worst weekly performance since March as the Dow declined 6.4% with the S&P 500 and Nasdaq Composite dipping by 5.6% and 5.5% respectively. For the month of October, the Dow fell 4.6% while the S&P 500 and Nasdaq Composite lost 2.7% and 2.3%. The reported volume totals were higher than the prior session on the NYSE and on the Nasdaq exchange, indicative of greater institutional selling pressure. Breadth was negative as decliners led advancers by a 3-2 margin on the NYSE and a 12-5 margin on the Nasdaq exchange. There were 6 high-ranked companies from the Leaders List that hit new 52-week highs and were listed on the BreakOuts Page, versus the total of 12 on the prior session. The new 52-week lows totals expanded and solidly outnumbered shrinking new 52-week highs totals on the NYSE and on the Nasdaq exchange. The major indices have seen their uptrend come under heavier pressure (M criteria) with uncertainty raising some concerns of a more serious market correction. Investors are reminded to always make buying and selling decisions based based on the strict criteria and rules of the fact-based investment system. 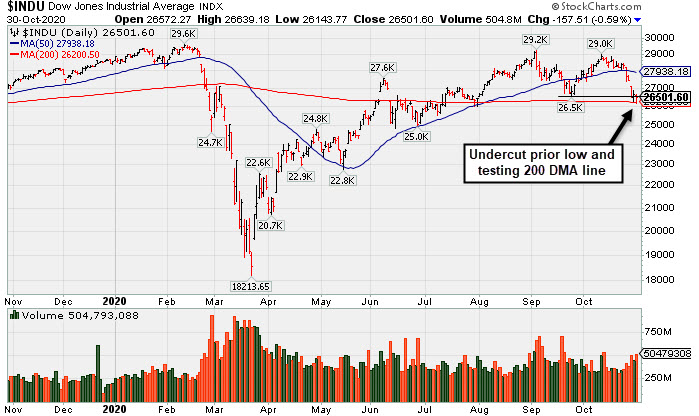 PICTURED: The Dow Jones Industrial Average undercut the September low and is testing its 200-day moving average (DMA) line.
U.S equities finished firmly lower Friday as investors assessed the latest earnings reports from some of Wall Street’s largest companies. All 11 S&P 500 sectors declined with the Technology and Consumer Discretionary groups pacing the losses. Apple (AAPL -5.60%) fell as disappointing iPhone sales overshadowed a top and bottom line beat. Amazon (AMZN -5.45%) fell after the e-commerce giant announced it anticipates rising COVID related costs will provide a headwind to fourth quarter profit margins. Elsewhere, Facebook (FB -6.31%) and Twitter (TWTR -21.11%) slumped after both firms posted strong quarterly results but offered weak updates on the number of active users. Google-parent Alphabet (GOOGL +3.81%) bucked the broader downtrend after the search-giant easily beat analyst revenue projections.
On the data front, the Core PCE Deflator, which is the Fed’s preferred proxy for inflation, rose 1.5% in September from the same period last year, below expectations of a 1.7% increase. Separately, a report showed personal income and spending both increased more than expected in September. Treasuries were weaker, with the yield on the 10-year note climbing four basis points to 0.87%. In commodities, WTI crude slipped 1.4% to $35.67/barrel. |
 Kenneth J. Gruneisen started out as a licensed stockbroker in August 1987, a couple of months prior to the historic stock market crash that took the Dow Jones Industrial Average down -22.6% in a single day. He has published daily fact-based fundamental and technical analysis on high-ranked stocks online for two decades. Through FACTBASEDINVESTING.COM, Kenneth provides educational articles, news, market commentary, and other information regarding proven investment systems that work in good times and bad.
Comments contained in the body of this report are technical opinions only and are not necessarily those of Gruneisen Growth Corp. The material herein has been obtained from sources believed to be reliable and accurate, however, its accuracy and completeness cannot be guaranteed. Our firm, employees, and customers may effect transactions, including transactions contrary to any recommendation herein, or have positions in the securities mentioned herein or options with respect thereto. Any recommendation contained in this report may not be suitable for all investors and it is not to be deemed an offer or solicitation on our part with respect to the purchase or sale of any securities. |
|
 |
Bank and Commodity-Linked Groups Rose; Retail and Tech Fell
Kenneth J. Gruneisen - Passed the CAN SLIM® Master's Exam
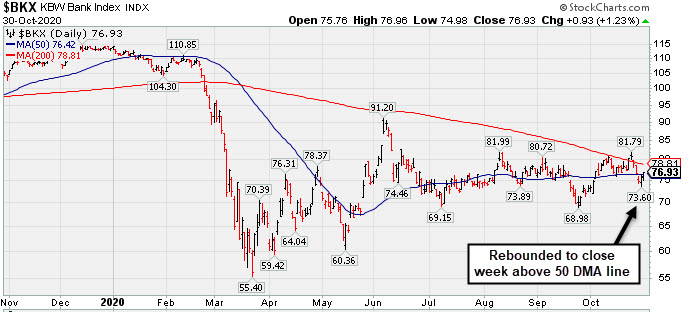
The Bank Index ($BKX +1.23%) notched a gain while the Broker/Dealer Index ($XBD -0.16%) was little changed and the Retail Index ($RLX -3.70%) created a big drag on the major indices. The tech sector had a negative bias as the Semiconductor Index ($SOX -1.64%), Networking Index ($NWX -1.47%), and Biotech Index ($BTK -0.92%) suffered unanimous losses. Commodity-linked groups had a positive bias as the Oil Services Index ($OSX +2.43%) and Integrated Oil Index ($XOI +1.07%) both rose and the Gold & Silver Index ($XAU +1.75%) also notched a gain.
PICTURED: The Bank Index ($BKX +1.23%) rebounded to close the week above its 50-day moving average (DMA) line.
| Oil Services |
$OSX |
27.73 |
+0.66 |
+2.43% |
-64.58% |
| Integrated Oil |
$XOI |
564.69 |
+5.98 |
+1.07% |
-55.56% |
| Semiconductor |
$SOX |
2,246.15 |
-37.50 |
-1.64% |
+21.44% |
| Networking |
$NWX |
529.16 |
-7.92 |
-1.47% |
-9.30% |
| Broker/Dealer |
$XBD |
296.84 |
-0.46 |
-0.16% |
+2.22% |
| Retail |
$RLX |
3,279.02 |
-125.99 |
-3.70% |
+33.88% |
| Gold & Silver |
$XAU |
140.32 |
+2.42 |
+1.75% |
+31.24% |
| Bank |
$BKX |
76.93 |
+0.93 |
+1.23% |
-32.13% |
| Biotech |
$BTK |
5,212.89 |
-48.50 |
-0.92% |
+2.87% |
|
|
|
 |
Featured Stocks
Kenneth J. Gruneisen - Passed the CAN SLIM® Master's Exam
|
|
|
Color Codes Explained :
Y - Better candidates highlighted by our
staff of experts.
G - Previously featured
in past reports as yellow but may no longer be buyable under the
guidelines.
***Last / Change / Volume data in this table is the closing quote data***
Symbol/Exchange
Company Name
Industry Group |
PRICE |
CHANGE
(%Change) |
Day High |
Volume
(% DAV)
(% 50 day avg vol) |
52 Wk Hi
% From Hi |
Featured
Date |
Price
Featured |
Pivot Featured |
|
Max Buy |
 ADBE
-
NASDAQ
ADBE
-
NASDAQ
Adobe Inc
COMPUTER SOFTWARE and SERVICES - Application Software
|
$447.10
|
-14.01
-3.04% |
$459.50
|
3,121,695
99.83% of 50 DAV
50 DAV is 3,127,000
|
$536.88
-16.72%
|
9/10/2020
|
$488.46
|
PP = $536.88
|
|
MB = $563.72
|
 Most Recent Note - 10/30/2020 2:21:36 PM
Volume is light while violating the prior low ($452.52 on 9/18/20) with today's loss triggering a worrisome technical sell signal. It will be dropped from the Featured Stocks list tonight. A rebound above the 50 DMA line ($488) is needed for its outlook to improve.
>>> FEATURED STOCK ARTICLE : Slump Below 50-Day Moving Average Again Raises Concerns - 10/22/2020 |
View all notes |
Set NEW NOTE alert |
Company Profile |
SEC
News |
Chart |
Request a new note
C
A
S
I |
CRL
-
NYSE
Charles River Labs Intl
DRUGS - Biotechnology
|
$227.70
|
-1.24
-0.54% |
$229.74
|
488,436
153.11% of 50 DAV
50 DAV is 319,000
|
$250.29
-9.03%
|
7/15/2020
|
$192.66
|
PP = $189.95
|
|
MB = $199.45
|
Most Recent Note - 10/29/2020 12:26:20 PM
G - Finding prompt support near its 50 DMA line ($224) with today's gain. Reported Sep '20 quarterly earnings +38% on +11% sales revenues versus the year ago period, above the +25% minimum earnings guideline (C criteria). Volume and volatility often increase near earnings news. See the latest FSU analysis for more details and an annotated graph.
>>> FEATURED STOCK ARTICLE : Earnings Due; Consolidating Near Prior High and Above 50 DMA Line - 10/27/2020 |
View all notes |
Set NEW NOTE alert |
Company Profile |
SEC
News |
Chart |
Request a new note
C
A
S
I |
AMD
-
NASDAQ
Advanced Micro Devices
ELECTRONICS - Semiconductor - Broad Line
|
$75.29
|
-2.73
-3.50% |
$77.70
|
51,241,593
94.97% of 50 DAV
50 DAV is 53,954,000
|
$94.28
-20.14%
|
8/31/2020
|
$90.42
|
PP = $87.39
|
|
MB = $91.76
|
Most Recent Note - 10/30/2020 2:23:59 PM
G - Damaging losses with heavy volume raised concerns while slumping toward the prior low ($73.85 on 9/18/20) . Weak action came after it reported earnings +128% on +56% sales revenues for the Sep '20 quarter versus the year ago period and announced it will acquire Xilinx Inc (XLNX). A violation of the recent low ($73.85 on 9/18/20) would raise greater concerns and trigger a more worrisome technical sell signal. Faces near-term resistance due to overhead supply up to the $94 level.
>>> FEATURED STOCK ARTICLE : Consolidating Just Above 50-Day Moving Average - 10/14/2020 |
View all notes |
Set NEW NOTE alert |
Company Profile |
SEC
News |
Chart |
Request a new note
C
A
S
I |
TER
-
NASDAQ
Teradyne Inc
ELECTRONICS - Semiconductor Equipment and Mate
|
$87.85
|
-0.69
-0.78% |
$88.15
|
1,580,353
67.71% of 50 DAV
50 DAV is 2,334,000
|
$93.44
-5.98%
|
10/21/2020
|
$92.22
|
PP = $93.54
|
|
MB = $98.22
|
Most Recent Note - 10/29/2020 6:10:25 PM
Y - Posted a gain today with light volume. It remains perched within striking distance of its all-time high. A subsequent gain above the pivot point backed by at least +40% above average volume may trigger a technical buy signal. Reported earnings +53% on +41% sales revenues for the Sep '20 quarter versus the year ago period, its 4th consecutive quarterly comparison with earnings above the +25% minimum earnings guideline (C criteria). Sequential comparisons show encouraging acceleration in its sales revenues growth rate. Its annual earnings (A criteria) history has been strong.
>>> FEATURED STOCK ARTICLE : Challenging All-Time High With Volume-Drive Gain - 10/21/2020 |
View all notes |
Set NEW NOTE alert |
Company Profile |
SEC
News |
Chart |
Request a new note
C
A
S
I |
TREX
-
NYSE
Trex Company Inc
MATERIALS and CONSTRUCTION - General Building Materials
|
$69.54
|
-1.93
-2.70% |
$72.63
|
647,035
84.36% of 50 DAV
50 DAV is 767,000
|
$81.23
-14.39%
|
6/26/2020
|
$54.53
|
PP = $66.47
|
|
MB = $69.79
|
Most Recent Note - 10/30/2020 2:30:25 PM
G - Due to report Sep '20 quarterly results on 11/02/20. Volume and volatility often increase near earnings news. Slumping further below its 50 DMA line ($73) with today's 5th consecutive loss. Prior low ($63.32 on 9/21/20) defines the next near-term support.
>>> FEATURED STOCK ARTICLE : Recently Wedged Into New High Territory - 10/16/2020 |
View all notes |
Set NEW NOTE alert |
Company Profile |
SEC
News |
Chart |
Request a new note
C
A
S
I |
Symbol/Exchange
Company Name
Industry Group |
PRICE |
CHANGE
(%Change) |
Day High |
Volume
(% DAV)
(% 50 day avg vol) |
52 Wk Hi
% From Hi |
Featured
Date |
Price
Featured |
Pivot Featured |
|
Max Buy |
NFLX
-
NASDAQ
Netflix Inc
SPECIALTY RETAIL - Music and Video Stores
|
$475.74
|
-28.47
-5.65% |
$505.88
|
7,792,346
120.38% of 50 DAV
50 DAV is 6,473,000
|
$575.37
-17.32%
|
10/14/2020
|
$547.45
|
PP = $557.39
|
|
MB = $585.26
|
Most Recent Note - 10/30/2020 2:18:06 PM
Slumping considerably today after it met resistance at its 50 DMA line ($507) and it will be dropped from the Featured Stocks list tonight. Damaging losses last week triggered a technical sell signal. Concerns were raised by noted fundamental and technical deterioration. Reported earnings +18% on +23% sales revenues for the Sep '20 quarter, below the +25% minimum earnings guideline (C criteria). Prior low ($458.60 on 9/18/20) defines important near term support. Any violation would raise serious concerns and trigger a more worrisome technical sell signal.
>>> FEATURED STOCK ARTICLE : Encountered Distributional Pressure When Poised for Breakout - 10/15/2020 |
View all notes |
Set NEW NOTE alert |
Company Profile |
SEC
News |
Chart |
Request a new note
C
A
S
I |
LGIH
-
NASDAQ
L G I Homes Inc
Bldg-Resident/Comml
|
$106.88
|
-1.91
-1.76% |
$110.09
|
236,791
92.86% of 50 DAV
50 DAV is 255,000
|
$132.98
-19.63%
|
10/1/2020
|
$123.17
|
PP = $124.04
|
|
MB = $130.24
|
Most Recent Note - 10/29/2020 6:08:57 PM
G - Volume was below average for the past 4 sessions while sputtering further below its 50 DMA line ($116.61). A rebound above the 50 DMA line is needed for its outlook to improve. Members were cautioned with recent notes - "Recent gains above the new pivot point lacked the +40% above average volume needed to clinch a proper new (or add-on) technical buy signal."
>>> FEATURED STOCK ARTICLE : Hovering Near High But Recent Gains Lacked Great Volume - 10/19/2020 |
View all notes |
Set NEW NOTE alert |
Company Profile |
SEC
News |
Chart |
Request a new note
C
A
S
I |
NOW
-
NYSE
Servicenow Inc
Computer Sftwr-Enterprse
|
$497.57
|
-13.02
-2.55% |
$507.98
|
1,868,848
138.33% of 50 DAV
50 DAV is 1,351,000
|
$533.37
-6.71%
|
8/20/2020
|
$453.34
|
PP = $454.79
|
|
MB = $477.53
|
Most Recent Note - 10/29/2020 6:02:10 PM
G - Reported Sep '20 quarterly earnings +22% on +30% sales revenues versus the year ago period, below the +25% minimum guideline (C criteria) of the fact-based investment system. Gapped up today after testing and again finding prompt support at its 50 DMA line. Subsequent losses below the 50 DMA line and prior low ($432.85 on 9/08/20) would raise concerns and trigger technical sell signals. See the latest FSU analysis for more details and a new annotated graph.
>>> FEATURED STOCK ARTICLE : Found Prompt Support at 50 DMA Line After Earnings News - 10/29/2020 |
View all notes |
Set NEW NOTE alert |
Company Profile |
SEC
News |
Chart |
Request a new note
C
A
S
I |
VEEV
-
NYSE
Veeva Systems Inc Cl A
Computer Sftwr-Medical
|
$270.05
|
-14.63
-5.14% |
$282.00
|
1,375,648
168.17% of 50 DAV
50 DAV is 818,000
|
$313.99
-13.99%
|
10/6/2020
|
$287.71
|
PP = $298.86
|
|
MB = $313.80
|
Most Recent Note - 10/30/2020 1:06:34 PM
G - Color code is changed to green as it gapped down today for a big loss on higher volume violating its 50 DMA line ($281) and triggering a technical sell signal. Fundamentals remain strong.
>>> FEATURED STOCK ARTICLE : Recently Slumped Back Below Prior Highs - 10/26/2020 |
View all notes |
Set NEW NOTE alert |
Company Profile |
SEC
News |
Chart |
Request a new note
C
A
S
I |
TEAM
-
NASDAQ
Atlassian Corp Plc Cl A
Comp Sftwr-Spec Enterprs
|
$191.62
|
-19.10
-9.06% |
$199.99
|
5,585,627
349.76% of 50 DAV
50 DAV is 1,597,000
|
$216.30
-11.41%
|
10/12/2020
|
$193.77
|
PP = $199.60
|
|
MB = $209.58
|
Most Recent Note - 10/30/2020 1:01:42 PM
G - Gapped down today and slumped below its pivot point testing its 50 DMA line ($187). Weak action came after it reported earnings +7% on +26% sales revenues for the Sep '20 quarter versus the year ago period, well below the +25% minimum earnings guideline (C criteria), raising concerns.
>>> FEATURED STOCK ARTICLE : TEAM Perched Within Close Striking Distance of New Highs - 10/12/2020 |
View all notes |
Set NEW NOTE alert |
Company Profile |
SEC
News |
Chart |
Request a new note
C
A
S
I |
Symbol/Exchange
Company Name
Industry Group |
PRICE |
CHANGE
(%Change) |
Day High |
Volume
(% DAV)
(% 50 day avg vol) |
52 Wk Hi
% From Hi |
Featured
Date |
Price
Featured |
Pivot Featured |
|
Max Buy |
|
|
|
THESE ARE NOT BUY RECOMMENDATIONS!
Comments contained in the body of this report are technical
opinions only. The material herein has been obtained
from sources believed to be reliable and accurate, however,
its accuracy and completeness cannot be guaranteed.
This site is not an investment advisor, hence it does
not endorse or recommend any securities or other investments.
Any recommendation contained in this report may not
be suitable for all investors and it is not to be deemed
an offer or solicitation on our part with respect to
the purchase or sale of any securities. All trademarks,
service marks and trade names appearing in this report
are the property of their respective owners, and are
likewise used for identification purposes only.
This report is a service available
only to active Paid Premium Members.
You may opt-out of receiving report notifications
at any time. Questions or comments may be submitted
by writing to Premium Membership Services 665 S.E. 10 Street, Suite 201 Deerfield Beach, FL 33441-5634 or by calling 1-800-965-8307
or 954-785-1121.
|
|
|