You are not logged in.
This means you
CAN ONLY VIEW reports that were published prior to Monday, February 19, 2024.
You
MUST UPGRADE YOUR MEMBERSHIP if you want to see any current reports.
AFTER MARKET UPDATE - THURSDAY, OCTOBER 29TH, 2020
Previous After Market Report Next After Market Report >>>
|
|
|
|
DOW |
+139.16 |
26,659.11 |
+0.52% |
|
Volume |
1,001,223,202 |
-8% |
|
Volume |
3,211,108,100 |
-18% |
|
NASDAQ |
+180.72 |
11,185.59 |
+1.64% |
|
Advancers |
1,986 |
66% |
|
Advancers |
2,182 |
64% |
|
S&P 500 |
-28.79 |
3,467.31 |
-0.82% |
|
Decliners |
1,020 |
34% |
|
Decliners |
1,204 |
36% |
|
Russell 2000 |
+18.30 |
1,561.58 |
+1.19% |
|
52 Wk Highs |
20 |
|
|
52 Wk Highs |
40 |
|
|
S&P 600 |
+13.82 |
888.66 |
+1.58% |
|
52 Wk Lows |
87 |
|
|
52 Wk Lows |
87 |
|
|
The major indices have clearly seen the latest uptrend come under heavy distributional pressure while leadership has waned. Disciplined investors limit exposure in rough markets and always raise cash by selling individual holdings on a case by case basis as technical weakness is noted.
|
 |
Major Indices Rose With Lighter Volume Totals Reported
Kenneth J. Gruneisen - Passed the CAN SLIM® Master's Exam
The Dow snapped a four session losing streak, rising 139 points. The S&P 500 advanced 1.2%, while the Nasdaq Composite rallied 1.6%. The reported volume totals were lighter than the prior session on the NYSE and on the Nasdaq exchange, indicative of lackluster institutional buying demand. Breadth was positive as advancers led decliners by almost a 2-1 margin on the NYSE and an 11-6 margin on the Nasdaq exchange. There were 12 high-ranked companies from the Leaders List that hit new 52-week highs and were listed on the BreakOuts Page, versus the total of 8 on the prior session. The new 52-week lows totals contracted yet still outnumbered new 52-week highs totals on the NYSE and on the Nasdaq exchange. The major indices have seen their uptrend again come under pressure (M criteria) with uncertainty raising some concerns. Investors are reminded to always make buying and selling decisions based based on the strict criteria and rules of the fact-based investment system. 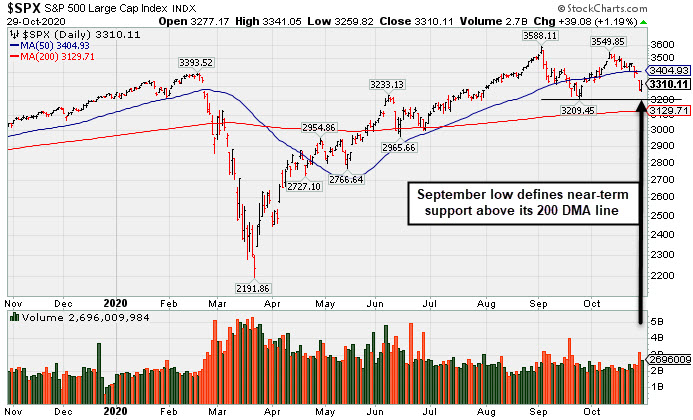 PICTURED: The Nasdaq Composite Index is slumping below its 50-day moving average (DMA) line toward the September low.
U.S. equities finished firmly higher on Thursday, as investors focused on mostly upbeat earnings and economic data updates. The gains followed Wednesday’s session in which stocks notched their worst one-day performance since June, as a worsening trend of coronavirus infection rates and hospitalizations dented investor confidence in the global economic recovery.
On the data front, the first reading of third-quarter GDP showed the U.S. economy expanded at a better-than-expected 33.1% annualized pace in the July through September period. This followed a record 31.4% slump in the second quarter. A separate report showed weekly initial jobless claims declined to 751,000 in the most recent week from the prior upwardly revised 791,000 figure. Another release showed pending home sales unexpectedly dipped 2.2% in September. Treasuries declined, with the yield on the ten-year note jumping six basis points to 0.83%.
Ten of 11 S&P 500 sectors ended in positive territory, with Health Care stocks the lone laggard. The Communication Services and Technology groups outperformed on a relative basis, with the oft-cited FAANG group adding 4.4%. In earnings, Ford Motor (F +2.99%) rose after easily topping Wall Street’s expectations, and reporting stronger-than-expected demand during the pandemic. Pinterest (PINS +26.82%) rose after reporting 49% revenue growth in the third quarter. Meanwhile, Spotify (SPOT -3.36%) fell after missing revenue estimates. In M&A news, semiconductor device maker Inphi Corp (IPHI +26.70%) surged after agreeing to be acquired by rival Marvell (MRVL -3.34%) in a cash and stock deal worth $10 billion. |
 Kenneth J. Gruneisen started out as a licensed stockbroker in August 1987, a couple of months prior to the historic stock market crash that took the Dow Jones Industrial Average down -22.6% in a single day. He has published daily fact-based fundamental and technical analysis on high-ranked stocks online for two decades. Through FACTBASEDINVESTING.COM, Kenneth provides educational articles, news, market commentary, and other information regarding proven investment systems that work in good times and bad.
Comments contained in the body of this report are technical opinions only and are not necessarily those of Gruneisen Growth Corp. The material herein has been obtained from sources believed to be reliable and accurate, however, its accuracy and completeness cannot be guaranteed. Our firm, employees, and customers may effect transactions, including transactions contrary to any recommendation herein, or have positions in the securities mentioned herein or options with respect thereto. Any recommendation contained in this report may not be suitable for all investors and it is not to be deemed an offer or solicitation on our part with respect to the purchase or sale of any securities. |
|
 |
Financial, Semiconductor, and Commodity-Linked Groups Led Gainers
Kenneth J. Gruneisen - Passed the CAN SLIM® Master's Exam
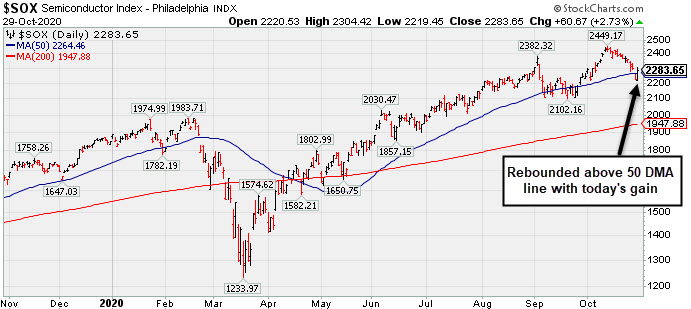
Financials were a positive influence on the major indices as the Bank Index ($BKX +1.62%) and Broker/Dealer Index ($XBD +1.00%) both rose and each outpaced the Retail Index ($RLX +0.85%). The Semiconductor Index ($SOX +2.73%) led the tech sector while the Networking Index ($NWX +0.61%) and Biotech Index ($BTK +0.24%) both edged only slightly higher. Commodity-linked groups also had a positive bias as the Oil Services Index ($OSX +2.94%) and Integrated Oil Index ($XOI +2.98%) both outpaced the Gold & Silver Index ($XAU +1.67%).
PICTURED: The Semiconductor Index ($SOX +2.73%) made a stand near its 50 DMA line.
| Oil Services |
$OSX |
27.07 |
+0.77 |
+2.94% |
-65.42% |
| Integrated Oil |
$XOI |
558.71 |
+16.18 |
+2.98% |
-56.03% |
| Semiconductor |
$SOX |
2,283.65 |
+60.67 |
+2.73% |
+23.47% |
| Networking |
$NWX |
537.08 |
+3.26 |
+0.61% |
-7.94% |
| Broker/Dealer |
$XBD |
297.30 |
+2.95 |
+1.00% |
+2.38% |
| Retail |
$RLX |
3,405.01 |
+28.59 |
+0.85% |
+39.02% |
| Gold & Silver |
$XAU |
137.90 |
+2.26 |
+1.67% |
+28.98% |
| Bank |
$BKX |
76.00 |
+1.21 |
+1.62% |
-32.96% |
| Biotech |
$BTK |
5,261.39 |
+12.58 |
+0.24% |
+3.83% |
|
|
|
 |
Found Prompt Support at 50 DMA Line After Earnings News
Kenneth J. Gruneisen - Passed the CAN SLIM® Master's Exam
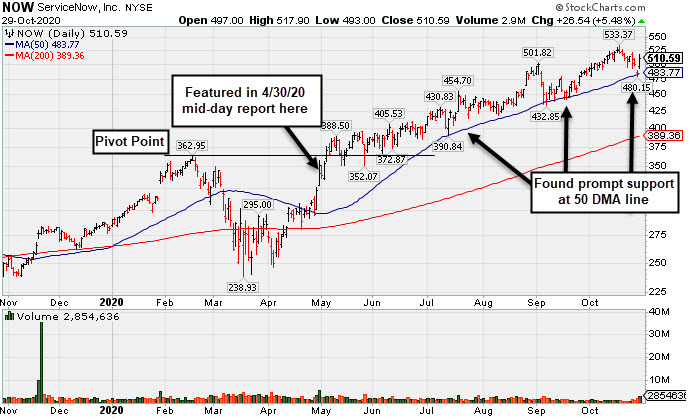
ServiceNow Inc (NOW +$26.54 or +5.48% to $510.59) posted a solid volume-driven gain today. It reported Sep '20 quarterly earnings +22% on +30% sales revenues versus the year ago period, below the +25% minimum guideline (C criteria) of the fact-based investment system. It gapped up after testing and finding prompt support at its 50-day moving average (DMA) line ($483.77) with 3 consecutive volume-driven losses. Subsequent losses below the 50 DMA line and prior low ($432.85 on 9/08/20) would raise concerns and trigger technical sell signals.
It reported Jun '20 quarterly earnings +73% on +28% sales revenues versus the year ago period prior results had been routinely above the +25% minimum earnings guideline (C criteria). It has an Earnings Per Share Rating of 99. The Computer Software - Enterprise group has a Group Relative Strength Rating of 96, a reassuring sign concerning the L criteria. NOW has a new CEO as of 1/01/20.
NOW traded up as much as +55.4% since first highlighted in yellow in the 4/30/20 mid-day report with a pivot point based on its 2/19/20 high plus 10 cents (read here). It was last shown in this FSU section on 10/13/20 with an annotated graph under the headline, "Record High With Light Volume Behind 3rd Consecutive Gain". The number of top-rated funds owning its shares rose from 1,030 in Jun '17 to 2.396 in Sep '20, a reassuring sign concerning the I criteria. It has a Timeliness Rating of A and a Sponsorship Rating of A. Its current Up/Down Volume Ratio of 0.8 is an unbiased indication its shares have been under distributional pressure over the past 50 days. |
|
|
Color Codes Explained :
Y - Better candidates highlighted by our
staff of experts.
G - Previously featured
in past reports as yellow but may no longer be buyable under the
guidelines.
***Last / Change / Volume data in this table is the closing quote data***
Symbol/Exchange
Company Name
Industry Group |
PRICE |
CHANGE
(%Change) |
Day High |
Volume
(% DAV)
(% 50 day avg vol) |
52 Wk Hi
% From Hi |
Featured
Date |
Price
Featured |
Pivot Featured |
|
Max Buy |
 ADBE
-
NASDAQ
ADBE
-
NASDAQ
Adobe Inc
COMPUTER SOFTWARE and SERVICES - Application Software
|
$461.11
|
+4.14
0.91% |
$464.73
|
2,121,736
67.72% of 50 DAV
50 DAV is 3,133,000
|
$536.88
-14.11%
|
9/10/2020
|
$488.46
|
PP = $536.88
|
|
MB = $563.72
|
Most Recent Note - 10/28/2020 6:07:48 PM
G - Gapped down and slumped further below its 50 DMA line ($489) for a new low close with today's loss on lighter volume. Testing the prior low ($452.52 on 9/18/20) which defines the next important support to watch. Only a prompt rebound above the 50 DMA line would help its outlook improve. Fundamentals remain strong.
>>> FEATURED STOCK ARTICLE : Slump Below 50-Day Moving Average Again Raises Concerns - 10/22/2020 |
View all notes |
Set NEW NOTE alert |
Company Profile |
SEC
News |
Chart |
Request a new note
C
A
S
I |
CRL
-
NYSE
Charles River Labs Intl
DRUGS - Biotechnology
|
$228.94
|
+6.94
3.13% |
$234.71
|
578,505
184.83% of 50 DAV
50 DAV is 313,000
|
$250.29
-8.53%
|
7/15/2020
|
$192.66
|
PP = $189.95
|
|
MB = $199.45
|
 Most Recent Note - 10/29/2020 12:26:20 PM
G - Finding prompt support near its 50 DMA line ($224) with today's gain. Reported Sep '20 quarterly earnings +38% on +11% sales revenues versus the year ago period, above the +25% minimum earnings guideline (C criteria). Volume and volatility often increase near earnings news. See the latest FSU analysis for more details and an annotated graph.
>>> FEATURED STOCK ARTICLE : Earnings Due; Consolidating Near Prior High and Above 50 DMA Line - 10/27/2020 |
View all notes |
Set NEW NOTE alert |
Company Profile |
SEC
News |
Chart |
Request a new note
C
A
S
I |
AMD
-
NASDAQ
Advanced Micro Devices
ELECTRONICS - Semiconductor - Broad Line
|
$78.02
|
+1.62
2.12% |
$79.18
|
52,590,287
98.03% of 50 DAV
50 DAV is 53,648,000
|
$94.28
-17.25%
|
8/31/2020
|
$90.42
|
PP = $87.39
|
|
MB = $91.76
|
Most Recent Note - 10/28/2020 6:13:32 PM
G - Suffered a 2nd consecutive loss with heavy volume raising concerns. Weak action came after it reported earnings +128% on +56% sales revenues for the Sep '20 quarter versus the year ago period and announced it will acquire Xilinx Inc (XLNX). Any subsequent deterioration below the recent lows ($73.85 on 9/18/20) would raise greater concerns and trigger a more worrisome technical sell signal. Faces near-term resistance due to overhead supply up to the $94 level.
>>> FEATURED STOCK ARTICLE : Consolidating Just Above 50-Day Moving Average - 10/14/2020 |
View all notes |
Set NEW NOTE alert |
Company Profile |
SEC
News |
Chart |
Request a new note
C
A
S
I |
TER
-
NASDAQ
Teradyne Inc
ELECTRONICS - Semiconductor Equipment and Mate
|
$88.54
|
+3.00
3.51% |
$89.34
|
1,615,655
69.70% of 50 DAV
50 DAV is 2,318,000
|
$93.44
-5.24%
|
10/21/2020
|
$92.22
|
PP = $93.54
|
|
MB = $98.22
|
Most Recent Note - 10/29/2020 6:10:25 PM
Y - Posted a gain today with light volume. It remains perched within striking distance of its all-time high. A subsequent gain above the pivot point backed by at least +40% above average volume may trigger a technical buy signal. Reported earnings +53% on +41% sales revenues for the Sep '20 quarter versus the year ago period, its 4th consecutive quarterly comparison with earnings above the +25% minimum earnings guideline (C criteria). Sequential comparisons show encouraging acceleration in its sales revenues growth rate. Its annual earnings (A criteria) history has been strong.
>>> FEATURED STOCK ARTICLE : Challenging All-Time High With Volume-Drive Gain - 10/21/2020 |
View all notes |
Set NEW NOTE alert |
Company Profile |
SEC
News |
Chart |
Request a new note
C
A
S
I |
TREX
-
NYSE
Trex Company Inc
MATERIALS and CONSTRUCTION - General Building Materials
|
$71.47
|
-0.25
-0.35% |
$72.75
|
922,748
120.62% of 50 DAV
50 DAV is 765,000
|
$81.23
-12.02%
|
6/26/2020
|
$54.53
|
PP = $66.47
|
|
MB = $69.79
|
Most Recent Note - 10/27/2020 7:24:16 PM
G - Pulled back further today testing its 50 DMA line ($73.14). Any subsequent losses below it or below the recent low ($63.32 on 9/21/20) would raise concerns and trigger technical sell signals. Fundamentals remain strong.
>>> FEATURED STOCK ARTICLE : Recently Wedged Into New High Territory - 10/16/2020 |
View all notes |
Set NEW NOTE alert |
Company Profile |
SEC
News |
Chart |
Request a new note
C
A
S
I |
Symbol/Exchange
Company Name
Industry Group |
PRICE |
CHANGE
(%Change) |
Day High |
Volume
(% DAV)
(% 50 day avg vol) |
52 Wk Hi
% From Hi |
Featured
Date |
Price
Featured |
Pivot Featured |
|
Max Buy |
NFLX
-
NASDAQ
Netflix Inc
SPECIALTY RETAIL - Music and Video Stores
|
$504.21
|
+17.97
3.70% |
$513.90
|
10,892,817
172.55% of 50 DAV
50 DAV is 6,313,000
|
$575.37
-12.37%
|
10/14/2020
|
$547.45
|
PP = $557.39
|
|
MB = $585.26
|
Most Recent Note - 10/29/2020 6:07:37 PM
G - Posted a big gain today with above average volume but met resistance at its 50 DMA line ($507). Damaging losses last week triggered a technical sell signal. Concerns were raised by noted fundamental and technical deterioration. Reported earnings +18% on +23% sales revenues for the Sep '20 quarter, below the +25% minimum earnings guideline (C criteria). Recent low ($458.60 on 9/18/20) defines the next important near term support where any violation would raise serious concerns and trigger a more worrisome technical sell signal.
>>> FEATURED STOCK ARTICLE : Encountered Distributional Pressure When Poised for Breakout - 10/15/2020 |
View all notes |
Set NEW NOTE alert |
Company Profile |
SEC
News |
Chart |
Request a new note
C
A
S
I |
LGIH
-
NASDAQ
L G I Homes Inc
Bldg-Resident/Comml
|
$108.79
|
-3.40
-3.03% |
$113.46
|
191,101
74.65% of 50 DAV
50 DAV is 256,000
|
$132.98
-18.19%
|
10/1/2020
|
$123.17
|
PP = $124.04
|
|
MB = $130.24
|
Most Recent Note - 10/29/2020 6:08:57 PM
G - Volume was below average for the past 4 sessions while sputtering further below its 50 DMA line ($116.61). A rebound above the 50 DMA line is needed for its outlook to improve. Members were cautioned with recent notes - "Recent gains above the new pivot point lacked the +40% above average volume needed to clinch a proper new (or add-on) technical buy signal."
>>> FEATURED STOCK ARTICLE : Hovering Near High But Recent Gains Lacked Great Volume - 10/19/2020 |
View all notes |
Set NEW NOTE alert |
Company Profile |
SEC
News |
Chart |
Request a new note
C
A
S
I |
NOW
-
NYSE
Servicenow Inc
Computer Sftwr-Enterprse
|
$510.59
|
+26.54
5.48% |
$517.90
|
2,854,023
214.11% of 50 DAV
50 DAV is 1,333,000
|
$533.37
-4.27%
|
8/20/2020
|
$453.34
|
PP = $454.79
|
|
MB = $477.53
|
Most Recent Note - 10/29/2020 6:02:10 PM
G - Reported Sep '20 quarterly earnings +22% on +30% sales revenues versus the year ago period, below the +25% minimum guideline (C criteria) of the fact-based investment system. Gapped up today after testing and again finding prompt support at its 50 DMA line. Subsequent losses below the 50 DMA line and prior low ($432.85 on 9/08/20) would raise concerns and trigger technical sell signals. See the latest FSU analysis for more details and a new annotated graph.
>>> FEATURED STOCK ARTICLE : Found Prompt Support at 50 DMA Line After Earnings News - 10/29/2020 |
View all notes |
Set NEW NOTE alert |
Company Profile |
SEC
News |
Chart |
Request a new note
C
A
S
I |
VEEV
-
NYSE
Veeva Systems Inc Cl A
Computer Sftwr-Medical
|
$284.68
|
-2.59
-0.90% |
$292.48
|
542,539
66.41% of 50 DAV
50 DAV is 817,000
|
$313.99
-9.33%
|
10/6/2020
|
$287.71
|
PP = $298.86
|
|
MB = $313.80
|
Most Recent Note - 10/28/2020 6:04:42 PM
Y - Gapped down today for a big loss on higher (near average) volume amid widespread market weakness. Recently slumped back below its pivot point raising some concerns. The 50 DMA line ($281) defines important near-term support where a violation would trigger a technical sell signal. Fundamentals remain strong.
>>> FEATURED STOCK ARTICLE : Recently Slumped Back Below Prior Highs - 10/26/2020 |
View all notes |
Set NEW NOTE alert |
Company Profile |
SEC
News |
Chart |
Request a new note
C
A
S
I |
TEAM
-
NASDAQ
Atlassian Corp Plc Cl A
Comp Sftwr-Spec Enterprs
|
$210.72
|
+1.86
0.89% |
$212.67
|
1,798,798
113.13% of 50 DAV
50 DAV is 1,590,000
|
$216.30
-2.58%
|
10/12/2020
|
$193.77
|
PP = $199.60
|
|
MB = $209.58
|
Most Recent Note - 10/27/2020 7:28:58 PM
G - Posted a gain today with light volume for its best-ever close and its color code is changed to green after rising back above its "max buy" level. Prior highs in the $199 area define initial support to watch above its 50 DMA line.
>>> FEATURED STOCK ARTICLE : TEAM Perched Within Close Striking Distance of New Highs - 10/12/2020 |
View all notes |
Set NEW NOTE alert |
Company Profile |
SEC
News |
Chart |
Request a new note
C
A
S
I |
Symbol/Exchange
Company Name
Industry Group |
PRICE |
CHANGE
(%Change) |
Day High |
Volume
(% DAV)
(% 50 day avg vol) |
52 Wk Hi
% From Hi |
Featured
Date |
Price
Featured |
Pivot Featured |
|
Max Buy |
|
|
|
THESE ARE NOT BUY RECOMMENDATIONS!
Comments contained in the body of this report are technical
opinions only. The material herein has been obtained
from sources believed to be reliable and accurate, however,
its accuracy and completeness cannot be guaranteed.
This site is not an investment advisor, hence it does
not endorse or recommend any securities or other investments.
Any recommendation contained in this report may not
be suitable for all investors and it is not to be deemed
an offer or solicitation on our part with respect to
the purchase or sale of any securities. All trademarks,
service marks and trade names appearing in this report
are the property of their respective owners, and are
likewise used for identification purposes only.
This report is a service available
only to active Paid Premium Members.
You may opt-out of receiving report notifications
at any time. Questions or comments may be submitted
by writing to Premium Membership Services 665 S.E. 10 Street, Suite 201 Deerfield Beach, FL 33441-5634 or by calling 1-800-965-8307
or 954-785-1121.
|
|
|